Hostname: page-component-78c5997874-xbtfd Total loading time: 0 Render date: 2024-11-08T07:28:14.922Z Has data issue: false hasContentIssue false

Experimental study of the effect of particle–wall interactions on inertial particle dynamics in wall turbulence

Published online by Cambridge University Press:  26 March 2024

G.H. Wang
Affiliation:
Center for Particle-Laden Turbulence, Lanzhou University, Lanzhou 730000, PR China
W.B. Chen
Affiliation:
Center for Particle-Laden Turbulence, Lanzhou University, Lanzhou 730000, PR China
X.J. Zheng*
Affiliation:
Research Center for Applied Mechanics, Xidian University, Xi'an 710071, PR China
*
Email address for correspondence: xjzheng@lzu.edu.cn

Abstract

Based on Voronoi analysis, the properties related to the near-wall motion of particles in a turbulent boundary layer were experimentally investigated via different release modes, with a friction Reynolds number $Re_\tau =3530$. For high-inertia sand particles with Stokes number $St^+ \sim O(10^2\unicode{x2013}10^3)$ and a volume fraction $\varPhi _v \sim O(10^{-4})$, particle image tracking velocimetry was used to determine the particle position and near-wall distribution properties. We established three particle release modes, including top-released, bottom overall-released and bottom partially released sand particles, under the same flow field conditions and calculated the differences in particle near-wall clustering and void properties. It was confirmed that wall effects (including collision and strike-splash) have a great influence on particle clustering and void behaviour near the wall. In the top-released sand particle and locally laid sand particle cases, particles bounced off the smooth walls and re-entered the carrier flow, causing significant clustering and sparsing of particles near the walls. In contrast, in the overall sand-laying case where the bottom wall was completely covered with sand particles, there is no apparent cluster or void phenomenon near the wall $(z/\delta <0.12)$ and the particles are randomly distributed, due to the combined effect of particle impact and splashing. In addition, the clustering and voids of particles become more pronounced with increasing wall-normal distance in the three release modes, and the particle distribution shows some self-similarity at each flow layer. The probability density function of the concentration of cluster particles decreases following a ‘$-5/3$’ power law. However, due to the particle–wall interaction, the probability density function gradually deviates from the ‘$-5/3$’ power law.

Type
JFM Papers
Copyright
© The Author(s), 2024. Published by Cambridge University Press

1. Introduction

Turbulent flows filled with inertial particles (i.e. particles with non-zero response times) are ubiquitous in both natural and engineering environments (Brandt & Coletti Reference Brandt and Coletti2022). Examples of particulate matter include dusty weather, falling rain and snow, river sediment, the combustion of coal dust and the diffusion of polluting particles. The response of particles to different scales of turbulent motion varies due to their different inertia. The particles in the flow field will appear unevenly distributed throughout the volume because of their interaction with the fluid structure and the effects of particle inertia. This phenomenon is referred to as preferential concentration or ‘clustering’ (Maxey Reference Maxey1987; Balachandar & Eaton Reference Balachandar and Eaton2010). Such phenomena are frequently observable in natural surroundings. For instance, snowflakes gliding above ice and sand grains suspended near the surface of a desert can generate clusters of particles resembling ribbons that are propelled by wind forces (Baas & Sherman Reference Baas and Sherman2005; Wang et al. Reference Wang, Feng, Zheng and Sung2019).

The preferential concentration of particles resulting from the interaction between particles and flow in a turbulent field is a complex phenomenon. Understanding the physical mechanism behind this interaction is a crucial topic in the study of two-phase flow. Maxey (Reference Maxey1987) postulated that the velocity field of particles is continuous, grounded in the compressibility of the ‘mesoscale particle system’. He proposed that in homogeneous isotropic turbulent flow, particles tend to cluster in regions of high strain and low vorticity. Meanwhile, Squires & Eaton (Reference Squires and Eaton1990) conducted direct numerical simulations to explore and exhibit this mechanism, also recognized as the strain–vorticity selection mechanism (Maxey Reference Maxey1987Reference Maxey1993; Squires & Eaton Reference Squires and Eaton1990; Eaton & Fessler Reference Eaton and Fessler1994). The mechanism suggests that in a state of uniform isotropic turbulence, particles smaller than the Kolmogorov scale effectively follow the motion of the fluid, while heavy particles do not move along the fluid trajectory but separate from the vortex core, cross the path of the fluid flow and accumulate in the region of high strain and low vorticity. Direct numerical simulations have indicated that the concentration of monodisperse inertial particles is high in regions of low vorticity and high strain, resulting in inhomogeneous concentration fields in flows with particles (Wang & Maxey Reference Wang and Maxey1993; Fessler, Kulick & Eaton Reference Fessler, Kulick and Eaton1994). This tendency is strongest when the Stokes number ($St$) is close to 1 (Aliseda et al. Reference Aliseda, Cartellier, Hainaux and Lasheras2002).

In wall turbulence, the presence of wall boundaries introduces a very large velocity gradient near the wall, which, in combination with the anisotropy of the near-wall velocity field, affects the dynamics of near-wall particles. A distinctive feature of the particle distribution in regard to the wall turbulence is the drift of the mean gradient of the particles with respect to the turbulent intensity, known as ‘turbophoretic drift’ (Reeks Reference Reeks1983). Based on the concept introduced by Reeks (Reference Reeks1983), Marchioli & Soldati (Reference Marchioli and Soldati2002) suggested that the effect of the flow-directed vortex structure in the boundary layer causes particles to preferentially concentrate near the wall. They examined several morphologies of the near-wall turbulent structure and found that the physical mechanism is described by the quasi-streamwise vortex structure, as well as the parent and offspring vortex regenerative circulation mechanism and the hairpin vortex packet structure are the same. Under diluted conditions, the vortex structure's action causes the particles to move towards the wall, while the inertial particles tend to align near the wall leading to the formation of stripes (Fong, Amili & Coletti Reference Fong, Amili and Coletti2019). In addition, Chen, Goto & Vassilicos (Reference Chen, Goto and Vassilicos2006) proposed a sweep–stick structure mechanism, which starts from the Maxey–Riley equation, where particles with zero acceleration ‘stick’ to the fluid when the particle velocity is the same as the surrounding fluid velocity, and the particles move at the same velocity as the carrier flow. It was later numerically verified by Coleman & Vassilicos (Reference Coleman and Vassilicos2009) that particle clustering for $St>1$ is mainly driven by the sweep–stick structure, and the particles are primarily clustered at the point of zero acceleration of the fluid. However, Bragg, Ireland & Collins (Reference Bragg, Ireland and Collins2015) pointed out a limitation of this model, that is, the sweep–stick is only valid when the particle $St_r \ll 1$ in the inertial range, where $St_r$ is the Stokes number based on the eddy turnover time scale at r. At the same time they give a new mechanism for explaining clustering in velocity fields through the parsed form of the radial distribution function, which can explain clustering in arbitrary spatially correlated velocity fields. This mechanism suggests that the clustering properties are driven by cross-scale turbulence and that the particle inertia only affects the ability to preferentially adhere to a fluid with zero acceleration. By comparing the two previous theories that produce similar results for the case of $St\ll 1$, Bragg & Collins (Reference Bragg and Collins2014) attempted to reconcile the physical interpretation of clustering by pointing out, through the analytic form of the radial distribution function, that the modelling of a particle's stopping point along the acceleration is approximately correct, and that this relative velocity is sufficient to allow the particle to cross the equilibrium between the stationary points on the time scale of the acceleration field. At the same time they proved that the sweep–stick is only valid in the inertial range $St \neq 1$. From this they gave the mechanism that can explain clustering in arbitrary spatially correlated velocity fields (Bragg et al. Reference Bragg, Ireland and Collins2015). In addition to this, Gustavsson & Mehlig (Reference Gustavsson and Mehlig2011a) explained the generation of clusters in terms of the multiplicative amplification of traversals and discussed the effect of Stokes number and Kubo number on clustering. They argued that small-scale clustering is determined by a random product of expansion and contraction factors, a process that depends on the history of velocity gradients experienced by particles in the past. They also suggested that preferential sampling determines the large-scale inhomogeneity of the particle number density at the turbulent vortex scale Gustavsson & Mehlig (Reference Gustavsson and Mehlig2011b).

The impact of gravity on turbulent diffusion plays a crucial role in the transportation and clustering of particles, thereby propelling substantial fundamental research on the associated mechanisms (Brandt & Coletti Reference Brandt and Coletti2022). In the case of vertical channels, the settling rate of particles is related to the direction of gravity, and for horizontal channels, gravitational settling effects increase the deposition rate of particles. Gustavsson & Mehlig (Reference Gustavsson and Mehlig2011b) found that the effect of sedimentation on small-scale clustering is weaker when turbulence is stronger. The sedimentation effect may reduce the number of preferential sampling particles with small Stokes number, while for particles with large Stokes number, rapid settling can significantly increase clustering. According to measurements by Muthanna, Nieuwstadt & Hunt (Reference Muthanna, Nieuwstadt and Hunt2005) and theoretical studies conducted by Zeng (Reference Zeng2007), the aerodynamic drag and lift forces acting on particles moving near the wall are related to the wall-normal distance. Considering the influences of gravity and fluid action, particle rebound is more frequent for particles with response times greater than the characteristic time scale of the fluid. Dejoan & Monchaux (Reference Dejoan and Monchaux2013) found that under the effect of gravity, particles tend to cluster in the vertical direction. Large inertial particles are more likely to collide when they are departing from the streamline of the fluid motion for local clustering. Additionally, the relative velocity of particles has a greater impact on collision probability when they are close to each other despite being in different regions (Saw et al. Reference Saw, Bewley, Bodenschatz, Sankar Ray and Bec2014). Consequently, collisional interactions can significantly alter properties like transport, deposition and selective aggregation of particles. Li et al. (Reference Li, McLaughlin, Kontomaris and Portela2001) and Sommerfeld (Reference Sommerfeld2003) demonstrated that interparticle collisional interactions cause a notable reduction of particles’ preferential concentration close to the walls. Konan, Kannengieser & Simonin (Reference Konan, Kannengieser and Simonin2009) found that multiple collisions between particles are crucial to overall particle movement near walls, resulting in both a loss of particle momentum and a change in velocity direction.

The above-mentioned studies of particle clusters that are under the influence of gravity mainly focused on relatively small inertial particles, and there are relatively few studies on the behaviour of particle clustering in two-phase wall turbulent flows that are carrying large numbers of very large inertial particles influenced by gravity. Zhu et al. (Reference Zhu, Pan, Wang, Liang, Ji and Wang2021) employed particle image velocimetry (PIV) to investigate the clustering features of large inertial particles in a turbulent boundary layer at a moderate frictional Reynolds number. The findings revealed that the particle clusters in the logarithmic layer display similarities under net settling conditions. However, the conclusions were limited to the specific conditions studied in that experiment. Various sand particle release processes can lead to differences in particle–wall interactions, subsequently causing notable variations in the near-wall motion of sand particles, including particle velocity and volume fraction distribution (Zheng, Wang & Zhu Reference Zheng, Wang and Zhu2021; Liu, Feng & Zheng Reference Liu, Feng and Zheng2022). Further investigations are required to explore the disparities in the local clustering of particles in the flow resulting from different sand release modes. This necessitates a comprehensive depiction of the motion and spatial distribution of particles close to the wall, thereby enhancing the comprehension of particle cluster characteristics in proximity to the wall. In other words, the influence of particle–wall interactions on the cluster behaviour of particles in wall shear flows remains unclear, and in particular, the particle cluster behaviour of particles released in the form of erodible bed surfaces near the wall surface is still lacking. This requires in-depth analyses of particle cluster and void characteristics and their differences in wall turbulence under various sand particle release modes.

In the work reported in this paper, we conducted an experimental study of the distribution characteristics of large inertial particles near the wall at a moderate friction Reynolds number, with a low particle volume fraction. This study utilized a two-dimensional (2-D) PIV technique to quantify the two-phase velocity field of a vertical plane aligned with the flow direction of particle-laden boundary layers. Three distinct particle-delivery methods were used to determine the characteristics of the near-wall motion of the particles across various experimental conditions. The outcomes produced a comprehensive understanding of the near-wall motion characteristics of the particles under an array of experimental conditions. Section 2 outlines the experimental set-up, detailing the three sand particle release modes and relevant apparatus parameters. Section 3 details the experimental findings on the distribution of sand particles on the near-wall surface, under diverse experimental conditions. Meanwhile, § 4 provides extensive explanations of the identified mechanisms and the results obtained.

2. Experimental set-up and method

2.1. Laboratory set-up with two-phase flow measurements

This experiment was performed in a multifunctional environmental wind tunnel located at Lanzhou University, Lanzhou, Gansu, China. The wind tunnel information was presented in detail by Zheng et al. (Reference Zheng, Wang and Zhu2021) and Liu et al. (Reference Liu, Feng and Zheng2022). Here, we only provide a brief overview of the set-up, with the relevant details that are specific to this experiment. The experiment was conducted in a DC-type, low-velocity wind tunnel, with a wind tunnel test section of dimensions $1.5\ {\rm m} \times 1.3\ {\rm m} \times 20\ {\rm m}$ (${\rm height} \times {\rm width} \times {\rm length}$), as shown in figure 1. The bottom and sides consisted of smooth glass panels for ease of both optical observation and measurement. The wind tunnel can provide free flow axis velocity with a range of $3$$40\ {\rm m~s}^{-1}$.

Figure 1. Experimental set-up. (a) Case 1: uniform sand throwing located at the top of the wind tunnel; (b) case 2: local sand laying; (c) case 3: overall sand-laying experimental set-up.

The free flow axis velocity in this experiment is fixed at $U_\infty =9\ {\rm m~s}^{-1}$, the corresponding turbulence intensity is approximately $1\,\%$, the fluid density is $1.2\ {\rm kg}\ {\rm m}^{-3}$ and the kinematic viscosity of the fluid is $1.68\times 10^{-5}\ {\rm m}^2\ {\rm s}^{-1}$. The boundary layer thickness and friction velocity are obtained by fitting the mean wind speed profile (Chauhan, Monkewitz & Nagib Reference Chauhan, Monkewitz and Nagib2009), where the friction velocity is $u_\tau =0.35\ {\rm m~s}^{-1}$, the boundary layer thickness is $\delta =0.187$ m, the friction Reynolds number is $Re_\tau =3530$ and the shape parameter $H=1.27$. It is worth noting that maintaining a constant friction Reynolds number for particle-laden flows in various experimental scenarios in this study was quite challenging. This problem primarily stemmed from the fact that the particles altered the mean value of the velocity and Reynolds stress. As a result, the magnitude of the Reynolds number was also likely to have been affected. Therefore, in the present experiments, we set the inlet velocity of the free incoming flow to a certain value, i.e. all the free-stream velocities in different cases are set as 9.0 m s$^{-1}$, so that the background flow field in the two-phase flows has the same flow characteristics. Therefore, in our experiments, we set the velocity of the free incoming flow to a certain value, which causes the background flow field in the two-phase flow to have the same flow characteristics. Given the purpose of this paper, this unified background flow field environment is relatively reasonable in design, and this method of analysis has been used in previous studies conducted by Zheng et al. (Reference Zheng, Wang and Zhu2021).

The PIV measurement position is located $7.5$$9$ m downstream of the experimental section (marked in figure 1). The coordinate origin is set at the lower left corner of the acquisition field of view, i.e. the lower side of the entrance of the PIV measurement field of view. The average and instantaneous velocities along three directions are expressed as $U, V, W$ and $u, v, w$, respectively. The internal scale is normalized by the frictional velocity $u_\tau$ and kinematic viscosity $\nu$. Subscripts $f$ and $p$ denote the variables of the continuous fluid phase and the discrete particle phase, respectively. The density of the sand grains used in this experiment is $2600\ {\rm kg}\ {\rm m}^{-3}$, and the density ratio of the sand grains to the fluid is $\rho _p/\rho _f=2148$. The particles used in this experiment are measured by a laser diffraction particle size analyser (Microtrac s3500) and their size distribution is shown in figure 2. It is seen that the particle size $d_p$ is in the range 30–550 $\mathrm {\mu }$m and the average particle size is 204 $\mathrm {\mu }$m. In the three experiments that use the same kind of sand particles, the average volume fraction of the particles under the three experimental conditions can be measured and calculated as $1.4\times 10^{-4}$, $2.0\times 10^{-4}$ and $1.6\times 10^{-4}$, and the maximum Reynolds number of the particles is $Re_p=d_p|u_f-u_p|/\nu =11.9$ (where $u_f$ and $u_p$ denote the velocity of the fluid and the velocity of the particles, respectively). This indicates that the fluid around the particles is in a non-Stokes regime, so the inertia effect cannot be ignored when calculating the particle response time. The particle Stokes number based on wall units is $St^+=\tau _p/\tau _f\sim O(10^2\unicode{x2013}10^3)$, where $\tau _f$ is the turbulent viscous time scale $\tau _f=\nu /u_\tau ^2$, and $\tau _p=\rho _pd_p^2/(18\nu \rho _f(1+0.15Re_p^{0.689}))$ is the relaxation time of the particle. The corresponding particle Stokes number based on the Kolmogorov time scale is $St_\eta =\tau _p/\tau _\eta =(1.39\unicode{x2013}470)$, where $\tau _\eta =\sqrt {\nu /\varepsilon }$ is the Kolmogorov time scale. According to Baker et al. (Reference Baker, Frankel, Mani and Coletti2017), the particle settling coefficient $S\nu =V_{t}/u_{\tau }\sim O(10^{-1}\unicode{x2013}10)$, where $V_{t}$ is the settling velocity of the particles in a stationary fluid, $V_t=(d/2)^2(\rho _p-\rho _f)(2/9\nu )g$, $d_p$ is the particle diameter, $\nu$ is the dynamic viscosity of the fluid, $\rho _{p}$ and $\rho _{f}$ are the density of the particles and the fluid, respectively, and $g$ is the acceleration of gravity.

Figure 2. Particle size distribution and cumulative distribution of mixed sand particles used in the experiment.

For the particle experiments, the camera and other experimental apparatus are arranged in a fashion similar to that of the net wind experiments, as shown in figure 1. Three different experimental conditions were set up. Case 1 is a top-release particle experiment (figure 1a), i.e. where sand particles are released from the top of the entrance of the wind tunnel at a uniform speed by the sand throwing equipment, which is located $8$ m away from the centre of the measurement field of view. These dropped sand particles settle downwards under the action of gravity and are simultaneously carried horizontally by the incoming flow and move along the direction of flow. Case 2 is a local sand-laying experiment (figure 1b), i.e. a sand layer is laid at the bottom wall of the entrance of the wind tunnel. As depicted in figure 1(b), a sand layer with a thickness of $0.05$ m, a length of $1.0$ m and a width of $1.3$ m (as denoted as the yellow area in figure 1b) is placed at the bottom wall of the entrance of the wind tunnel experiment.

Under this condition, sand particles are sheared and entrained from the wall, constantly bouncing and colliding with the smooth wall and moving downstream. Case 3 is an overall sand-laying experiment where the entire bed is covered with sand particles (as in figure 1c) via the placement of a sand bed with dimensions of $10\ {\rm m}\times 1.3\ {\rm m} \times 0.05\ {\rm m}$ (${\rm length} \times {\rm width} \times {\rm thickness}$) that is placed on the bottom wall. Compared with those in case 2, the particles in case 3 are continuously influenced by being transported by the incoming flow and by the forces exerted due to the bouncing collisions and the splashing particles during their horizontal and vertical travel, forming an erodible wind and sand flow on the wall. In the 2-D PIV/particle tracking velocimetry measurements, dioctyl sebacate droplets with diameters of $0.3$$3\ \mathrm {\mu }$m were used as liquid-phase tracer particles. Simultaneous measurements were used to obtain the gas-phase velocity and particle velocity (as shown in figure 1). The laser beam was vertically emitted from the top of the wind tunnel and reflected upstream through a mirror placed downstream. A double-pulse laser (Beamtech Vlite-500) with an energy output of $500$ mJ pulse$^{-1}$ and a laser beam of $532$ nm wavelength (thickness of approximately $1.0$ m) was used as the light source. Four cameras (FlowSense EO 16MP) connected by synchronizers and with a resolution of $4920\times 3280$ pixels were arranged in the direction of flow to record the 2-D flow field information, with a sampling frequency of $4$ Hz, and a magnification of $80 \ \mathrm {\mu }{\rm m}\ {\rm pixel}^{-1}$, which can provide field-of-view information (as shown in figure 1). The multicamera configuration provides a large field of view, $1.50\ {\rm m} \times 0.27\ {\rm m}$ in size, which is capable of recording information for resolving the small-scale fluctuations and large-scale motions and ensuring the convergence of the high-energy large-scale structures.

The PIV technique requires a complex signal processing scheme to distinguish the tracers from the inertial particles. In previous studies (Monchaux, Bourgoin & Cartellier Reference Monchaux, Bourgoin and Cartellier2012; Sumbekova et al. Reference Sumbekova, Cartellier, Aliseda and Bourgoin2017; Wang & Lam Reference Wang and Lam2020), the use of 2-D imaging was shown to be capable of capturing the inertial particle distribution and velocity, as well as the flow field information. The PIV was continuously sampled in the experiment, and the entire sampling process was divided into eight time steps, sampling 400 pairs of images each time. Adaptive PIV in DynamicStudio software was used for the image processing, and a $32\ {\rm pixel} \times 32\ {\rm pixel}$ area section size was selected as the query region, with $75\,\%$ of correlation in both the flow direction and wall-normal direction. The particle velocity is then accurately calculated using particle tracking velocimetry (Sciacchitano, Wieneke & Scarano Reference Sciacchitano, Wieneke and Scarano2013), based on the results of the adaptive PIV. This method not only enables highly accurate velocity measurements and reduces the error of particle identification, but also reduces the relative error of particle matching (Zheng et al. Reference Zheng, Wang and Zhu2021; Liu et al. Reference Liu, Feng and Zheng2022).

Figure 3 shows the statistics of the fluid and particle phases. In figure 3(a), there is an obvious logarithmic region in the mean velocity profile of the particle-free flow, which is consistent with the theoretical results of the mean velocity contour of the smooth boundary layer. The distribution of the turbulent kinetic energy is also basically consistent with the existing empirical formula under the same Reynolds number condition (Marusic & Kunkel Reference Marusic and Kunkel2003). It suggests that the particle-free flow is a canonical turbulent boundary layer and that the PIV measurements have a relatively high accuracy. And according to previous work based on the same experiment (Liu et al. Reference Liu, Feng and Zheng2022), it can been found that the pre-multiplied spectra in particle-laden flows are significantly changed due to the effect of particles on the turbulent flows. On the one hand, the particle–wall interactions enhance the turbulent kinetic energy of small-scale motions near the wall. On the other hand, the particles can impact the very large-scale motions in the outer region, that is, the turbulent kinetic energy of very large-scale motions is weakened in case 1 while enhanced in case 2 and case 3. Figure 3(b) shows the mean velocity profiles of the fluid phase in different cases. It can be found that the mean velocities in case 1, case 2 and case 3 are significantly influenced by the particles within the boundary layer compared with the result in the particle-free flow. In case 1, the mean velocity is increased by the dispersed particles at $z^+>1000$, while being decreased at $z^+<1000$. In case 2 and case 3, the particles with particle–wall interaction cause the mean velocity to decrease obviously within the boundary layer. However, the free-stream velocities beyond the boundary layer in different cases are basically the same as that of the particle-free flow. In figure 3(c), the mean particle streamwise velocities are given for the particle-laden cases. It can be found that the particle velocity of the top-released particles (case 1) is larger than those in case 2 and case 3. This is because the particle–wall interaction, including collision, rebound and splash of particles, in the vicinity of the wall causes loss of momentum of the particles, which decreases the velocity of the particles to some extent.

Figure 3. Statistics of the fluid and particle phases. (a) Mean velocity profile and turbulent kinetic energy distribution in the particle-free flow. (b) Mean velocity profiles of the fluid phase in different cases. (c) Mean velocity profiles of particles in different cases.

2.2. Particle analysis method

2.2.1. Voronoi tessellation

Since the work of Fessler et al. (Reference Fessler, Kulick and Eaton1994), clustering has been explored using 2-D imaging, and multiple methods have been used to describe the concentration field of particles and particle clusters. There are various ways in which particle clusters can be analysed. Box-counting techniques, radial distribution function methods and Voronoi analysis are available for the rigorous detection and measurement of particle clusters (Marchioli Reference Marchioli2017). The use of Voronoi division as a method has been proven by many scholars to be a highly accurate method for conducting studies of wall-flow particles (Monchaux et al. Reference Monchaux, Bourgoin and Cartellier2012; Sumbekova et al. Reference Sumbekova, Cartellier, Aliseda and Bourgoin2017). This paper adopts Voronoi tessellation, which was first introduced by Monchaux, Bourgoin & Cartellier (Reference Monchaux, Bourgoin and Cartellier2010) as a research technique to identify the tendency of particles to aggregate in two-phase flows. After the application and testing of this method by many scholars, the phenomenon of discriminative clustering has been widely accepted in the study of the distribution of particles that exist in two-phase flow environments and other related properties (Monchaux et al. Reference Monchaux, Bourgoin and Cartellier2010; Tagawa et al. Reference Tagawa, Mercado, Prakash, Calzavarini, Sun and Lohse2012; Dejoan & Monchaux Reference Dejoan and Monchaux2013; Baker et al. Reference Baker, Frankel, Mani and Coletti2017; Marchioli Reference Marchioli2017).

The Voronoi division method consists of the division of the particles within the measurement area (in this paper, a 2-D image) into associated cells, each of which contains a set of points closest to the particles. The reciprocal of the cell area $A$ is equal to the local concentration of the particles that make up the cell, i.e. $C=1/A$. This means that the distribution of the particle concentration can be obtained by analysing the distribution of the area of the particles that make up the Voronoi cell, if the information on the location of the particles in space is available. The largest difference between Voronoi division and the box-counting method is that Voronoi division does not require a priori selection of the length scale (e.g. box size), and the local concentration field obtained by this method is also obtained at the intrinsic resolution (Zhu et al. Reference Zhu, Pan, Wang, Liang, Ji and Wang2021). Because of this, Voronoi division appears to be both more objective and faster in analysing the aggregating tendency of particles in the flow (Marchioli Reference Marchioli2017). The probability density distribution function (PDF) of the area of the cell composed of particles with a random Poisson distribution (RPP) is applied for distinguishing between clusters and voids. With the inherent stability of the Voronoi diagram statistics and the large field of view utilized in this paper (converted to the boundary layer degree that characterizes the size of the field of view), we are able to combine a large number of particles in each image and use MATLAB's algorithm to then generate the Voronoi diagram. As shown in figure 4, after the division process is completed, the problem of edge indeterminacy then arises; i.e. the edge particles grouped by the Voronoi cells formed by the edge particles will appear to have no boundary. If the cells formed by these particles at the edges are counted directly without dividing the regular boundaries, then it will lead to statistical distortion. To avoid the spurious edge effects, in this paper, following the method of Sumbekova et al. (Reference Sumbekova, Cartellier, Aliseda and Bourgoin2017), the cells composed of particles outside the boundary region are not counted to avoid statistical errors.

Figure 4. (a) A particle image after processing and (b) the Voronoi division associated with this image. For the sake of clarity, we only show the local map division of the field of view.

2.2.2. Identification of clusters and void areas

The preferential concentration of particles can be determined by comparing the spatial distribution of particles with the RPP (Monchaux et al. Reference Monchaux, Bourgoin and Cartellier2010). The particles obtained experimentally were divided with a Voronoi diagram, and the probability density distribution of the area of the divided cells was calculated and compared with the RPP. The first intersection was defined as the area threshold (equivalent to the concentration threshold), below which the particles were considered cluster particles; the second intersection was defined as another area threshold, above which the particles were considered void particles (Monchaux et al. Reference Monchaux, Bourgoin and Cartellier2010). If the distribution of particles in space follows an RPP, Ferenc & Néda (Reference Ferenc and Néda2007) gave a general formula for the PDF of the Voronoi cell distribution inscribing the Poisson distribution. The PDF of the Voronoi cell area for the RPP distribution in the 2-D case is $PDF_{2D}(\gamma )=(343/15)\sqrt {7/2{\rm \pi} }\gamma ^{5/2}\, {\rm e}^{-7\gamma /2}$, where $\gamma$ is the normalized area using the mean area, i.e. $\gamma =A/\bar {A}$. Here $A$ is the area of the cell formed by the particles divided by Voronoi and $\bar {A}$ is the mean area of the cell formed by these particles. In wall turbulence, the particles are unevenly distributed along the wall normal, and it was determined from previous research that to normalize the area obtained from the division, the average value of different flow layers should be used to determine the cluster and evacuation thresholds from the PDF. In this study, the Voronoi cell areas are normalized using the local mean cell area, which refers to the method of Voronoi cell statistics of particles in wall shear flow adopted by Zhu et al. (Reference Zhu, Pan, Wang, Liang, Ji and Wang2021).

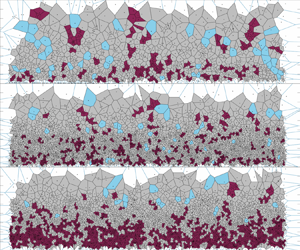
Figure 5(a) shows the Voronoi partitioning of a 2-D spatial particle with a small field of view, with the particle clustering regions shown in red in the figure. Figure 5(b) shows the PDF represented by the ground cell region after normalization according to the area mean. Here, we choose three experimental scenarios for the PDF of the normalized area of polygons at the same height. In comparison with that for the RPP, we obtain the threshold. In figure 5(c), we have applied a logarithmic treatment of the data at the same height, as shown in figure 5(b), and through the above steps, we found that the log-normal distribution can approximate the inscription of these distributions, with differences in the degree of approximation. Following the definition of the cluster threshold given earlier, we found the threshold of clustered particles (as shown in figure 5b).

Figure 5. (a) Localized Voronoi division applied to case 1. (b) Plots of PDFs of the particle Voronoi division area at $z/\delta =0.321$ in three cases, compared with the RPP which is plotted as the black dotted line. (c) Centred and normalized PDFs of the logarithm of Voronoi area for three cases at $z/\delta =0.321$, the dotted line being a Gaussian distribution.

In the PDF, it is specified that when the probability density turns from a fraction greater than the Poisson distribution to a point lower than the Poisson distribution, it is considered to be a threshold for particle clustering, $\gamma _{A}$, and the opposite is defined as the void threshold, $\gamma _{V}$ (Monchaux et al. Reference Monchaux, Bourgoin and Cartellier2010; Baker et al. Reference Baker, Frankel, Mani and Coletti2017). After obtaining the resulting thresholds, those satisfying the condition $A_{cell}/\overline {A_{cell}}\le \gamma _{A}$ are clusters, and those satisfying the condition $A_{cell}/\overline {A_{cell}}\ge \gamma _{V}$ are voids. The cluster particles need to be further judged to determine whether these particles are interconnected clusters or not. Here, we refer to the work of Zamansky et al. (Reference Zamansky, Coletti, Massot and Mani2016), who stated that when the area of all neighbouring cells is $\overline{A_{cell}} \gamma _{c}$, the corresponding particles are judged to be clusters, which can be defined only if they are interconnected. In this case, objects consisting of only one or two individual Voronoi cells can be filtered and removed, keeping only the particles with cell areas less than a threshold and with the same condition of connectivity around them. In this paper, it is specified that when the number of interconnected cells is greater than or equal to three, the particles are judged to be clusters. This allows us to determine the regions with clusters and voids in the particle flow using Voronoi division (e.g. in figure 5a, the red region is the clusters, the blue region is the voids and the grey region is the region in between).

3. Experimental results

3.1. Results of the sand-dropping experiment

In this paper, seven different heights are selected to find the thresholds of particle concentration and evacuation, i.e. $z/\delta =0.027$$0.481$. The statistical field of view range of the particle field is $0< x/\delta <5$, vertically $0< z/\delta <0.5$, the spacing between the flow layers is $\Delta z/\delta =0.01$ and the remaining two experiments take the same statistical approach as the sand-throwing experiment. Figure 6(a) shows the profiles in the sand-casting experiment. It is observed clearly from the figure that the normalized area probability density statistical profile distribution approximately follows the same trend at different heights, and the left-hand tail lifts slightly as the vertical $z$ value increases, which is consistent with the phenomenon observed recently by Zhu et al. (Reference Zhu, Pan, Wang, Liang, Ji and Wang2021) at particle loading. The Voronoi cell area statistics of inertial particles can be well described using the log-normal distribution (Monchaux et al. Reference Monchaux, Bourgoin and Cartellier2010; Sumbekova et al. Reference Sumbekova, Cartellier, Aliseda and Bourgoin2017). From this, we take the $\gamma$ logarithmic operation, translate it through its mean $\langle \log (\gamma ) \rangle$ and finally normalize it by scaling it by the standard deviation $\sigma _{\log (\gamma )}$ of the logarithm, to obtain a relatively smooth distribution curve, which we set as $\chi =(\log (\gamma )-\langle \log (\gamma ) \rangle )/\sigma _{\log (\gamma )}$, as shown in figure 6(b). Comparing these values with the Gaussian distribution, the distribution of $\gamma$–PDF profiles on each altostratigraphic layer is close to the log-normal distribution. This is close to the results of some previous studies (Monchaux et al. Reference Monchaux, Bourgoin and Cartellier2010; Baker et al. Reference Baker, Frankel, Mani and Coletti2017; Sumbekova et al. Reference Sumbekova, Cartellier, Aliseda and Bourgoin2017). However, it is found that the distribution of particles in the near-wall region adheres to the Gaussian distribution, whereas there are deviations in the tails of the PDF curve at $z/\delta \geq 0.14$. This phenomenon was also observed by (Momenifar & Bragg Reference Momenifar and Bragg2020), in which they attributed the deviation to the variation in $St$ of the particles. The PDF does not follow the Gaussian distribution at small $St$, but satisfies the Gaussian distribution at large $St$. To some extent, this provides statistical corroboration for the similarity that appears in the distribution of particles over different spaces. On the contrary, there is also some variability in the distribution of particles at various heights. It is noted that many studies of aeolian saltation transport in wall-bounded turbulence have revealed that the concentration of particles near the wall is very high and the particle concentration decreases rapidly with an increase of the height (Rasmussen & Sørensen Reference Rasmussen and Sørensen2008; Ellis et al. Reference Ellis, Li, Farrell and Sherman2009). The gravitational effect results in an overall accumulation of particles in the near-wall region. However, the overall accumulation phenomenon is different from the issue of concern in the present study. The present study aims to comparatively investigate the impact of particle–wall interactions on particle clusters and voids by conducting tests with different release modes. To avoid the influence of the overall accumulation, the whole field of view is divided into narrow horizontal layers, and the statistical analysis of the cluster and void behaviour of particles is manipulated within every individual layer. On this basis, the feature of particle clusters and voids within a limited height range at different height is investigated.

Figure 6. Sand-dropping experiment. (a) The PDF of the normalized area. The black dashed line is the RPP, the intersection points of the profiles of the experimental data are defined as the clustering threshold and the void threshold, respectively, and the shaded part represents the distribution range of both thresholds. (b) The PDF profile of the data after logarithmic transformation, the dashed line representing the standard Gaussian distribution.

The mean average area of the Voronoi cells for the different heights is calculated. Fifteen narrow boxes along the height with width $\Delta z=0.05 \delta$ are divided to obtain the mean value of the particle cell area $\bar {A}_{i}$ at different heights, and the mean area of particle cell in the whole field of view $\bar {A}$ is used to give the dimensionless parameter $\eta =\bar {A}_{i}/\bar {A}$. The variations of the mean dimensionless area with height are shown in figure 7(a). It can be seen that the mean area of Voronoi cells increases with height $z/\delta$ in all the particle-laden cases. In case 1, the increment of mean dimensionless area at ${z/\delta >0.3}$ is more rapid than those in case 2 and case 3. According to Monchaux et al. (Reference Monchaux, Bourgoin and Cartellier2010), the inverse of area of the cells obtained from the Voronoi division ($1/A$) can reflect the particle concentration. Figure 7(b) shows the particle concentration distribution calculated through the inverse of Voronoi cell area, where ${c}$ is the average particle concentration at different heights and $C_{0}$ is the average concentration of particles in the whole statistical field of view. The results show that the particle concentrations decrease with height and the decrease is very rapid at ${z/\delta >0.3}$ in case 2 and case 3 due to the saltation height limitation of the large inertial particles releasing from the bottom surface. It is noted that the particle concentrations above ${z/\delta =0.8}$ in case 2 and case 3 cannot be accurately calculated by this manipulation due to the number of particles being very low in these regions in case 2 and case 3.

Figure 7. (a) Particle size distribution and (b) cumulative distribution of mixed sand particles used in the experiment.

3.2. Results of the sand-bedding experiment

For sand-bedding experiments, we primarily adopt two types of experimental forms, namely partial sand bedding (case 2) and whole sand bedding (case 3). The former can provide the particle release mode in which the sand is initiated from the surface while the particles move with the fluid flow on the smooth and hard surface, while the latter reproduces the particle release mode in which the surface particles move with the fluid on the sand surface (i.e. erodible bed surface). This mode of initiating particles from the surface into the flow is fundamentally different from the mode of dropping sand particles from the top. The premise of surface sand entering the flow is that the particles can be carried into the air by the wind shear on the surface, which implies that the observed particles are ‘actively screened’ by the fluid, i.e. some of the surface particles in these cases are entrained by air erosion process into the flow field. This is in contrast to case 1 in which all of the particles are moving in the flow field. In the sand-dropping experiment (case 1), there is no such ‘screening’, or this screening effect is weakened. By dropping the particles from the top, it does not matter if they satisfy the condition of being carried up by the wall, and the thrown particles will more or less follow the fluid for some distance. The main difference between partial and integral sand laying is whether the bed is erodible, followed by the compensation mode of particles. In the case of integral bed paving, if the turbulent flow passes through particles that meet the condition of being entrained to rise up, under the combined effect of turbulence and near-wall particle collision and splash, these particles will be randomly added to the particle flow, or strongly rise or weakly creep up, all of which will become indeterminate factors affecting downstream particles with the same condition. In contrast, local sand laying does not have this effect, and the particles are supplemented from the upstream laying of the specified distance of the sand section, which will not affect the amount of downstream particle compensation, regardless of how complex is the movement of the particles. Considering the different behaviour of particles in the image acquisition area and the same mechanism of particles being carried by the fluid applying, these two sand-laying experiments show the same distribution pattern of particles at a certain height. For this reason, the area distribution of the cells after Voronoi division of particles at different heights is also accounted for in this paper. As shown in figure 8, some results of the above two sand-laying experiments are given as the area after particle division and the probability density distribution of the normalized area at seven different heights.

Figure 8. (a) The probability distribution of the cell area at different heights for case 2 (local sand laying). (b) The area distribution after normalization using the local mean area, finding the clustering area by matching the RPP thresholds for the areas and void areas. (c) The data in (b) are normalized by logarithm to attempt to fit for use of a Gaussian distribution description. (df) The results of case 3 (overall sand-laying experiment).

The experimental results for the local sand-laying experimental conditions are presented in figure 8(ac). Figure 8(a) shows the spatial distribution of particles on the stream layer at different heights, which is the probability density of the area of Voronoi cells. With increasing height, the probability distribution of the particle area becomes ‘wider’, and at the height near the wall, the bell-shaped curve is relatively complete, but the whole curve appears narrower and sharper. After reaching a certain height, this narrow and sharp trend gradually moderates, the PDF curve becomes wide and flat, the position of the intersection with the probability density curve of the RPP gradually converges and the value of the intersection (here, the transverse coordinate) tends to a constant value. This indicates that the particle clustering and voiding phenomena become increasingly obvious as the height increases. In figure 8(b), it can be clearly observed that the particle field in the area above the near-wall surface in the case of local area sand laying shows obvious clusters and void areas, which is the same as the results of the sand-dropping experiment discussed earlier. The truncation phenomenon appears on the left-hand side in figure 8(b), implying that the probability of small-area cells composed of particles appearing is low. In contrast, the large-area cells are concentrated at the right-hand end of the peak of the PDF distribution line. After normalizing the normalized area values by logarithm, the log-normal distribution is approximated as in figure 8(c), which also shows a ‘depression’ on the left and a ‘warping’ on the right.

Figure 8(df) shows the statistical results of the overall sand spreading experiment. Compared with the local sand spreading experiments with clear clusters and dispersion characteristics, the results show that the overall sand spreading experiments are ‘hierarchical’ in terms of cluster and dispersion zones. In figure 8(d), the PDF distribution of the cell area of particles located near the wall ($z/\delta =0.054$) shows a ‘tall and narrow’ bell line, which also appears ‘short and wide’ as the height increases. In this process, the distribution of small-area cells also appears truncated to some extent, which is similar to the experimental results of local sand laying. Interestingly, the particles do not show areas of obvious cluster and evacuation in the vicinity of the wall. To verify this result, we compare the PDF of the normalized area versus the RPP in figure 8(e), where we can clearly find that the PDF cross-section of the normalized area at the bottom two heights almost coincides with the probability density curve of the RPP after the peak. With increasing height, the particles suspended in the air appear as cluster and evacuation areas, and errors appear in the cluster and evacuation thresholds at different heights. We calculated the cluster and void thresholds for the three experimental conditions (those not present are not counted here).

As shown in figure 9, the threshold values obtained from the normalized area of the cells divided by particles compared with the RPP (shown as the grey area in figure 8) have a tendency to gradually decrease with height. The cluster threshold $\gamma _c$ gradually trends to a value of $0.6$, and the void threshold $\gamma _v$ gradually trends to a value of approximately $2.1$, which are similar to the results given by Baker et al. (Reference Baker, Frankel, Mani and Coletti2017) through their simulations. There may be two reasons for this phenomenon: first, the effect of spatial resolution, where small fields of view suffer from truncation when upsized and applied to larger scales, and the limited resolution when compared with the entire statistical computational field of view, which both leave a high probability that particles are not detected due to the strong light reflection of neighbouring particles, thus weakening the possibility of finding clustered particles; second, although Monchaux et al. (Reference Monchaux, Bourgoin and Cartellier2012) stated that the cluster threshold is strongly related to particle sampling, changing the number of particles in the region leads to variations within the particle clusters (Petersen, Baker & Coletti Reference Petersen, Baker and Coletti2019), which in turn affects the number of detected self-similar threshold coherent clusters. As the volume fraction increases, the bidirectional coupling effect also significantly increases, which may change the turbulence structure, and thus the cluster process.

Figure 9. (a) Cluster threshold statistics for the three experimental conditions. (b) Threshold for the void region. The dashed line in (a) approaches $\gamma _{C}=0.6$; the dashed line in (b) approaches $\gamma _{V}=2.1$.

According to the previously mentioned method proposed by Monchaux et al. (Reference Monchaux, Bourgoin and Cartellier2010) for determining the presence of preferential concentration of particles using the Voronoi division, the root mean square of the normalized area value of the measured particle composition cells is compared with the RPP, where $\sigma _\gamma ^{RPP}\approx 0.53$. When the root mean square is greater than the reference value of $\sigma _\gamma ^{RPP}$, it indicates that there is a significant preferential concentration, and low concentration in the particle field. In contrast, if the calculated root mean square is lower than the reference value, it means that the particles tend to be arranged in a more organized pattern (Monchaux et al. Reference Monchaux, Bourgoin and Cartellier2010). To further determine whether the particles at each height have obvious clusters and void phenomena in the experiment, we calculated the value of the normalized root mean square of the cell. The statistics for different experimental situations and different heights are shown in figure 10. It can be seen from figure 10 that the root mean square of the average area on each stream has good monotonicity with height, and the value of the root mean square increases with greater height. This means that the particles are more likely to exhibit cluster and void behaviour when located away from the wall. The values of the root mean square $\sigma _\gamma$ of the normalized cell area in the sand-casting experiment (case 1) ranged from $0.55$ to $0.77$, those in the local sand-spreading experiment (case 2) ranged from $0.53$ to 1$.12$ and those in the overall sand-spreading experiment (case 3) ranged from $0.058$ to $1.10$. The values of the root mean square of the normalized cell area of the particle division at the near-wall condition $(z/\delta =0.027,0.054)$ were $0.471$ and 0$.460$. Parameter $\sigma _\gamma \le \sigma _\gamma ^{RPP}=0.53$. Its value increases with the height from the wall, and a large part of it is in a steady state. Case 2, on the other hand, initially shows an upwards trend, which is then followed by a decaying trend, with its peak in the vicinity. Its overall point value is above $0.53$. Case 3 is most different from the first two in the behaviour of the folding point in the near-wall region. Based on this phenomenon, we find the near-wall height $0.12\delta$ where case 3 has preferential cluster and void regions, and this zero-boundary point is marked at point $h_P$ in figure 10. After the zero-boundary height, the degree of cluster of case 3 is the same as that of case 2, and the peaks do not differ much in both cases.

Figure 10. Dotted line plot of the root mean square value of cell area with height, after Voronoi division.

4. Discussion

4.1. Spatial distribution of particles in the cluster and void regions

Here, we discuss the differences in the distribution of particles in the cluster and void regions observed in the three experiments. The first emphasis is that the 2-D phase formation captures objects as cross-sections of three-dimensional particle clusters, which constrains the ability to recognize the complementary spatial topological structure of particles. However, for the discussion of particles in the vertical wall direction, this limitation does not affect the main conclusions of the analysis (Petersen et al. Reference Petersen, Baker and Coletti2019). Based on the experimental results obtained in § 3, the particles distributed in the cluster and void regions are stripped from the particles of these three different experiments in this paper. The spatial distribution of particles in the cluster and void regions in the visual field is given according to a certain height range.

The PDFs of aggregated and sparse particles for different experimental scenarios are given in figure 11. In figure 11, $A_C$ and $A_V$ are the cell area for clusters and voids, respectively. Different from the stratified statistics approach is the layer-by-layer coverage statistics used here, in which all particles satisfying the conditions at a certain height are analysed. From figure 11, it can be found that the PDFs of the aggregated particles show a clear peak in all three experiments, indicating the existence of a typical clustering dimension characteristic, which is consistent with the results of previous experiments (Obligado et al. Reference Obligado, Teitelbaum, Cartellier, Mininni and Bourgoin2014; Baker et al. Reference Baker, Frankel, Mani and Coletti2017; Fong et al. Reference Fong, Amili and Coletti2019; Petersen et al. Reference Petersen, Baker and Coletti2019). In addition, the distribution of particles in the cluster area at $z/\delta \le 0.107$ located near the wall, after the peak of the most likely value is reached, decreases rapidly with different slopes for different experimental conditions, without showing a similar decay law. The reason for this may be that the particle concentrations are similar within a certain field of view, and the metastable area of the composition does not noticeably differ. Figure 11(a,c,e) shows that the PDF of the agglomerated particle cell area decays with a power law of ‘$-5/3$’ as the vertical statistical height increases. Especially when the statistical boundary is expanded to $0.535$, this decaying trend is increasingly obvious on the right-hand side of the PDF curve peak ($A_C \sim PDF$) of the particle cell area in the cluster region. A similar decaying trend is observed in the PDF of the particles in the hollow region. Although the cell area of the particles in the hollow region are larger than that of the aggregates (approximately $10$ times) at the same height, the distribution pattern is similar to that of the aggregates (encompassing a large statistical area) and decays with a ‘$-5/3$’ power law after the most likely peak is reached. This pattern of particle decay in the clustering and cavity regions has been reported in several previous experimental and numerical studies (Goto & Vassilicos Reference Goto and Vassilicos2006; Sumbekova et al. Reference Sumbekova, Cartellier, Aliseda and Bourgoin2017; Petersen et al. Reference Petersen, Baker and Coletti2019).

Figure 11. The PDF of the area of the cells in the cluster region in (a) case 1, (c) case 2 and (e) case 3. The PDF of the area of the cells in the void region in (b) case 1, (d) case 2 and (f) case 3. The dotted line shows a $-5/3$ power law; $A_C$ and $A_V$ are the cell area for clusters and voids, respectively.

The experimental study by Monchaux et al. (Reference Monchaux, Bourgoin and Cartellier2010) used probability density statistics for the cell area composed of aggregated particles using the Voronoi partitioning method and concluded that the PDF of the cell area of particles in the aggregated region follows a ‘$-2$’ power law. This distribution feature for the aggregated particles has been proven to be robust through the application of many experiments and simulations (Monchaux et al. Reference Monchaux, Bourgoin and Cartellier2010; Obligado et al. Reference Obligado, Teitelbaum, Cartellier, Mininni and Bourgoin2014; Baker et al. Reference Baker, Frankel, Mani and Coletti2017). Therefore, some later studies have used the ‘$-2$’ power-law decay as a criterion to verify the clustered particle distribution statistics when using the Voronoi division statistics for clustered particle PDF (introduced in the literature). Although the ‘$-2$’ power-law decay has been found by some experiments and simulations, thus far, there is no model to explain the ‘$-2$’ power law. A simple model proposed by Goto & Vassilicos (Reference Goto and Vassilicos2006) predicts a ‘$-5/3$’ decay law for the PDF of the cavity region, and the experimental results of Sumbekova et al. (Reference Sumbekova, Cartellier, Aliseda and Bourgoin2017) validate this model, which is one of the few results that follow a ‘$-5/3$’ decay law. Why does the PDF decay of clustered particles have two different power laws of ‘$-2$’ and ‘$-5/3$’? By analysing the flow conditions, this paper suggests that the Reynolds number may be the influencing factor. Generally, under low-Reynolds-number conditions (Dejoan & Monchaux Reference Dejoan and Monchaux2013; Baker et al. Reference Baker, Frankel, Mani and Coletti2017; Fong et al. Reference Fong, Amili and Coletti2019), the PDF of clustered particles decays with a ‘$-2$’ power law, in contrast to the ‘$-5/3$’ power-law decay (Goto & Vassilicos Reference Goto and Vassilicos2006; Sumbekova et al. Reference Sumbekova, Cartellier, Aliseda and Bourgoin2017). It is also well understood to apply this power law to turbulent flows with relatively low Reynolds numbers, thus limiting the scale separation. This is the same conclusion as Sumbekova et al. (Reference Sumbekova, Cartellier, Aliseda and Bourgoin2017) reached, who found that there is a strong relationship between the clustered particle scale and the Reynolds number. The value of the most likely area (peak) is found to be shifted weakly in figure 11. This is because as the statistical area becomes larger, the correspondingly large area of the cell becomes the statistical sample and is weighted more heavily, thus making the most likely value slightly larger.

4.2. Near-wall particle clustering mechanism

This paper is concerned with preferential concentration/clustering of heavy particles in near-wall turbulence. Most of the work devoted to these studies has been performed with wind tunnel experiments and numerical simulations, few of which have considered the role of wall effects on nearby particles, as well as the role of near-wall effects on turbulence, which also influences the particle distribution state, in experiments where the mass and volume fraction loads are small enough to neglect the effect of particles on turbulence. Under the effect of bidirectional coupling, this section discusses the action of turbulence on particles that are influenced by the action of near-wall particles, which results in the particles having preferential concentration behaviour.

There is now considerable evidence to strongly correlate the regions of high strain and low vorticity, and the converse pertaining to regions with high concentration gathering heavy particles (Squires & Eaton Reference Squires and Eaton1990; Wang & Maxey Reference Wang and Maxey1993). The basic mechanism is as follows. Due to the inertia of the particles, large inertial particles tend to become ejected from the vortex structure, and the ejected particles are subsequently easily captured within the convergence region, while for small inertial particles, the behaviour is exactly the opposite. The typical attached vortex model and the turbulent energy cascade both represent, to an extent, a certain self-similarity of the near-wall turbulent structure at conditions with low Reynolds number.

The decay laws of cluster and void regions have been reported in some previous experimental and numerical simulation studies. Goto & Vassilicos (Reference Goto and Vassilicos2006) proposed a model which predicts an exponentially decreasing decay law for the PDF in the void region with an exponent of $-5/3$, which is validated by the experimental results of Sumbekova et al. (Reference Sumbekova, Cartellier, Aliseda and Bourgoin2017). In this model, analogous to the self-similarity of the vortices in the energy cascade to characterize the void region of the particles in the flow. It implies that the particles in the cluster and void regions not only are driven by the small-scale flow, but also respond to the self-similarity of the carrier phase. Based on the above understanding, Goto & Vassilicos (Reference Goto and Vassilicos2006) derived the probability density distribution of the cavity portion of the vortex in space by integrating the attached vortex model and the energy cascade theory under the assumption of the condition of gravity-free particles having good turbulence following $PDF(A_a) \sim A_a^{-2-(1/2)\log _\xi (1-R)}$, where $A_a$ is the area of the vortex cavity and $R$ is the proportion of the vortex in the entire statistical system, where $R=1-\xi ^{2/3}$. After conversion, we obtain $PDF(A_a) \sim A_a^{-5/3}$, that is, the probability density distribution of the area of the particle voids and clusters in the two-phase flow of particles obeys the ‘$-5/3$’ law of decay over a finite range of scales within the inertial range. This validates the later wind tunnel experiments and numerical simulation observations of the distribution of the better-following particles in two-phase flow. This is also the origin of the ‘$-5/3$’ power law mentioned in § 4.1.

Figure 12 shows the distribution of the area of particle cells in the cluster and void regions for three different procedures of releasing particles over the entire field of view. After normalizing the area using $\delta ^2$, there is a clear peak at the PDF presentation of the clusters, which indicates the presence of a typical feature clustering dimension. This is consistent with other previous experimental results (Aliseda et al. Reference Aliseda, Cartellier, Hainaux and Lasheras2002; Falkinhoff, Obligado & Bourgoin Reference Falkinhoff, Obligado and Bourgoin2014; Obligado et al. Reference Obligado, Teitelbaum, Cartellier, Mininni and Bourgoin2014; Sumbekova et al. Reference Sumbekova, Cartellier, Aliseda and Bourgoin2017). The three peaks (which correspond to the most likely values) are, from smallest to largest, $A_{case 3}< A_{case 2}< A_{case 1}$. If, as stated above, the main behaviour of the particles is due to turbulent entrainment, then the spatial distribution of the cell area of these particles in the cluster and void regions strictly follows the ‘$-5/3$’ power law. As shown in figure 12, the particle decrement pattern in this experiment does not strictly conform to the above theoretical model of turbulent vortex distribution. We believe the reason for this phenomenon is the wall effect of the particles. It is found that the spatial distribution of the Voronoi cell area of the particles in the cluster and void regions in case 1 follows a ‘$-5/3$’ power law, whereas case 2 and case 3 fit a ‘$-2$’ law more closely. The reason for this difference may be the complexity of the motion of the particles at the wall due to the interaction of the particles with the wall. In case 1, the particles undergo diffusion, settling and suspension motions in the flow field, which make particle distribution in the air relatively uniform. Inhomogeneity of the flow persists to a degree. Therefore, the particles in the cluster region in case 1 better exhibit a near ‘$-5/3$’ law similar to that of the uniformly released particles in isotropic turbulence (Falkinhoff et al. Reference Falkinhoff, Obligado and Bourgoin2014; Sumbekova et al. Reference Sumbekova, Cartellier, Aliseda and Bourgoin2017). In contrast to case 1, in both case 2 and case 3, the particle–wall interaction enhances the non-uniformity of the particle distribution in the statistical field of view, which causes the curve to diverge from the ‘$-5/3$’ power law but become closer to a ‘$-2$’ power law.

Figure 12. Probability density distribution of the normalized area of cells in three cases: (a) in the cluster regions and (b) in the void regions. Parameters $A_C$ and $A_V$ are the cell areas for clusters and voids, respectively.

Under low-Reynolds-number ($Re_\tau \sim O(10^3)$) conditions, it is generally believed that the vortex in wall turbulence is generated from the bottom wall, the particles are carried up by the shear flow and the airborne particles are affected by the vortex and are partially clustered and partially evacuated. The effect of the vortex causes its energy to be dissipated by carrying particles, and a larger vortex is forced to be reduced to a smaller vortex. The wall effect of the bottom-wall particles changes the volume fraction of the particles that are in the space (Zheng et al. Reference Zheng, Wang and Zhu2021). Different experimental environment settings may change the strength of the particle–wall interaction. The turbulent system generated by the wind tunnel is a steady power flow field, in which large vortices appear according to a certain ratio. This also allows us to find the probability density distribution of the agglomerated particle cell area in a large statistical area region in accordance with the ‘$-5/3$’ power law. We also show in figure 12 that the probability density distribution pattern of the particle cell area in the statistical cluster and void regions is similar for the entire computational field of view of the experimental observations, with deviations from the ‘$-5/3$’ power-law decay occurring in large areas (located relatively far from the wall), where a deviation ‘tail’ is produced. This deviation may be due to an attached eddy cut-off. Due to the interception distance, when the vortex scale is within the intercepted cluster area, the PDF curve of its area is straight, with a clear decreasing trend, and a monotonically decreasing function, and with the superposition of the accumulated height, an increasing number of scales of vortices will be included in the accumulated area, as shown in figure 12. When the cumulative field of view contains more large-scale eddies of typical scale, the decaying trend will gradually approach the theoretical decreasing power law. In figure 12(b), the spatial areas where the two types of experiments, namely the sand-dropping experiment and sand-laying experiment, deviate from the ‘$-5/3$’ theoretical region are indicated (given the qualitative agreement between the distribution of the accumulation and spreading regions, we then analyse the effect of particles in the spreading region). The particles deviate in the lower region from the wall in the sand-drop experiment, and in the slightly higher region in the sand-laying experiment, and this deviation region is approximately the same for both the sand-laying experiments. Particles dropped from the top of the wind tunnel make it difficult to generate larger-scale vortices, because the falling particles cut the energy of the vortex and prevent it from maintaining the form of a large-scale vortex (Zheng et al. Reference Zheng, Wang and Zhu2021), which, combined with the statistical vortex cut-off in an experimental fixed field of view, leads to the first deviation of the particle distribution in a relatively low region. For the sand-laying experiments, the near-wall effect of particles in the developing steady two-phase flow makes the vortex oscillate strongly when in the vicinity of the wall. At a certain height, without the influence of sufficient particles, the intermittent cascade process leads to a greater survival of large-scale vortices at a certain height away from the wall. Considering the vortex cut-off, the spatial distribution of cumulative statistical particles is the only case where the deviation from the theoretical value of ‘$-5/3$’ is weaker. In the flow field analysis (Liu et al. Reference Liu, Feng and Zheng2022) with the same set-up as in the present experiments, the turbulent kinetic energy and premultiplied energy spectra in the flow field performed for these three experiments, the energy distribution changes in the multiscale turbulent motion and at different wall-normal positions. In the two-phase flow filled with particles, the energy distribution changes laterally, validating the above arguments.

4.3. Fractal characteristics of near-wall clusters of particles with different wall effects

From the identification of the particle constituent cells in the cluster area, the perimeter $P$ and area $A_c$ of these particle constituent clusters are further obtained, both of which are scaled with the boundary layer thickness, and $P \sim \sqrt {A_c}$ will be linearly correlated with different power laws for the slope. The scatter plots of the relationship between case 1, case 2 and case 3 are given in figure 13. Two different behaviours can be seen from figure 13: the bottom portion is small and compact, while the other portion shows a larger fractal structure (Aliseda et al. Reference Aliseda, Cartellier, Hainaux and Lasheras2002; Monchaux et al. Reference Monchaux, Bourgoin and Cartellier2010; Baker et al. Reference Baker, Frankel, Mani and Coletti2017; Zhu et al. Reference Zhu, Pan, Wang, Liang, Ji and Wang2021). The existence of this fractal structure was reported from experiments conducted by Monchaux et al. (Reference Monchaux, Bourgoin and Cartellier2010). It was found that the above-mentioned features were consistently present in different studied aggregates in homogenous isotropic turbulent (HIT) and turbulent channel flows (TCFs).

Figure 13. The joint PDFs of perimeter versus area of the cluster cells in (a) case 1, (b) case 2 and (c) case 3. The vertical dotted lines represent the mean value of $A^{1/2}/\delta$; the dashed lines are least-squares fittings to the point density.

Figure 13 gives joint PDFs of the perimeter versus the square root of area of the cluster cells. The vertical dotted line represents the mean value of $A^{1/2}/\delta$. The ratios of perimeter to square root of area are obtained by performing least-squares fitting to the point density on each side of the vertical dotted line. The ratios of perimeter and area of the cluster cells are 1.43 and 1.91 in case 1, 1.33 and 1.83 in case 2, and 1.34 and 1.85 in case 3, respectively. Although this is the case, we can also see from the distribution of the most likely values that the clustered particles in the overall sand spreading are mainly concentrated near the wall (the brightest values are more predominant in the small particle area group). In contrast, the distribution of the clusters in the sand-drop experiment is relatively ‘uniform’ in space. Previous studies have associated clusters of particles with large fractal dimensions with turbulent structures to explain the large fractal dimensions that occur in the perimeter and area of clusters of particles clustered in a flow. For example, the understanding of Baker et al. (Reference Baker, Frankel, Mani and Coletti2017) of preferential concentrations suggests that turbulence-driven particle clusters have complementary topological characteristics in response to the underlying flow dynamics. However, the different fractional dimensional shapes of the clustered particles in different wall environments in this paper can be attributed to the effect of particle–wall effects, where the distribution of particles caused by bouncing off the erodible walls and splashing up other particles (especially in the near-wall region) is different from the fully turbulence-driven particle agglomeration pattern. Because of this, the value of the relationship between the fitted perimeter and area is between $1.33$ and $1.43$, influenced by the particles on the near-wall surface.

4.4. The effect of the near-wall effect on particles near the wall

To further investigate the effect of near-wall effects on particle distribution, this section compares the effect of wall effects on the spatial distribution of particles in erodible beds (case 3) and non-erodible beds (case 2). For this purpose, we refine the statistical region slightly. The Voronoi division area distribution of particles in case 2 and case 3 is given in figure 14, where figures 14(a) and 14(c) show the probability density distribution of the normalized area at the near wall (discussed in this section at a vertical position less than 30 mm from the wall) for the two experimental conditions. The results in figure 14(a), on the other hand, show that the corresponding height particles in case 2 have both cluster and sparse behaviour. As the height increases (30 mm in this case), the bell surface curve gradually becomes ‘wider’. At a certain height, as in figure 14(b), a clear intersection with the RPP appears. Figure 14(c) shows the probability statistics of the particle cell area near the wall of case 3, and it can be found that the particle distribution almost coincides with the RPP, and the PDF profile of the normalized area shows the ‘narrow’ phenomenon mentioned previously. This implies that in these height regions, the particles in the flow do not have the statistical characteristics of cluster and evacuation. As shown in figure 14(d), with RPP as the reference, these broadened bell surface profiles have a clear intersection with the RPP distribution curve, i.e. there are clear areas of cluster and evacuation, which is the same as in case 2. Meanwhile, the thresholds of the cluster and void areas gradually converge to a constant value: $\gamma _{A}\approx 0.61, \gamma _{V}\approx 2.1$ as the height increases (as shown in figure 10). The thresholds in the cluster area fluctuate slightly within the error tolerance (marked by grey areas in figure 8), while the thresholds in the void area converge well.

Figure 14. The cell area distribution near the near-wall surface ($z<0.12\delta$) for (a) case 2 and (c) case 3, and (b,d) the cell area distribution at $z>0.12\delta$, which shows significant cluster and void behaviour. (e) The distribution of the ratio of the number of particles in the cluster region to the total particles with height. (f) The ratio of the area of the particle cell in the cluster region to the area of the statistical field of view with height after Voronoi division.

The above results show that ‘clusters’ and ‘voids’ do not occur near the wall in case 3, and the effect of turbulence on particle distribution in this height range is replaced by the splashing process of particles at the wall, which is the main factor affecting the distribution of particles near the wall. Impact splash is the main factor affecting the particle distribution near the wall. Although the particles near the wall do not appear to be ‘clusters’ in the local area, these dense and randomly distributed particles appear in ‘clusters’ when compared with the whole field of view. When the particles leave the wall and reach a certain height, the turbulence causes the particles to disperse in high- and low-concentration areas, and then to cluster or void. At the same time, we find that this ‘null zone’ is a very small distance from the wall, the cluster area gradually appears and its threshold value approaches a fixed value ($\gamma _{A}\approx 0.61$). In this transition zone, particles accumulate randomly in some instances, and in others, more rising particles exit out of the upper part of this zone. Compared with case 2, there is a ‘hysteresis’ process in this region where the wall effect is strong, and the particles accumulate in response to the turbulence signal. However, in case 2, the particles interact with the wall only by collision and rebound, and the bottom wall does not splash up new particles. The particles in the flow field are still primarily influenced by turbulence during motion, so their regions near the wall will have obvious cluster and void areas.

Figure 14(e) gives a plot of the ratio of the number of particles $N_c$ in the region of the cluster to the total number of particles $N$ in the statistical area over the vertical distance. The cluster is judged according to the Voronoi division based on ($\sigma _\gamma > \sigma _\gamma ^{RPP} \approx 0.53$) to find the wall height with the strongest effect of particle–wall action $0.12\delta$ (given in figure 10). Bounded by this height characteristic, this height characteristic is substituted into the ratio of the number of particles in different regions, and statistically, in the near-wall region where the particle–wall effect is obvious, we obtained $N_c/N\approx 0.2$. Along the method of approach, we also calculated the ratio of the cluster area after Voronoi division to the total area, and the critical value of the cluster area is approximately $A_c/A\approx 0.1$, as shown in figure 14(f). Under the influence of the action of the grain wall, the proportion of clustered particles to the total number of particles can be up to $35\,\%$ outside the near-wall region, which is higher than that within the same region in case 1. The percentage of aggregated particle area is also close to $15\,\%$, which is significantly higher than the result of case 1. We can observe it more visually by Voronoi division staining. Figure 15 shows the colour diagrams of the constituent cells of the particles in the cluster region in the sand-laying experiment. Figures 15(a) and 15(b) correspond to the instantaneous distribution of particles at a certain moment in case 2 and case 3, respectively, where the red area shows the particles in the cluster region and the light blue area shows the void region. Figure 15(b) shows a significantly larger proportion of clustered particles compared with figure 15(a), especially in the near-wall region ($z<0.12\delta$), where the topological complementary structure of clustered particles exists in sheets. Under case 1 and case 2 conditions, the proximal wall does not show a patchwork of cells.

Figure 15. Cluster and void areas. Visualization of the particles in (a) case 2, local sand-laying experiment, and (b) case 3, whole sand-laying experiment.

5. Conclusion

In this paper, two-phase flow wind tunnel experiments with different particle release methods were carried out, and the other flow and particle parameters were the same for the three groups of experiments except for the different particle release methods. In this paper, two types of experiments, identified as sand-throwing and sand-spreading cases, are designed to construct different particle–wall interaction processes. Among them, the sand-throwing experiments cause the particles to enter the flow field by releasing the particles from the top, while the sand-laying experiments include overall sand laying and local sand laying, where the particles are released from the surface by the wind field shear. The interaction between the particles and the wall is similar in the sand-dropping experiment and the partial sand-laying experiment, where only collision and rebound are present in the measurement area. In contrast, the overall sand laying includes not only collision bounce but also the impact and splash up of particles due to wall influences in the measurement area. A large-field-of-view PIV system is used to photograph the particles in the flow field, and enough instantaneous images of the particle distribution are obtained for subsequent statistical analysis of the particle clustering behaviour. Using the Voronoi method, this paper delineates the area occupied by distributed particles and identifies thresholds for particle voids and clusters. By analysing the laws of particle clusters and voids under different wall conditions, the effect of particle–wall interaction on particle clustering behaviour is revealed.

The results of this paper show that in two-phase wall turbulence with different release modes, clustering and void regions of particles occur in a certain wall-normal distance range. On a finite scale, the particle voids and clusters are statistically self-similar, and the probability density distribution of the area of the particles forming Voronoi cells decreases with a ‘$-5/3$’ power law. However, due to the particle–wall interaction, this probability density distribution gradually deviates from the ‘$-5/3$’ power law. More importantly, the experimental comparison of local sand laying and overall particle laying revealed that the impact and splash-up effects of particles changed the statistical characteristics of local particle clusters and voids. In the near-wall region ($z<0.12\delta$), the splashing effect causes many particles to accumulate near the wall, leading to a statistical analysis of this region showing that there are no typical clustering and void phenomena and that the particle distributions are closer to random distributions. The clustering phenomenon is evident only in the region of $z>0.12\delta$. In contrast, in the experiments without impacts or splash up, only with particle bounce, the particle distribution in space always shows the cluster phenomenon. This implies that the particle-avoidance interaction significantly affects the cluster behaviour of particles in two-phase flow, especially in the near-wall region with splashing, where the particle motion behaviour is dominated by the impact and splash-up effects.

Acknowledgements

The authors are very grateful to Y. Feng and Y. Wang for their assistance with the experiments.

Funding

This study was supported by grants from the National Natural Science Foundation of China (no. 92052202). The authors would like to express their sincere appreciation for the support.

Declaration of interests

The authors report no conflict of interest.

References

Aliseda, A., Cartellier, A., Hainaux, F. & Lasheras, J.C. 2002 Effect of preferential concentration on the settling velocity of heavy particles in homogeneous isotropic turbulence. J. Fluid Mech. 468, 77105.Google Scholar
Baas, A.C.W. & Sherman, D.J. 2005 Formation and behavior of aeolian streamers. J. Geophys. Res.: Earth Surf. 110, F3.Google Scholar
Baker, L., Frankel, A., Mani, A. & Coletti, F. 2017 Coherent clusters of inertial particles in homogeneous turbulence. J. Fluid Mech. 833, 364398.CrossRefGoogle Scholar
Balachandar, S. & Eaton, J.K. 2010 Turbulent dispersed multiphase flow. Annu. Rev. Fluid Mech. 42, 111133.CrossRefGoogle Scholar
Bragg, A.D. & Collins, L.R. 2014 New insights from comparing statistical theories for inertial particles inturbulence: I. Spatial distribution of particles. Phys. Rev. Fluids 16 (5), 055013.Google Scholar
Bragg, A.D., Ireland, P.J. & Collins, L.R. 2015 Mechanisms for the clustering of inertial particles in the vinertial range of isotropic turbulence. Phys. Rev. E 92 (2), 023029.Google Scholar
Brandt, L. & Coletti, F. 2022 Particle-laden turbulence: progress and perspectives. Annu. Rev. Fluid Mech. 54, 159189.CrossRefGoogle Scholar
Chauhan, K.A., Monkewitz, P.A. & Nagib, H.M. 2009 Criteria for assessing experiments in zero pressure gradient boundary layers. Fluid Dyn. Res. 41 (2), 021404.CrossRefGoogle Scholar
Chen, L., Goto, S. & Vassilicos, J.C. 2006 Turbulent clustering of stagnation points and inertial particles. J. Fluid Mech. 553, 143154.CrossRefGoogle Scholar
Coleman, S.W. & Vassilicos, J.C. 2009 A unified sweep-stick mechanism to explain particle clustering in two- and three-dimensional homogeneous, isotropic turbulence. Phys. Fluids 21 (11), 113301.Google Scholar
Dejoan, A. & Monchaux, R. 2013 Preferential concentration and settling of heavy particles in homogeneous turbulence. Phys. Fluids 25 (1), 013301.Google Scholar
Eaton, J.K. & Fessler, J. 1994 Preferential concentration of particles by turbulence. Intl J. Multiphase Flow 20, 169209.CrossRefGoogle Scholar
Ellis, J.T., Li, B., Farrell, E.J. & Sherman, D.J. 2009 Protocols for characterizing aeolian mass-flux profiles. Aeolian Res. 1 (1–2), 1926.CrossRefGoogle Scholar
Falkinhoff, F., Obligado, M. & Bourgoin, P.M. 2014 Preferential concentration of free-falling heavy particles in turbulence. Phys. Rev. Lett. 125 (16), 064504.CrossRefGoogle Scholar
Ferenc, J.S. & Néda, Z. 2007 On the size distribution of Poisson Voronoi cells. Phys. A: Stat. Mech. Appl. 385 (2), 518526.CrossRefGoogle Scholar
Fessler, J.R., Kulick, J.D. & Eaton, J.K. 1994 Preferential concentration of heavy particles in a turbulent channel flow. Phys. Fluids A 6 (11), 37423749.Google Scholar
Fong, K.O., Amili, O. & Coletti, F. 2019 Velocity and spatial distribution of inertial particles in a turbulent channel flow. J. Fluid Mech. 872, 367406.CrossRefGoogle Scholar
Goto, S. & Vassilicos, J.C. 2006 Self-similar clustering of inertial particles and zero-acceleration points in fully developed two-dimensional turbulence. Phys. Fluids 18 (11), 115103.Google Scholar
Gustavsson, K. & Mehlig, B. 2011 a Ergodic and non-ergodic clustering of inertial particles. Eur. Phys. Lett. 96, 60012.Google Scholar
Gustavsson, K. & Mehlig, B. 2011 b Statistical models for spatial patterns of heavy particles in turbulence. Adv. Phys. 65 (1), 157.CrossRefGoogle Scholar
Konan, N.A., Kannengieser, O. & Simonin, O. 2009 Stochastic modeling of the multiple rebound effects for particle-rough wall collisions. Intl J. Multiphase Flow 35 (10), 933945.Google Scholar
Li, Y., McLaughlin, J.B., Kontomaris, K. & Portela, L. 2001 Numerical simulation of particle-laden turbulent channel flow. Phys. Fluids 13 (10), 29572967.Google Scholar
Liu, H., Feng, Y. & Zheng, X. 2022 Experimental investigation of the effects of particle near-wall motions on turbulence statistics in particle-laden flows. J. Fluid Mech. 943, A8.Google Scholar
Marchioli, C. 2017 Physics and modelling of particle deposition and resuspension in wall-bounded turbulence. In Particles in Wall-Bounded Turbulent Flows: Deposition, Re-suspension and Agglomeration (ed. J.P. Minier & J. Pozorski), CISM International Centre for Mechanical Sciences, vol. 571, pp. 151–208. Springer.CrossRefGoogle Scholar
Marchioli, C. & Soldati, A. 2002 Mechanisms for particle transfer and segregation in a turbulent boundary layer. J. Fluid Mech. 468, 283315.CrossRefGoogle Scholar
Marusic, I. & Kunkel, G.J. 2003 Streamwise turbulence intensity formulation for flat-plate boundary layers. Phys. Fluids 15 (8), 24612464.CrossRefGoogle Scholar
Maxey, M.R. 1987 The gravitational settling of aerosol particles in homogeneous turbulence and random flow fields. J. Fluid Mech. 174, 441465.CrossRefGoogle Scholar
Maxey, M.R. 1993 Settling velocity and concentration distribution of heavy particles in homogeneous isotropic turbulence. J. Fluid Mech. 256, 2768.Google Scholar
Momenifar, M. & Bragg, A.D. 2020 Local analysis of the clustering, velocities, and accelerations of particles settling in turbulence. Adv. Phys. 5, 034306.Google Scholar
Monchaux, R., Bourgoin, M. & Cartellier, A. 2010 Preferential concentration of heavy particles: a Voronoï analysis. Phys. Fluids 22 (10), 103304.Google Scholar
Monchaux, R., Bourgoin, M. & Cartellier, A. 2012 Analyzing preferential concentration and clustering of inertial particles in turbulence. Intl J. Multiphase Flow 40, 118.CrossRefGoogle Scholar
Muthanna, C., Nieuwstadt, F.T.M. & Hunt, J.C.R. 2005 Measurement of the aerodynamic forces on a small particle attached to a wall. Exp. Fluids 39, 455463.Google Scholar
Obligado, M., Cartellier, A. & Bourgoin, M. 2014 Experimental detection of superclusters of water droplets in homogeneous isotropic turbulence. Europhys. Lett. 112 (5), 54004.CrossRefGoogle Scholar
Obligado, M., Teitelbaum, T., Cartellier, A., Mininni, P. & Bourgoin, M. 2014 Preferential concentration of heavy particles in turbulence. J. Turbul. 15 (5), 293310.CrossRefGoogle Scholar
Petersen, A.J., Baker, L. & Coletti, F. 2019 Experimental study of inertial particles clustering and settling in homogeneous turbulence. J. Fluid Mech. 864, 925970.CrossRefGoogle Scholar
Rasmussen, K.R. & Sørensen, M. 2008 Vertical variation of particle speed and flux density in aeolian saltation: measurement and modeling. J. Geophys. Res.: Earth Surf. 113 (F2), F02S12.Google Scholar
Reeks, M.W. 1983 Mechanisms for particle transfer and segregation in a turbulent boundary layer. Aerosol Sci. 14 (6), 729739.CrossRefGoogle Scholar
Saw, E.W., Bewley, G.P., Bodenschatz, E., Sankar Ray, S. & Bec, J. 2014 Extreme fluctuations of the relative velocities between droplets in turbulent airflow. Phys. Fluids 26 (11), 111702.CrossRefGoogle Scholar
Sciacchitano, A., Wieneke, B. & Scarano, F. 2013 PIV uncertainty quantification by image matching. Meas. Sci. Technol. 24 (4), 045302.Google Scholar
Sommerfeld, M. 2003 Analysis of collision effects for turbulent gas-particle flow in a horizontal channel: part I. Particle transport. Intl J. Multiphase Flow 29 (4), 675699.Google Scholar
Squires, K.D. & Eaton, J.K. 1990 Particle response and turbulence modification in isotropic turbulence. Phys. Fluids A: Fluid Dyn. 2 (7), 11911203.CrossRefGoogle Scholar
Sumbekova, S., Cartellier, A., Aliseda, A. & Bourgoin, M. 2017 Preferential concentration of inertial sub-Kolmogorov particles: the roles of mass loading of particles, Stokes numbers, and Reynolds numbers. Phys. Rev. Fluids 2 (2), 024302.Google Scholar
Tagawa, Y., Mercado, J.M., Prakash, V.N., Calzavarini, E., Sun, C. & Lohse, D. 2012 Three-dimensional Lagrangian Voronoï analysis for clustering of particles and bubbles in turbulence. J. Fluid Mech. 693, 201215.Google Scholar
Wang, L.P. & Maxey, M.R. 1993 Settling velocity and concentration distribution of heavy particles in homogeneous isotropic turbulence. J. Fluid Mech. 256, 2768.Google Scholar
Wang, P., Feng, S., Zheng, X. & Sung, H.J. 2019 The scale characteristics and formation mechanism of aeolian sand streamers based on large eddy simulation. J. Geophys. Res.: Atmos. 124 (21), 1137211388.CrossRefGoogle Scholar
Wang, Y. & Lam, K.M. 2020 Clustering behaviour and settling velocity of bidisperse inertial particles in turbulent open channel flow. Intl J. Multiphase Flow 129, 103303.Google Scholar
Zamansky, R., Coletti, F., Massot, M. & Mani, A. 2016 Turbulent thermal convection driven by heated inertial particles. J. Fluid Mech. 809, 390437.Google Scholar
Zeng, L. 2007 Interaction between a spherical particle and wall-bounded flows at finite Reynolds number. PhD thesis, University of Illinois at Urbana-Champaign.Google Scholar
Zheng, X., Wang, G. & Zhu, W. 2021 Experimental study on the effects of particle-wall interactions on VLSM in sand-laden flows. J. Fluid Mech. 914, A35.Google Scholar
Zhu, H., Pan, C., Wang, G., Liang, Y., Ji, X. & Wang, J. 2021 Attached eddy-like particle clustering in a turbulent boundary layer under net sedimentation conditions. J. Fluid Mech. 920, A53.Google Scholar
Figure 0

Figure 1. Experimental set-up. (a) Case 1: uniform sand throwing located at the top of the wind tunnel; (b) case 2: local sand laying; (c) case 3: overall sand-laying experimental set-up.

Figure 1

Figure 2. Particle size distribution and cumulative distribution of mixed sand particles used in the experiment.

Figure 2

Figure 3. Statistics of the fluid and particle phases. (a) Mean velocity profile and turbulent kinetic energy distribution in the particle-free flow. (b) Mean velocity profiles of the fluid phase in different cases. (c) Mean velocity profiles of particles in different cases.

Figure 3

Figure 4. (a) A particle image after processing and (b) the Voronoi division associated with this image. For the sake of clarity, we only show the local map division of the field of view.

Figure 4

Figure 5. (a) Localized Voronoi division applied to case 1. (b) Plots of PDFs of the particle Voronoi division area at $z/\delta =0.321$ in three cases, compared with the RPP which is plotted as the black dotted line. (c) Centred and normalized PDFs of the logarithm of Voronoi area for three cases at $z/\delta =0.321$, the dotted line being a Gaussian distribution.

Figure 5

Figure 6. Sand-dropping experiment. (a) The PDF of the normalized area. The black dashed line is the RPP, the intersection points of the profiles of the experimental data are defined as the clustering threshold and the void threshold, respectively, and the shaded part represents the distribution range of both thresholds. (b) The PDF profile of the data after logarithmic transformation, the dashed line representing the standard Gaussian distribution.

Figure 6

Figure 7. (a) Particle size distribution and (b) cumulative distribution of mixed sand particles used in the experiment.

Figure 7

Figure 8. (a) The probability distribution of the cell area at different heights for case 2 (local sand laying). (b) The area distribution after normalization using the local mean area, finding the clustering area by matching the RPP thresholds for the areas and void areas. (c) The data in (b) are normalized by logarithm to attempt to fit for use of a Gaussian distribution description. (df) The results of case 3 (overall sand-laying experiment).

Figure 8

Figure 9. (a) Cluster threshold statistics for the three experimental conditions. (b) Threshold for the void region. The dashed line in (a) approaches $\gamma _{C}=0.6$; the dashed line in (b) approaches $\gamma _{V}=2.1$.

Figure 9

Figure 10. Dotted line plot of the root mean square value of cell area with height, after Voronoi division.

Figure 10

Figure 11. The PDF of the area of the cells in the cluster region in (a) case 1, (c) case 2 and (e) case 3. The PDF of the area of the cells in the void region in (b) case 1, (d) case 2 and (f) case 3. The dotted line shows a $-5/3$ power law; $A_C$ and $A_V$ are the cell area for clusters and voids, respectively.

Figure 11

Figure 12. Probability density distribution of the normalized area of cells in three cases: (a) in the cluster regions and (b) in the void regions. Parameters $A_C$ and $A_V$ are the cell areas for clusters and voids, respectively.

Figure 12

Figure 13. The joint PDFs of perimeter versus area of the cluster cells in (a) case 1, (b) case 2 and (c) case 3. The vertical dotted lines represent the mean value of $A^{1/2}/\delta$; the dashed lines are least-squares fittings to the point density.

Figure 13

Figure 14. The cell area distribution near the near-wall surface ($z<0.12\delta$) for (a) case 2 and (c) case 3, and (b,d) the cell area distribution at $z>0.12\delta$, which shows significant cluster and void behaviour. (e) The distribution of the ratio of the number of particles in the cluster region to the total particles with height. (f) The ratio of the area of the particle cell in the cluster region to the area of the statistical field of view with height after Voronoi division.

Figure 14

Figure 15. Cluster and void areas. Visualization of the particles in (a) case 2, local sand-laying experiment, and (b) case 3, whole sand-laying experiment.