


1. Introduction
Shock interactions are fundamental phenomena existing widely in supersonic flow fields. Common examples of shock interactions can be found both in external flows, such as hypersonic vehicle bodies (Grasso et al. Reference Grasso, Purpura, Chanetz and Delery2003), and in internal flows, such as engine inlets and nozzles (Matsuo, Miyazato & Kim Reference Matsuo, Miyazato and Kim1999; Guan et al. Reference Guan, Bai, Lin and Wu2020). Shock interactions pose serious concerns to aircraft design, as they are prone to trigger significant increases in local pressure/heating loads on vehicle surfaces (Wieting & Holden Reference Wieting and Holden1989). Because of the important physical mechanism and practical applications, shock interactions have been extensively investigated since the pioneering research conducted by Edney (Reference Edney1968a,Reference Edneyb). In his study, shock interactions were classified into six types according to the shock strengths and intersection positions. Based on this classification scheme, comprehensive research on shock interactions regarding various canonical configurations, including an oblique shock impinging on a bow shock (BS) (Grasso et al. Reference Grasso, Purpura, Chanetz and Delery2003), a double wedge (Ben-dor et al. Reference Ben-dor, Vasilev, Elperin and Zenovich2003; Durna, Barada & Celik Reference Durna, Barada and Celik2016), a double cone (Druguet, Candler & Nompelts Reference Druguet, Candler and Nompelts2005; Tumuklu, Levin & Theofilis Reference Tumuklu, Levin and Theofilis2018) and spiked blunt bodies (Panaras & Drikakis Reference Panaras and Drikakis2009) have been performed. These investigations have focused on examining flow characteristics (Olejniczak, Wright & Candler Reference Olejniczak, Wright and Candler1997), pressure/heating loads (Wieting & Holden Reference Wieting and Holden1989) and unsteady oscillations (Zhong Reference Zhong1994) associated with shock interactions. Nevertheless, although significant progress has been made in understanding two-dimensional shock interactions, practical scenarios continue to present researchers with more intricate three-dimensional configurations that pose new challenges.
Recently, there has been a growing interest in shock interactions occurring on a V-shaped blunt leading edge (VBLE) (Xiao et al. Reference Xiao, Li, Zhang, Zhu and Yang2018; Zhang et al. Reference Zhang, Li, Li and Yang2019; Zhang, Li & Yang Reference Zhang, Li and Yang2021), which is typically observed in a hypersonic inward-turning inlet (You Reference You2011; Gollan & Smart Reference Gollan and Smart2013; Bisek Reference Bisek2016). It has been found that the detached shock waves generated from the swept blunt leading edges tend to induce complicated shock interactions. To reveal the complex flow mechanism, Xiao et al. (Reference Xiao, Li, Zhang, Zhu and Yang2018) first proposed a simplified model of the VBLEs characterized by a crotch radius  $R$, a leading-edge radius $r$ and a half-span angle $\beta$, as shown in figure 1. The linear section is referred to as the straight branch, and the rounded portion is known as the crotch. It has been found that the shock interaction patterns at the crotch are sensitive to the geometry parameters and the free stream Mach number. Based on the flow structures in the $x$–
$x$– $z$ symmetry plane, the interactions were categorized into three distinct types: regular reflection (RR); Mach reflection (MR); and regular reflection from the same family (sRR), as depicted in figure 2. In the case of an RR structure (figure 2a), two detached shock waves ( $\text {DS}_1$ and $\text {DS}_2$) generated from the blunt leading edge intersect in the crotch region, producing two transmitted shocks ( $\text {TS}_1$ and $\text {TS}_2$). Downstream of the interaction point (IP), $\text {TS}_1$ and $\text {TS}_2$ collide with the wall, resulting in localized circumfluence and separation shocks ( $\text {SS}_1$ and $\text {SS}_2$). These separation shocks intersect at $\text {IP}_1$, which lies downstream of the IP. In an MR configuration (figure 2b), a Mach stem (MS) appears between $\text {DS}_1$ and $\text {DS}_2$. The resulting triple points ( $\text {T}_1$ and $\text {T}_2$) emit the transmitted shocks $\text {TS}_1$ and $\text {TS}_2$, as well as the shear layers (or the slip lines) $\text {SL}_1$ and $\text {SL}_2$. At the junction of the straight branch and the crotch, which is referred to as the elbow by Zhang et al. (Reference Zhang, Li and Yang2021), the curved shocks ( $\text {CS}_1$ and $\text {CS}_2$) or compression waves ( $\text {CWs}_1$ and $\text {CWs}_2$) are generated along the converging wall and form secondary interactions with the transmitted shocks. When the interaction is an RR, the intersection point is labelled $\text {IP}_2$. In some cases, the CS or CWs may reach the DS before the MR occurs, leading to a transformation of the primary interaction structure into an sRR, as shown in figure 2(c). The CS directly intersects with the DS from the same branch at point $\text {IP}_3$ and the previously existing MS in front of the crotch is replaced by a concave BS.

Figure 1. The simplified model of the VBLEs proposed by Xiao et al. (Reference Xiao, Li, Zhang, Zhu and Yang2018).

Figure 2. Schematic illustration of the three interaction types at the crotch of VBLEs: (a) RR; (b) MR; (c) sRR.
Since complex shock interactions usually result in substantial heating loads, further exploration of the pressure/heating loads associated with these interaction types on VBLEs has been conducted by Xiao et al. (Reference Xiao, Li, Zhang, Zhu and Yang2018), Li et al. (Reference Li, Zhang, Wang and Yang2019) and Wang et al. (Reference Wang, Li, Zhang and Yang2020). It has been pointed out that a considerable reduction in the pressure/heating peaks can be achieved by changing the shock interaction pattern from an MR to an sRR. To guide the design of the VBLEs, Zhang et al. (Reference Zhang, Li and Yang2021) thoroughly investigated the transitions of the interaction configurations at a Mach number of 6. By analysing the relative geometric positions of the shock structures near the crotch, they established the transition criteria from RR to MR and from MR to sRR. It has been shown that the coalescence between the IP and IP1 in RR is followed by a transition from RR to MR, whereas the coalescence between the triple point T and the CS (or the CWs) in MR leads to the transition from MR to sRR.
Generally, the transition criteria of Zhang et al. (Reference Zhang, Li and Yang2021) are established based on the positions of the characteristic points. However, although the positions of DS and CS can be solved theoretically, the triple point T in MR configurations is difficult to pinpoint due to the downstream accumulation effects of the crotch (Zhang et al. Reference Zhang, Li and Yang2021). Although the numerical results can be fitted to determine the position, this fitting is only applicable to a specific set of free stream conditions and geometry. Given the variety of incoming flow parameters and geometric configurations, it is imperative to develop a theoretical approach for determining the location of the triple point. Indeed, although research on MRs has a long history and increasingly accurate physical models have been developed for predicting the position of the triple point (Li & Ben-Dor Reference Li and Ben-Dor1997; Gao & Wu Reference Gao and Wu2010; Zhang et al. Reference Zhang, Xu, Shi, Zhu and You2023) in two-dimensional flows, theoretical research on three-dimensional MRs remains challenging due to the complexity of the flow structure.
Considering the critical application, this paper concentrates on the shock structures of the primary MR configuration on VBLEs and the transition from the primary MR to sRR. To reveal the complex flow mechanism, a theoretical approach based on a simplified continuity method is proposed to describe the flow behaviour and efficiently predict the shock configurations. The theoretical model and numerical simulations are utilized to investigate the influence of the  $R/r$ ratio, the half-span angle $\beta$ and the free stream Mach number $M_0$ on the shock configurations and the MR to sRR transition. Finally, the transition boundary between the primary MR and sRR is derived from the theoretically predicted shock positions. Given the significant reduction in the pressure/heating loads during the transition from the primary MR to sRR, the transition boundary can provide essential guidance for the design of VBLEs.
2. Research methods
2.1. Theoretical methods
This section presents theoretical analyses of the primary MR configuration on VBLEs, focusing on the shock waves generated by the straight branch and at the crotch, respectively. Simplified models are established to predict the shock wave positions, and to gain a deeper understanding of the nature and behaviour of the three-dimensional shock interactions on VBLEs. For consistency of the analysis, VBLEs are set to be symmetrical with respect of the  $x$–
$x$– $y$ and $x$–
$x$– $z$ planes throughout this paper. As shown in figure 1, the coordinates $x$,
$x$,  $y$,
$y$,  $z$ and $\varphi$ denote the streamwise, transverse, spanwise and circumferential directions, respectively. The leading-edge bluntness $r$ is fixed at 2 mm and the length of a straight branch is $L=30r$.
2.1.1. The straight branch
The straight branch is essentially a swept cylinder with a sweep angle equivalent to the half-span angle  $\beta$. When the half-span angle $\beta$ is larger than the Mach angle, a DS will be generated from the swept cylinder and gradually develop along the wall until it reaches a fully developed state. The fully developed state results in a constant standoff distance, which is denoted as $l$ in this paper. Therefore, a fully developed DS is presented as an oblique shock with a shock angle equal to $\beta$ on the $x$–
$x$– $z$ symmetry plane and the flow component perpendicular to it can be treated as a supersonic flow around a cylinder with a radius $r$. Previous researchers have conducted extensive theoretical work on this flow pattern (Moeckel Reference Moeckel1949; Hida Reference Hida1953; Lighthill Reference Lighthill1957). To obtain the standoff distance, Zhang et al. (Reference Zhang, Li and Yang2021) followed the inviscid theoretical approximation proposed by Sinclair & Cui (Reference Sinclair and Cui2017). This theoretical approach demonstrates excellent and consistent agreement with the computational solutions and experimental results across a wide range of Mach numbers from 1.35 to 6. However, due to the complexity involved in the derivation, this method faces difficulties in being extended to three-dimensional flows. In this paper, an approximate method proposed by Moeckel (Reference Moeckel1949) for predicting detached shock waves ahead of blunt bodies is applied. This approach is based on a simplified form of the continuity relation and can be easily developed into three-dimensional flows, which will be discussed in § 2.1.2.
A schematic diagram of the simplified continuity method is depicted in figure 3. The black solid line represents the surface of the blunt body and the red solid line is the detached shock DS ahead of it. The vertex of the blunt body is located at the origin and is denoted as O, while the foremost point of the DS is referred to as D. The distance between two points is identified as the standoff distance  $l$. Here, B and S represent the sonic points on the body surface and on the shock wave, respectively; $\delta _B$ and $\delta _S$ are the flow deflection angles at the two points. The blue dashed line connecting points B and S is assumed to be the sonic line. The free stream is oriented parallel to the $x$-axis. The DS are normal to the free stream at their foremost point D and tend to approach the free stream Mach waves at large distances from the point. Hence, the DS in figure 3 is asymptotic to the free stream Mach line, i.e. the red dashed line, which inclines at the Mach angle $\alpha$ and intersects the $x$-axis at point A. Assuming that the shock wave is a simple curve that exhibits these properties, i.e. a hyperbola, which can be expressed mathematically as
 \begin{equation} y = k\sqrt {{{( {x - {x_{{A}}}} )}^2} - {{( {{x_{{D}}} - {x_{{A}}}} )}^2}}, \end{equation}
where  $k$ is the tangent of the free stream Mach angle $\alpha$. Using this equation of DS, the shock angle $\theta$, which is the angle between the stream direction and the tangent to the shock, can be determined at any point from
 \begin{equation} \tan \theta = \frac{{k(x - {x_{{A}}})}}{{\sqrt {{{( {x - {x_{{A}}}} )}^2} - {{( {{x_{{D}}} - {x_{{A}}}} )}^2}} }} = \frac{{k\sqrt {{k^2}{{( {{x_{{D}}} - {x_{{A}}}} )}^2} + {y^2}} }}{y}. \end{equation}
Figure 3. Schematic illustration of the simplified continuity method for predicting the detached shock waves ahead of blunt bodies.
To calculate the standoff distance  $l$ using the continuity method, the position of the shock wave relative to the body surface should be determined by using the geometric relation between B and S. The coordinates of the point S are
 \begin{equation} \left.\begin{array}{c@{}} \displaystyle {x_{{S}}} = \dfrac{{( {{x_{{D}}} - {x_{{A}}}} )}}{{\sqrt {1 - {k^2}{{\cot }^2}{\theta _{{S}}}} }} + {x_{{A}}}\\ \displaystyle {y_{{S}}} = \dfrac{{{k^2}( {{x_{{D}}} - {x_{{A}}}} )\cot {\theta _{{S}}}}}{{\sqrt {1 - {k^2}{{\cot }^2}{\theta _{{S}}}} }} \end{array}\right\}, \end{equation}
where  $\theta _S$ is the shock angle at point S and can be calculated from the oblique shock relations. For bodies with sharp or clearly defined shoulders, research has found that the sonic point B is located at the shoulder (Ladenburg, VanVoorhis & Winckler Reference Ladenburg, VanVoorhis and Winckler1946). For more gradually curved bodies, such as ogives, Busemann (Reference Busemann1949) suggested that the shoulder is located at the point where the contour of the body is inclined at the wedge angle or cone angle corresponding to shock detachment. For the cylinder with a radius $r$, by using $\delta _d$ to denote the shock wave detachment angle, the coordinates of the sonic point B can be expressed as
 \begin{equation} \left.\begin{array}{c@{}} {x_{{B}}} = r( {1 - \sin {\delta _d}} )\\ {y_{{B}}} = r\cos {\delta _d} \end{array}\right\}. \end{equation}
From figure 3, the geometric relationship between sonic points S and B can be described as follows:
 \begin{equation} {x_{{S}}} = {x_{{B}}} + ( {{y_{{B}}} - {y_{{S}}}} )\tan \eta, \end{equation}
where  $\eta$ is the inclination of the sonic line and can be estimated by the arithmetic mean of the inclinations at the two extremities,
 \begin{equation} \eta = \frac{{{\delta _d} + {\delta _s}}}{2}. \end{equation}
By substituting the coordinates (2.3) of point S into (2.5), we obtain
 \begin{equation} \frac{{( {{x_{{D}}} - {x_{{A}}}} )}}{{\sqrt {1 - {k^2}{{\cot }^2}{\theta_{{S}}}} }} + {x_{{A}}} = {x_{{B}}} + \left[ {{y_{{B}}} - \frac{{{k^2}( {{x_{{D}}} - {x_{{A}}}})\cot {\theta _{{S}}}}}{{\sqrt {1 - {k^2}{{\cot }^2}{\theta _{{S}}}} }}} \right]\tan \eta. \end{equation}
 This equation establishes the relationship between  $x_{{D}}$ and $x_{{A}}$, from which we can solve for $x_{{A}}$:
 \begin{equation} {x_{{A}}} = \frac{{( {1 + {k^2}\cot {\theta _{{S}}}\tan \eta } ){x_{{D}}} - \sqrt {1 - {k^2}{{\cot }^2}{\theta _{{S}}}} ( {{x_{{B}}} + {y_{{B}}}\tan \eta } )}}{{1 + {k^2}\cot {\theta _{{S}}}\tan \eta - \sqrt {1 - {k^2}{{\cot }^2}{\theta _{{S}}}} }}. \end{equation}
 Through the above derivation of the geometric relationship, only the quantity  $x_{{D}}$ remains to be determined for the prediction of the detached shock DS. To determine this value, the continuity relation should be applied to the control volume surrounded by the body contour, the detached shock, the sonic line and the symmetry plane (or the $x$-axis), i.e. the subsonic flow through the shock segment SD is isentropically accelerated to the speed of sound and across the sonic line. As the distribution of the flow variables along the sonic line is unknown, the stagnation pressure immediately behind the shock is applied for the calculation. For planar flow, the average value of this quantity can be approximated by using the stagnation pressure $P_C$ behind the shock at the $y_{{C}}=y_{{S}}/2$. By denoting the stagnation pressure of the free stream and the contraction ratio required to decelerate the free stream to sonic velocity isentropically as $P_0$ and $\sigma$, respectively, the simplified continuity equation may be expressed as
 \begin{equation} {A_{{S}}} = \sigma {A_0}\frac{{{P_0}}}{{{P_{{C}}}}}, \end{equation}
where  $A_0$ is the projected height of the shock segment SD on the free stream direction and AS is the length of the sonic line BS, i.e.
 $$\begin{gather} {A_0} = {y_{{S}}}, \end{gather}$$
 $$\begin{gather}{A_{{S}}} = \frac{{{y_{{S}}} - {y_{{B}}}}}{{\cos \eta }}. \end{gather}$$
 Figure 4 provides a comparison of the non-dimensional shock standoff distance  $l/r$ estimated by the continuity method with the theoretical method of Sinclair & Cui (Reference Sinclair and Cui2017), the experimental results of Alperin (Reference Alperin1950), Kaattari (Reference Kaattari1961) and Kim (Reference Kim1956), as well as the inviscid computational fluid dynamics (CFD) results of this work. While both theoretical methods have been found to exhibit good agreement with the experimental and simulation results for low free stream Mach numbers, it has been noted that the method of Sinclair & Cui (Reference Sinclair and Cui2017) shows some deviation at higher Mach numbers. At the same time, the continuity method can present excellent agreement across the entire range of Mach numbers from 1 to 10. This result indicates that the continuity method is a reliable and robust approach for modelling the supersonic flow around a cylinder, especially at higher Mach numbers. Moreover, this method also applies to bodies with a variety of contour shapes, such as ellipses, wedges, etc., with minor modifications of the shoulder.

Figure 4. The non-dimensional shock standoff distance  $l/r$ for a cylinder as a function of the free stream Mach number $M_0$ obtained by different methods.
Figure 5 further compares the non-dimensional shock standoff distance  $l/r$ for swept cylinders between the theoretical results and viscous CFD results. The sweep angle $\beta$ is fixed at $24^\circ$ in figure 5(a) and the free stream Mach number $M_0$ is fixed at 6 in figure 5(b). It is observed that the theoretical estimations closely agree with the numerical results for relatively large sweep angles ( $\beta >24^\circ$) and free stream Mach numbers ( $M_0>6$), although viscosity effects have not been considered in theoretical prediction. This indicates that the shock standoff distance is rarely affected by the boundary layer on the straight branch in the present conditions. The difference between the theoretical and CFD results for small values of $\beta$ and $M_0$ is mainly caused by the limited length of the straight branch (Zhang et al. Reference Zhang, Li and Yang2021). Generally, it is harder for a DS to achieve the fully developed state due to the weaker vertical compression when the flow component $M_0\sin {\beta }$ is small. Therefore, this study focuses on cases in which the vertical Mach number component is relatively large. Also, the method is not applicable when $\beta$ is large enough to make the flow behind the DS subsonic, where disturbances generated by the crotch of the VBLE may affect the upstream flow and the shape of the DS. This limitation, however, does not impact the current investigation, as the MR structure and the CS at the crotch cannot be generated under such a condition.

Figure 5. The non-dimensional shock standoff distance  $l/r$ for swept cylinders obtained by theoretical method and numerical simulations as the function of (a) the free stream Mach number at a fixed sweep angle of $24^\circ$ and (b) the sweep angle at a fixed free stream Mach number of 6.
2.1.2. The crotch
Apart from solving the DS of the straight branch, the continuity method can also be utilized for the three-dimensional interaction structure of the primary MR at the crotch with reasonable simplification and assumption of the flow behaviour. Figure 6 presents the primary MR configuration and the secondary interactions of the TS at the crotch in the  $x$–
$x$– $z$ symmetry plane. In figure 6(a), it can be observed that a pair of DSs with standoff distance $l$ and shock angle $\beta$ from opposite families meet in front of the crotch, producing a Mach stem MS and two triple points T. The transmitted shock TS and the shear layer SL emanate from point T. The vertical distance between two triple points is defined as the MS height $H_m$. The horizontal distance between the triple point T and the stagnation point of the crotch is denoted as the triple point position $d$. By positioning the origin at the stagnation point O, the geometry equation of the shock waves and wall surfaces in the plane can be easily established. To begin with, we can describe the contour of the wall by employing the radius $R$ of the crotch and the half-span angle $\beta$,
 $$\begin{gather} \text{the crotch:}\qquad z ={\pm} [ { - \sqrt {{R^2} - {{( {x + R} )}^2}} }], \end{gather}$$
 $$\begin{gather}\text{the straight branch:}\qquad z ={\pm} \tan \beta \left( {x + R - \frac{R}{{\sin \beta }}} \right), \end{gather}$$
where the signs  $-$ and $+$ represent the contour at the upper and lower branches, respectively. According to the analysis in § 2.1.1, DS is an oblique shock parallel to the straight branch with a standoff distance $l$. Thus, the geometry of DS can be expressed as follows:
 \begin{equation} z ={\pm} \tan \beta \left( {x + R + \frac{{l - R}}{{\sin \beta }}} \right). \end{equation}
Figure 6. The primary MR configuration at the crotch of VBLEs, (b) the secondary interaction between the TS and the SS, (c) the secondary MR and (d) the secondary RR between the TS and the CS.
With (2.14), it is possible to derive an expression that relates the coordinates of the point T to the MS height  $H_m$:
 \begin{equation} \left.\begin{array}{c@{}} {x_{{T}}} =- \dfrac{{{H_m}}}{{2\tan \beta }} - R - \dfrac{{l - R}}{{\sin \beta }},\\ {z_{{T}}} ={\pm} \left(-\dfrac{{{H_m}}}{2}\right). \end{array}\right\} \end{equation}
 Downstream of the triple point T, the TS will form a secondary RR or secondary MR interaction with the separation shock SS or the curved shock CS generated on the converging wall. The different secondary interaction types in the black box are enlarged in figure 6(b–d). Behind the MS, the shear layer-bounded supersonic jets travel downstream along the wall and collide near the stagnation point, forming a large counter-rotating vortex pair (CVP). Due to the impact of the CVP, the MS sometimes appears as an arch shape with a raised middle. Given the diversity and complexity of these secondary flow structures, this study focuses only on the primary shock structures, and the interactions between the TS and the SS or CS are ignored. To clarify the analysis, the MS and the TS are both assumed to be straight and do not experience any deformation. The TS is extended linearly to point  $\textrm {O}_2$ on the body contour. Then the geometric equation of the TS can be written as
 \begin{equation} z ={\pm} [-\tan {\theta _{{TS}}}( {x - {x_{{T}}}} ) + {z_{{T}}}], \end{equation}
where  $\theta _{{TS}}$ is the angle between the TS and the free stream direction, which can be expressed as the function of the free stream Mach number $M_0$ and the DS angle $\beta$ through the use of the shock relations and the three-shock theory (von Neumann Reference von Neumann1943, Reference von Neumann1945). At the same time, the triple point T is projected to point $\textrm {O}_1$ on the wall along the free stream direction. The coordinates of the points $\textrm {O}_1$ and $\textrm {O}_2$ can be solved by using the geometric equations (2.12)–(2.13) and (2.16).
With these simplifications, the shock structure of the primary MR configuration can be described graphically in the three-dimensional space, as shown in figure 7. In the illustration, the grey surface is the body contour (BC) of the VBLE. The green surface, red surface and purple surface positioned around the BC represent the detached shock wave DS, the Mach stem MS and the transmitted shock wave TS, respectively. The orange surface, referred to as the side surface, is parallel to the  $x$–
$x$– $y$ symmetry plane and the triple point T is located on it. The line DT is the intersection of the MS and the $x$–
$x$– $z$ symmetry plane and $\textrm {OO}_1$ is the line where the BC intersects the plane. The $\textrm {SS}_1$ and $\textrm {BB}_1$ represent sonic lines on the MS surface and the BC, respectively, and the blue area enclosed by them is defined as the sonic throat (ST). The colour of the surfaces and the labels of the points in the $x$–
$x$– $z$ symmetry plane are all consistent with those in figure 6. The origin of the coordinate is still positioned at the stagnation point O.

Figure 7. The simplified three-dimensional shock interaction configuration of the primary MR at the crotch.
Next, we will employ the simplified continuity method to the control volume encircled by the Mach stem MS, the body contour BC, the side surface, the sound throat ST and the two symmetry planes. It is assumed that the MS is hyperbolic both in the  $x$–
$x$– $y$ symmetry plane and the side surface. The geometrical equation of the MS in the $x$–
$x$– $y$ symmetry plane follows (2.1), while the equation describing its geometry in the side surface is expressed as
 \begin{equation} y = k\sqrt {{{[ {( {x - {x_{{O1}}}} ) - ({x_{{A1}}} - x{_{{O1}}})} ]}^2} - {{( {{x_{{T}}} - {x_{{A1}}}} )}^2}}. \end{equation}
 In the equation,  $x_{{O}1}$, $x_{{A}1}$ and $x_{{T}}$ are the $x$-coordinates of the points $\textrm {O}_1$, ${A}_1$ and the triple point T, respectively ( ${A}_1$ is the intersection of the MS asymptote and the $x$–
$x$– $z$ symmetry plane in the side surface and can be solved by applying the same method described in § 2.1.1). Based on the derivation presented above, one can determine the three-dimensional geometry of the shock waves with the MS height $H_m$ when the free stream parameters and the VBLE geometry are fixed. Similarly, to determine the height, the continuity relation is applied to the control volume. At this time, aside from the subsonic flow entering from the MS, the control volume is also receiving a supersonic jet entering via the side surface. It is assumed that both of these flows undergo isentropic acceleration or deceleration to reach the speed of sound within the control volume before exiting through the sonic throat ST. Given the unknown distributions of flow variables through both the ST and the side surface, the stagnation pressure is still used for the calculation. The average stagnation pressure of the flow through the MS is approximated by using the stagnation pressure PC behind it at $y_{{C}}=y_{{S}}/2$. The flow parameters through the side surface are estimated by the values in the $x$–
$x$– $z$ symmetry plane. By using $P_{DS}$ and $P_{TS}$ to denote the stagnation pressure behind the DS and the TS, the contraction ratio required to decelerate the flow in front of the side surface to sonic velocity can be approximated as follows:
 \begin{equation} {\sigma _{{{Side}}}} = {\sigma _{{{DS}}}}\frac{{{P_{{{DS}}}}}}{{{P_{{{TS}}}}}} \frac{{{d_{{{T1}}}}}}{l}, \end{equation}
where  $\sigma _{{DS}}$ is the contraction ratio required to decelerate the flow behind the DS to sonic velocity isentropically. When calculating $P_{{TS}}$, the shock angle of the TS is averaged by the value at the triple point T and the point $\textrm {O}_2$. Then the simplified continuity equation can be written as follows:
 \begin{equation} {A_{{{ST}}}} = \sigma {A_{{{MS}}}}\frac{{{P_0}}}{{{P_C}}} + {\sigma _{{{side}}}}{A_{{{Side}}}}, \end{equation}
where  $A_{{ST}}$, $A_{{MS}}$ and $A_{{Side}}$ represent the projected area of the ST, the MS and the side surface on the flow direction through them, respectively. The above process establishes the correlation between the MS height and specific free stream and geometric conditions. In the calculation, an initial value for the MS height is first assumed. Using this initial estimate, the three-dimensional interaction geometry can be calculated. Next, we assess whether the simplified continuity equation (2.19) is met. If not, the MS height value is adjusted, and the complete process outlined above is repeated until a converged value for $H_m$ is achieved.
The above process enables the determination of the triple point position. It is worth noting that while the process ignores the secondary interactions between the TS and the CS or CWs, solving for the CS is still essential when studying the transition between the primary MR and sRR. This is because the transition boundary is jointly determined by the position of the CS and the triple point. Given a linear decrease in Mach number along the stagnation line behind the DS, one can use theoretical estimates to determine the local temperature, velocity components and flow deflection angles  $\theta$ from the DS to the wall. This is possible as the inviscid flow behind the DS in the $x$–
$x$– $z$ symmetry plane is isentropic. With the flow variables behind the DS, the parameters associated with the CWs and the CS can be solved through an analytical, iterative method (Emanuel Reference Emanuel1982, Reference Emanuel1983). The detailed solving process has been outlined in Zhang et al. (Reference Zhang, Li and Yang2021), and the approach used in this paper is consistent with it. In the current study, the solved positions of the CS were only used for identifying the primary interaction type.
2.2. Numerical methods
This paper uses numerical simulations as a reference to support the theoretical results. The numerical simulations are carried out with a Reynolds-averaged Navier–Stokes solver based on the finite volume method. The inviscid flux is solved using Roe's flux differencing scheme (Roe Reference Roe1981). The viscous terms are discretized using the second-order upwind scheme. The turbulence is modelled using the one-equation Spalart–Allmaras model (Spalart & Allmaras Reference Spalart and Allmaras1992). The air is assumed to be a calorically perfect gas with a constant specific heat ratio  $\gamma$ of 1.4. The molecular viscosity of the gas is assumed to obey Sutherland's law. Figure 8(a) depicts a three-dimensional computational domain with boundary conditions including inflow, outflow and solid wall. The inflow boundary conditions adhere to the experiments conducted by Zhang et al. (Reference Zhang, Li and Yang2021), which encompass a free stream Mach number $M_0$ of 6, static pressure $p_0$ of 1247 Pa and static temperature $T_0$ of 122 K. At the outflow boundary, the static pressure was prescribed, and all other flow quantities were extrapolated from the interior. No-slip and isothermal conditions were applied on the solid wall with a fixed temperature of 300 K. The numerical approaches are consistent with the previous study of Zhang et al. (Reference Zhang, Li and Yang2021). In their work, the complex shock structures and vortical flows, such as the incident shock/turbulent boundary layer interaction and shock interactions on VBLEs, can be well captured at a free stream Mach number of 6. In this section, the convergence of the methods across a broader range of Mach numbers is verified.

Figure 8. (a) Computational domain and boundary conditions. (b) Grid near the crotch with a quarter of the domain removed.
Figure 8(b) depicts the grid distribution near the crotch with a quarter of the domain removed, where  $\xi$, $\zeta$ and $\psi$ refer to the numbers of grid points along the wall-normal, circumferential, and spilling directions around the crotch, respectively. The surface cell thickness yields a wall $y+$ of less than 1, and the grid size increases gradually away from the wall. The numerical solution was considered converged, when the stagnation point pressure and heat flux were kept less than $0.1\,\%$, along with the stability of continuity and velocity residuals. Given the intricate nature of the vortical flows at the crotch, the three-dimensional calculations in the present study do not use any assumed symmetric boundary.
A typical VBLE with  $\beta = 24^\circ$ and $R/r = 3$ (i.e. $R = 6$ mm) is used to study the grid resolution for a more accurate result. Three different grid scales are employed to analyse the influence, that is, coarse grid, fine grid and refined grid, as given in table 1. The surface cell thickness of the coarse, fine and refined grids was $1\times 10^{-6}~\textrm {m}$, $5\times 10^{-7}~\textrm {m}$ and
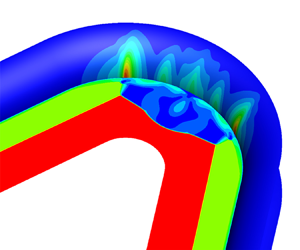
  $3\times 10^{-7}~\textrm {m}$, respectively. In figure 9, the Mach number contours at the crotch in the $x$–
$x$– $z$ symmetry plane are displayed for different free stream Mach numbers ( $M_0 = 6$ and 10) using two grid densities (the fine and refined grids). Although slight differences exist in terms of the flow details, the main flow structures in both grid densities are similar and well captured across the range of Mach numbers.
Table 1. Grid scales used in the grid resolution analysis.


Figure 9. The Mach number contours at the crotch in the  $x$–
$x$– $z$ symmetry plane using fine and refined grid densities: (a) $M_0=6$; (b) $M_0=10$.
Figure 10 compares the wall pressure distributions on the centreline ( $y = 0$) of the crotch for Mach numbers 6 and 10 obtained using the three grid scales. The picture displays excellent agreement between the pressure obtained from all three sets of grids for both Mach numbers. Furthermore, as an important parameter of the primary MR configuration, the MS heights $H_m$ in the symmetry plane obtained from the three different grid scales are presented in table 2. All variations in the percentages of $H_m$ are calculated with respect to the refined grid. There are negligible differences between the three different grid scales. In particular, the variations in the MS height $H_m$ between the fine and refined grids are all below $0.1\,\%$. This emphasizes that the fine grid is sufficiently accurate for the simulations and was used throughout the paper.

Figure 10. Wall pressure distribution on the centreline ( $y = 0$) of the crotch in the grid resolution analysis: (a) $M_0=6$; (b) $M_0=10$.
Table 2. The MS heights  $H_m$ in the symmetry plane in the grid resolution analysis.

The validity of the numerical simulations was assessed by comparing them with the experimental results reported by Zhang et al. (Reference Zhang, Li and Yang2021), as shown in figure 11. The schlieren images captured by the experiments are directly compared with the CFD results. It is observed that the numerical simulations accurately capture the shock waves in front of the crotch, pointing to the reliability of the numerical method employed in this study.

Figure 11. Comparison between the experimental results reported by Zhang et al. (Reference Zhang, Li and Yang2021) and the numerical simulations: (a)  $R/r = 1$; (b) $R/r = 3$; and (c) $R/r = 5$, at $M_0 = 6$ and $\beta = 24^\circ$.
3. Results and discussion
In this section, the shock structures of the primary MR generated on VBLEs will be studied using the theoretical and numerical methods presented in § 2.2. Based on the theoretically predicted position of the shock configurations, the transition boundary between the primary MR and sRR is then provided.
3.1. Overall configuration
Figure 12 displays the theoretical shock configurations and the numerical Mach number contours under the conditions  $M_0 = 6$ and $\beta = 24^\circ$. Good agreement is observed between the theory and CFD results for different values of the ratio $R/r$. In figure 12(a), the flow structure corresponding to $R/r = 1$ is illustrated. In this example, the transmitted shocks $TSs$ emanating from the triple points impinge on the wall and induce local boundary layer separation. As a result, there is no CS generated from the elbow. It is worth noting that while there is a slight discrepancy in the position of the triple point between the theory and numerical calculation, the theoretical MS height closely aligns with the CFD results. As such, it is apparent that the disparity in the triple point position can primarily be attributed to the deviation in the standoff distance of the DS. Figure 12(b) depicts the flow structure corresponding to ratio $R/r = 3$. Along with the disappearance of the separation, the curved shock CS generates along the converging wall and forms a secondary MR with the transmitted shock TS. The collision of the supersonic jets from the TS and CS at the stagnation point of the crotch result in the formation of the CVP behind the MS. The middle part of the MS curves upstream due to the impact of the CVP. Although these secondary interaction configurations cannot be predicted by the theoretical method, the position of the triple point T and the CS can both be accurately captured. As the ratio $R/r$ further increases to 4, the secondary MR gradually transition into secondary RR configuration, as demonstrated in figure 12(c). One can determine the location of the interaction point by solving the intersection between the TS and the CS. Under this condition, the secondary interaction point $\textrm {IP}_2$ is far from the triple point T of the primary MR configuration. If $R/r$ continues to increase, $\textrm {IP}_2$ will approach the triple point, thereby transforming the primary shock structure into an sRR. In general, though the details of the flow cannot be obtained, the overall configurations are well predicted by the theoretical method for different situations.

Figure 12. Comparison of the theoretical shock configurations with the numerical Mach number contours: (a)  $R/r = 1$; (b) $R/r = 3$; and (c) $R/r = 4$, at $M_0 = 6$ and $\beta = 24^\circ$.
Furthermore, the shock angles of the DS, as observed in figure 12, are almost identical to the half-span angle  $\beta = 24^\circ$ of the straight branch. This value is below the minimum angle of the incident shock needed for the existence of MR determined by the von Neumann criterion, which is approximately $29^\circ$ at $M_0 = 6$. This indicates that the reflection types are inverse MRs, in which the SL is deflected upwards at the triple point (Ben-Dor Reference Ben-Dor2007). In steady, two-dimensional oblique shock MRs, an inverse MR cannot occur due to the requirement of forming the sonic throat via the compression of the SL and the reflecting surface. However, based on the theoretical model presented in this paper, it is apparent that in the three-dimensional shock MRs on VBLEs, the sonic throat is formed between the MS and the wall surface. This explains why the occurrence of the inverse MRs depicted in figure 12 is not restricted by the von Neumann criterion.
Table 3 presents a comparison of the non-dimensional standoff distances of the DS at the triple point and the triple point positions for various free stream Mach numbers and geometric parameters between the experimental results of Zhang et al. (Reference Zhang, Li and Yang2021), the numerical simulations and the theoretical predictions presented in this study. Overall, the theoretical prediction is in good agreement with the experimental and numerical results within a diverse array of parameters. Depending on the conditions, the theoretical predictions for the triple point positions can be either larger or smaller than the experimental and numerical results while the numerical calculations are consistently slightly smaller than the experimental measurements. This may be attributed to the assumptions used in the current model, such as the neglect of the boundary layer and the secondary interactions of the TS, as well as the uncertainty of the experiments and the numerical code used. Moreover, an inspection of the table indicates that for the same  $M_0$ and $\beta$ values, the numerical calculated standoff distance $l$ slightly grows with the increase of the ratio $R/r$ (in cases 1, 3 and 4). This is because, under this condition, the vertical compression is not strong enough for the DS to attain a fully developed state over a limited length of the straight branch. In other words, the DS is still in the developmental stage. As the $R/r$ increases, the triple point shifts downstream relative to the elbow (as observed in figure 12), and the DS gradually moves towards a fully developed state.
Table 3. Normalized standoff distances of the DS and positions of the triple point for various conditions.

Based on the findings from figure 12 and table 3, the position of the triple point is observed to be sensitive to the free stream condition and geometric parameters, particularly the  $R/r$ ratio. The theoretical model developed in this study can accurately predict this value across a broad range of conditions and situations. Consequently, this theoretical model can be relied upon to study the three-dimensional shock MRs on VBLEs.
3.2. Parametric analysis
This subsection provides a parametric analysis of the MR configuration in a parameter space of the ratio  $R/r$ (§ 3.2.1), the half-span angle $\beta$ (§ 3.2.2) and the free stream Mach number $M_0$ (§ 3.2.3), utilizing both theoretical methods and numerical simulations.
3.2.1. The ratio  $R/r$
$R/r$

Figure 13 shows the theoretical results for the geometric variations of the shock configuration at  $M_0 = 6$ and $\beta = 24^\circ$, alongside the experimental results of Zhang et al. (Reference Zhang, Li and Yang2021) and the numerical results. The MS height $H_m$ and the triple point position $d$ are displayed as a function of the ratio $R/r$ in figure 13(a,b), respectively. To represent the relative position of the triple point T and the elbow, the horizontal distance between T and the elbow is defined as the relative position $d_1$ and displayed in figure 13(c). This value of $d_1$ is crucial to the transition of primary MR and sRR. When T is upstream of the elbow, $d_1$ is negative, and when T is downstream, $d_1$ is positive. The Mach number contours corresponding to $R/r=1$, 3 and 4 have been provided in figure 12. It can be observed that as the $R/r$ ratio increases, the MS height increases quite rapidly while $d$ decreases before experiencing a slight increase. Meanwhile, $d_1$ continues to increase, which indicates that the triple point consistently shifts downstream relative to the elbow throughout the increase in $R/r$. This phenomenon makes it easier for the CS to intersect the DS, resulting in a considerable impact on the transition from the primary MR to sRR.

Figure 13. Normalized theoretical results, experimental measurements of Zhang et al. (Reference Zhang, Li and Yang2021) and numerical simulations for ratio  $R/r$ ranging from 1 to 5 at $M_0 = 6$ and $\beta = 24^\circ$: (a) the MS height $H_m$; (b) the triple point position $d$; and (c) the relative position $d_1$ of the triple point T and the elbow.
In figure 13, the geometric variations of the shock configurations are accurately captured by the theoretical model. Actually, the trend is not hard to comprehend. When the  $R/r$ ratio is small, the gap between the two DSs is minimal. Inflow through the side surface constitutes a substantial proportion of the flow, resulting in an upstream movement of the MS. With the growth of $R/r$, the distance between the DSs widens, leading to reduced influence of the flow through the side surface and a downstream movement of the MS. Moreover, as $R/r$ increases, the distance between the DSs at a given $x$-coordinate increases linearly. As a result, since the variation of the triple point position with the ratio $R/r$ is relatively small, the increase in MS height $H_m$ is nearly linear, as demonstrated in figure 13(a). At the same time, $d_1$ generally inclines more slowly as the triple point approaches the surface (otherwise the flow through the side surface may be choked), as shown in figure 13(c). The variation of $d$ can be explained by the geometry of the crotch. For the arc surface, $d$ can be expressed as a function of $R$ and $d_1$ as follows:
 \begin{equation} d = R( {1 - \sin \beta } ) - {d_1}. \end{equation}
 When half-span angle  $\beta$ is fixed, the first term of (3.1) is proportional to $R$. Therefore, when the increase rate of $d_1$ is sufficiently low, $d$ may increase proportionally with the increases of the $R/r$ ratio, as demonstrated in figure 13(c). Furthermore, for smaller $R/r$ ratios, the MS height predicted by the theoretical method is closer to the CFD results, however, the deviations in the triple point positions $d$ and $d_1$ are larger. This is attributed to the fact that the DS has not reached its fully developed state, as discussed in the previous section. As the $R/r$ ratio increases, the triple point moves downstream resulting in a decrease in the deviation. The discrepancy also decreases as the free stream Mach number and half-span angle increase.
Figure 14 further compares the theoretical results with the experimental results of Zhang et al. (Reference Zhang, Li and Yang2021) and the numerical results at  $M_0 = 6$ and $\beta = 40^\circ$. The corresponding theoretical shock configurations and numerical Mach number contours are displayed in figure 15(a–c) ( $R/r=1$, 3 and 5). It is apparent that in this case, the increase in MS height $H_m$ continues to exhibit an almost linear trend. However, the difference lies in the fact that the triple point position $d$ shows a monotonically decreasing trend. It is worth mentioning that there is a point E on these curves, across which the trend changes slightly. Point E aligns with the moment when the transmitted shock TS collides with the junction of the straight branch and the crotch. To the left of this kink point, the TS hits the straight branch, as depicted in figure 15(a), where $R/r = 1$. Consequently, at this condition, no CS is generated, albeit the separation induced by the TS is less severe compared with that of $\beta = 24^\circ$ (figure 12a). The weaker separation is probably due to the reduction in the flow velocity behind the DS and the shock intensity of the TS, as well as the lack of the pressure gradient caused by the convergence surface of the crotch. In addition, the numerical simulation of this condition reveals an evident asymmetrical MR configuration in the flow field. The phenomenon has been attributed to the instabilities of the SL and the supersonic jet by Xiao et al. (Reference Xiao, Li, Zhang, Zhu and Yang2018). The asymmetric configuration arising from the symmetric leading edge implies the potential for a dual solution, which is of relevance to the initial flow conditions. By adjusting the boundary conditions, Xiao et al. (Reference Xiao, Li, Zhang, Zhu and Yang2018) were able to obtain a mirror-symmetrical solution in addition to the original one. This asymmetry can also be responsible to some degree for the discrepancy between the theoretical predictions and numerical results.

Figure 14. Normalized theoretical results, experimental measurements of Zhang et al. (Reference Zhang, Li and Yang2021) and numerical simulations for ratio  $R/r$ ranging from 1 to 5 at $M_0 = 6$ and $\beta = 40^\circ$: (a) the MS height $H_m$; (b) the triple point position $d$; and (c) the relative position $d_1$ of the triple point T and the elbow.

Figure 15. The theoretical predicted shock configurations and the numerical Mach number contours at  $M_0 = 6$ and $\beta = 40^\circ$: (a) $R/r = 1$; (b) $R/r = 3$; and (c) $R/r = 5$.
As the  $R/r$ ratio increases, the point where the TS intersects the wall will shift downstream and cross over the elbow. For $R/r=3$, where the TS collides with the crotch, a sequence of CWs emerge from the elbow, as shown in figure 15(b). To represent these CWs more clearly, contour lines have been made denser in the enlarged view. It is observed that these CWs intersect with the TS before merging into a CS due to the decrease in the flow Mach number behind the DS caused by the large half-span angle $\beta$. Hence, the point where the first CW intersects with the TS is defined as the interaction point $\textrm {IP}_2$. The coalescence of $\textrm {IP}_2$ and the triple point is considered the symbol of the transition from the primary MR to sRR. Moreover, as a result of the decrease in the flow Mach number behind the DS, the bulge in the middle of the MS shrinks. Under this condition, the triple point predicted by the theory deviated to the downstream significantly compared with the numerical simulation. This discrepancy will lead to an earlier transition from the primary MR to sRR. At $R/r = 5$, as illustrated in figure 15(c), the theoretically predicted configuration has transitioned to an sRR, whereas the numerical result remains an MR. The earlier transition is also partly due to the deviation of the CWs, which could be attributed to the boundary layer effects near the wall.
From the above analysis, it can be inferred that the transition from primary MR to sRR can be triggered by the  $R/r$ ratio through its impact on the relative position between the triple point and the elbow, as well as the shape of the CS or CWs. The position of the triple point is mainly determined by the flow proportion through the side surface, which closely depends on the geometry.
3.2.2. The half-span angle $\beta$

The geometric variations of the shock structures for half-span angle  $\beta$ ranging from $24^\circ$ to $48^\circ$ at $M_0 = 6$ and $R/r = 3$ are depicted in figure 16. The shock configurations and numerical Mach number contours corresponding to $\beta =28^\circ$, $\beta =36^\circ$ and $\beta =44^\circ$ are provided in figure 17. It is apparent that under these circumstances, the MS height and the triple point position are not significantly affected by $\beta$. This is consistent with the experimental results of Zhang et al. (Reference Zhang, Li and Yang2021) for $R/r = 1$. According to (2.18), the phenomenon may be attributed to the simultaneous reduction of the standoff distance $l$ of the DS and the flow Mach number behind it accompanied by the increase of $\beta$. The former results in the reduction of the area for the flow behind the DS to pass through, and the latter leads to the increase of the contraction ratio required to decelerate the flow to sonic velocity isentropically.

Figure 16. Normalized theoretical results and numerical simulations for half-span angle  $\beta$ ranging from $24^\circ$ to $48^\circ$ at $M_0 = 6$ and $R/r = 3$: (a) the MS height $H_m$; (b) the triple point position $d$; and (c) the relative position $d_1$ of the triple point T and the elbow.

Figure 17. The theoretical predicted shock configurations and the numerical Mach number contours at  $M_0 = 6$ and $R/r = 3$: (a) $\beta = 28^\circ$; (b) $\beta = 36^\circ$; and (c) $\beta = 44^\circ$.
It is worth noting that the function of the MS height  $H_m$ with respect to $\beta$ shows an S-shape in figure 16(a). Since the triple point position $d$ is almost independent of the angle (figure 16b), the fluctuations in MS height are primarily attributed to variations in the shock angles and positions of DSs in the $x$–
$x$– $z$ symmetry plane. On one hand, the reduction in the standoff distance $l$ indicates that the DS is shifting towards the straight branch and, as a result, the distance between the two DSs widens. The shift becomes less notable when $\beta$ becomes larger, as illustrated by figure 5(b) in § 2.1.1. On the other hand, as the $\beta$ angle increases, the effect of the change in the DS angle on the increase of MS height becomes more significant, which is determined by the triangular relationship. Therefore, the MS height increases more quickly at smaller and larger $\beta$ angles, while the increase rate is slower in the middle range of $\beta$. From figure 16(c), it is observed that the relative position $d_1$ of the triple point T and the elbow showed a decreasing trend. Since the triple point position $d$ remains almost constant, the reduction in $d_1$ is primarily a result of the shift in elbow position, which moves downstream as $\beta$ increases. The decrease of $d_1$ hinders the transition from the primary MR to sRR. However, the decrease of the standoff distance $l$ and the change of the shape of the CS and CWs caused by the reduction of the flow Mach number behind the DS will facilitate the transition. Indeed, during the process of increasing $\beta$, the transition between the primary MR and sRR is non-monotonic, which will be discussed in § 3.3.
In the Mach number contours shown in figure 17, the shock configurations corresponding to different half-span angles are basically consistent. In figure 17(a), the CWs generated from the curved wall converge into a CS and the CS intersects the TS. In figures 17(b) and 17(c), these CWs intersect with the TS before they coalesce into a CS. The secondary interaction configurations between the TS and the CS or CWs are all RRs. Nonetheless, despite a minimal change in shock configuration, the bulge in the middle of the MS became considerably smaller with increasing  $\beta$. As mentioned above, the deformation of the MS is induced by the CVP generated by the supersonic jets moving downstream along the wall and colliding near the stagnation point. As the flow Mach number behind the DS decreases, the velocity of the supersonic jets also diminishes, leading to a reduction in the accumulation effects caused by these supersonic jets.
Generally, the half-span angle  $\beta$ has two main effects on the transition from the primary MR to sRR: firstly, it impacts the shapes of the CS and CWs by altering the inflow conditions in front of them; secondly, it impacts the relative position of the elbow and triple point T. The two effects oppose one another as $\beta$ increases. The former promotes the transition from MR to sRR, while the latter hinders the occurrence of the transition.
3.2.3. The free stream Mach number $M_0$

In addition to demonstrating the impact of the geometric parameters on the shock interaction structure, the theoretical model presented in this study can also precisely predict the influence of the incoming flow conditions on the interaction. As shown in figure 18, the height of the MS and the position of the triple point for a VBLE configuration with a ratio  $R/r = 3$ and a half-span angle $\beta = 24^\circ$ under varying free stream Mach numbers are plotted. The theoretical predictions agree well with the numerical simulations within the free stream Mach number range of 6 to 10. The shock configuration corresponding to $M_0 = 6$, 8 and 10 are provided in figure 19(a–c), respectively. As the free stream Mach number increases, the secondary interaction between the TS and the CS experiences the transition from MR to RR, while the primary configuration remains MR. When the secondary interaction is an RR, the distance between the triple point T and the secondary interaction point $\textrm {IP}_2$ reduces. It appears that transition from the primary MR to sRR can occur with smaller $R/r$ ratios at higher free stream Mach numbers.

Figure 18. Normalized theoretical results and numerical simulations for free stream Mach number  $M_0$ ranging from 6 to 10 at $R/r = 3$ and $\beta = 24^\circ$: (a) the MS height $H_m$; (b) the triple point position $d$; and (c) the relative position $d_1$ of the triple point T and the elbow.

Figure 19. The theoretical predicted shock configurations and the numerical Mach number contours  $R/r = 3$ and $\beta = 24^\circ$: (a) $M_0 = 6$, (b) $M_0 = 8$; and (c) $M_0 = 10$.
According to figures 18(a) and 18(b), throughout the process of increasing the free stream Mach number, the MS grows and the triple point moves downstream. Since the geometry is fixed, this suggests that the spacing between the shock wave and the wall in the  $x$–
$x$– $z$ symmetry plane decreases. This is mainly because the isentropic contraction ratio $\sigma$ of the flow becomes smaller at higher Mach numbers. The change in MS height is primarily a result of the decrease in the standoff distance $l$, which is determined by the increase in the vertical Mach number component $M_0\sin {\beta }$. Although the downstream movement of the triple point generates an opposing impact, which lowers the MS to some extent, it appears to not fully offset the effect of the variation in $l$.
$l$.
The change in free stream Mach number also imposes dual effects on the primary MR and sRR transition by affecting both the relative position  $d_1$ and the shape of the CS and CWs. Firstly, an increase in the relative position $d_1$ (figure 18c) facilitates the transition. Secondly, an increase in the Mach number behind the DS causes a reduction in the angle of the CS or CWs and hinders the transition. Overall, it appears that an increase in Mach number makes it easier for the transition from the primary MR to sRR.
3.3. Transition of the primary MR and sRR
As shown by the comparison results in §§ 3.1 and 3.2, the theoretical model is able to accurately predict the MR configuration across a broad range of flow and geometric parameters. Utilizing this, the theoretically predicted position of the triple point and the CS (or the CWs) can be employed to determine the transition boundary between the primary MR and sRR. In this section, we first theoretically calculate the transition boundary at a free stream Mach number of 6 and compare the results with those obtained from numerical simulations. Subsequently, the theoretically predicted transition boundaries under different free stream Mach numbers are presented.
Figure 20 displays a comparison of the theoretical transition criterion with the current numerical results and those of Zhang et al. (Reference Zhang, Li and Yang2021) at  $M_0 = 6$ in the ( $R/r$, $\beta$) plane. The black solid line is the theoretical predicted transition boundary of the primary MR and sRR. The red dashed line is the transition criterion fitted by Zhang et al. (Reference Zhang, Li and Yang2021) using the numerical standoff distances and triple point positions. Their study also provides the transition criteria between RR and MR, which is, however, beyond the scope of this paper. Since the numerical calculations conducted in their study were limited to the range of $\beta$ between $16^\circ$ and $48^\circ$ (indicated by the circles), the transition criterion is solely applicable within this range and cannot be predicted for larger $\beta$ values. To further showcase the reliability of the theoretical method, we additionally predict the transition boundary for larger $\beta$ values of $52^\circ$ and $56^\circ$ while conducting numerical calculations (indicated by the boxes). Although there is some deviation, the theoretical transition boundary is in good agreement with the numerical results. Overall, for $\beta$ values ranging from $24^\circ$ to $56^\circ$, the theoretical predicted transition boundary is slightly lower than that obtained through numerical simulations. As deduced in § 3.2, this can primarily be attributed to the downstream deviation of the theoretical triple point position from the numerical calculations. Specifically, for small $\beta$ angles ( $\beta = 16^\circ$ and $20^\circ$), the predicted transition boundary is higher than the numerical results due to the errors in standoff distances.

Figure 20. Theoretical transition boundary of the primary MR and sRR with numerical simulations in the ( $R/r$, $\beta$) plane at $M_0 = 6$.
Furthermore, it is worth noting that the theoretical prediction of the transition boundary demonstrates a trend of first decreasing and then increasing with the increase of  $\beta$, whereas the fitting results exhibit a monotonic decline. Based on the current numerical results at $\beta = 52^\circ$ and $56^\circ$, it is evident that the prediction of the trend by the theory is correct, despite some slight inaccuracies. This may be attributed to Zhang et al. (Reference Zhang, Li and Yang2021) disregarding the impact of $\beta$ on the triple point position during the fitting process. According to this trend, there must exist a minimum point on the transition boundary where the $R/r$ ratio equals $R_m/r$. If the $R/r$ ratio is lower than $R_m/r$, the primary MR cannot transition to sRR, no matter the value of $\beta$ angle. In other words, a sRR configuration does not exist for $R/r < R_m/r$. Conversely, when the ratio $R/r$ is higher than $R_m/r$, the interaction configuration may transition from the primary MR to sRR and then back to the primary MR with the increase of $\beta$. The pressure contours shown in figure 21 illustrate such a transition process. In figure 21(a–c), the ratio $R/r$ is fixed at 5.5 and $\beta$ angles are set to $16^\circ$, $40^\circ$ and $56^\circ$, respectively. In figure 21(a), it is observed that the CWs generated from the crotch coalesce into a CS. The CS intersects transmitted shock TS downstream of the triple point T at $\textrm {IP}_2$. Therefore, the flow configuration is an MR, although the secondary interaction point $\textrm {IP}_2$ is close to the triple point. As $\beta$ increases to $40^\circ$, shown in figure 21(b), the CWs intersect the DS directly at point $\textrm {IP}_3$ before the formation of the CS. Downstream of $\textrm {IP}_3$, the DS gradually deflects inward due to the gradual interference from the CWs, forming a curved detached shock (CDS), which transforms into a BS at the kink point, generating a weak TS and an SL. Thus, the interaction configuration has successfully transitioned from the primary MR to sRR. Remarkably, as $\beta$ is further increased to $56^\circ$, the interaction configuration transitions back to the primary MR due to the downstream shift of the elbow, as illustrated in figure 21(c). The MR–sRR–MR transition process depicted in figure 21 provides further evidence for the validity of the theoretical model.

Figure 21. Variations of shock interaction configurations with half-span angle  $\beta$ at $M_0 = 6$ and $R/r = 5.5$: (a) the primary MR, $\beta = 16^\circ$; (b) sRR, $\beta = 40^\circ$; and (c) the primary MR, $\beta = 56^\circ$.
Figure 22 shows the primary MR and sRR transition boundary depending on the ratio  $R/r$ and the half-span angle $\beta$ for free stream Mach number $M_0$ ranging from 6 to 10 based on the present prediction. It is evident that the ratio $R/r$ required for the transition from MR to sRR decreases at higher free stream Mach numbers. Across the varying $M_0$, the $R/r$ values corresponding to the transition boundary exhibit a consistent trend of initially decreasing and then increasing with an increase in $\beta$. The minimum point on every transition line gradually shifts towards smaller $\beta$ and $R/r$ values with the increase of $M_0$.

Figure 22. Theoretical transition boundary of the primary MR and sRR in the ( $R/r$, $\beta$) plane for different free stream Mach numbers.
Indeed, thanks to the adaptability of the continuity method, the theoretical model can also be applied to predict the transition boundaries of VBLEs with more intricate configurations, like non-uniform bluntness (Wang, Li & Yang Reference Wang, Li and Yang2021), various conic crotches (Wang et al. Reference Wang, Li, Zhang and Yang2020) and elliptical cross-sections (Zhang, Wang & Li Reference Zhang, Wang and Li2022). The predicted transition boundaries can offer valuable insight for designing VBLEs, especially considering the substantial decline in pressure/heating load during the transition (Xiao et al. Reference Xiao, Li, Zhang, Zhu and Yang2018; Li et al. Reference Li, Zhang, Wang and Yang2019).
4. Conclusion
The primary MR configuration of three-dimensional curved shock waves generated on VBLEs is investigated theoretically and numerically. An innovative theoretical model is formulated for this configuration. When considering the straight branch, the flow perpendicular to the straight branch is treated as a two-dimensional supersonic flow around a cylinder and a simplified continuity method is applied to calculate the position of the DS. When considering the shock interaction at the crotch, the continuity method is extended to three-dimensional flow and utilized to predict the interaction structure of the primary MR. By assuming that the shape of the MS is hyperbolic, a three-dimensional control volume surrounded by the MS, the side surface and the ST is established. The control volume is analysed using a simplified form of the continuity equation, allowing for the prediction of the height of the MS and the position of the triple point. The theoretical model reveals the mechanism behind the occurrence of inverse MRs on VBLEs, wherein a sonic throat ST can form between the MS and the wall surface without the compression of the SLs.
The reliability of the theoretical model is proved by the good agreement between the theoretical predicted triple point positions and the current numerical results, as well as previous experimental results. By using the theoretical model and numerical simulations, the impact of the ratio  $R/r$, the half-span angle $\beta$ and the free stream Mach number $M_0$ on the primary MR configurations and the MR to sRR transition is examined. It appears that the increase of $R/r$ and $M_0$ promotes the transition from the primary MR to sRR, while the effect of $\beta$ is non-monotonic.
Based on the predicted shock positions of the configuration, the transition boundary between the primary MR and sRR is derived. At a free stream Mach number of 6, the theoretical approach accurately predicts the trend of the transition boundary with verification from numerical results. Under a fixed  $M_0$, it is observed that if the $R/r$ ratio is below a certain threshold $R_m/r$, the transition from the MR to sRR cannot occur, despite the value of the half-span angle $\beta$. When $R/r$ exceeds the threshold, the interaction configuration can transition from the primary MR to sRR and then back to the primary MR upon an increase in $\beta$. The transition process has been demonstrated through a series of numerical simulations with an $R/r$ ratio of 5.5 at $M_0 = 6$.
Funding
We would like to acknowledge the support of the National Natural Science Foundation of China (NSFC, grant numbers U20A2069, U21B6003 and 12202372), the Natural Science Foundation of Fujian Province, China (2023J01046) and project 1912.
Declaration of interests
The authors report no conflict of interest.


