1. Introduction
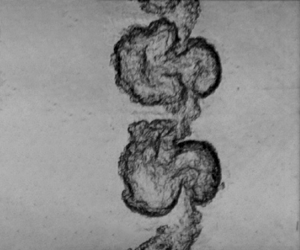
Richtmyer–Meshkov instability (RMI) occurs at a perturbed density interface subjected to an impulsive acceleration, typically induced by a shock wave (Richtmyer Reference Richtmyer1960; Meshkov Reference Meshkov1969). Generally, the growth of perturbations at the interface initially enters a linear period and then a nonlinear period, characterized by large-scale interpenetrating finger structures of bubbles (light fluids protruding into heavy ones) and spikes (heavy fluids protruding into light ones). At late times, transition might be achieved, leading to a turbulent flow. The RMI is closely related to the well-known Rayleigh–Taylor instability (RTI) (Rayleigh Reference Rayleigh1883; Taylor Reference Taylor1950), a phenomenon that occurs when light fluids continually accelerate heavy fluids. Thus RMI can be regarded as the impulsive counterpart of RTI. In past decades, RMI has received extensive attention due to its essential role in basic science research and engineering applications, such as supernova explosions (Kuranz et al. Reference Kuranz, Park, Huntington, Miles, Remington, Plewa, Trantham, Robey, Shvarts and Shimony2018), scram-jet engines (Urzay Reference Urzay2018) and inertial confinement fusion (ICF) (Betti & Hurricane Reference Betti and Hurricane2016). In RMI, the interpenetration of fingers causes pronounced deformation of the developing interface, driving perturbation growth and mixing (Sadler et al. Reference Sadler, Powell, Schalles, Louie, Jacobs and Zhou2024). In particular, in ICF, bubbles distort the ablation front while spikes introduce the cold fuel into the hotspot, giving rise to mixing between the outer ablator and inner fuels (Cheng et al. Reference Cheng, Kwan, Wang, Merrill, Cerjan and Batha2015; Clark et al. Reference Clark2017; Mikaelian & Olson Reference Mikaelian and Olson2020). This diminishes the purity of fusion fuel, resulting in a reduction or even elimination of the thermonuclear yield (Lindl et al. Reference Lindl, Landen, Edwards, Moses and Team2014; Pak et al. Reference Pak, Divol, Weber, Hopkins, Clark, Dewald, Fittinghoff, Geppert-Kleinrath, Hohenberger and Pape2020). Most previous studies, involving theoretical modelling (Goncharov Reference Goncharov2002; Zhang & Guo Reference Zhang and Guo2016, Reference Zhang and Guo2022; Liu, Zhang & Xiao Reference Liu, Zhang and Xiao2023), experiments (Sadot et al. Reference Sadot, Erez, Alon, Oron, Levin, Erez, Ben-Dor and Shvarts1998; Collins & Jacobs Reference Collins and Jacobs2002; Mariani et al. Reference Mariani, Vanderboomgaerde, Jourdan, Souffland and Houas2008; Mansoor et al. Reference Mansoor, Dalton, Martinez, Desjardins, Charonko and Prestridge2020) and numerical simulations (Dimonte & Ramaprabhu Reference Dimonte and Ramaprabhu2010; Buttler et al. Reference Buttler2012; Bai, Deng & Jiang Reference Bai, Deng and Jiang2018; Probyn et al. Reference Probyn, Thornber, Williams, Drikakis and Youngs2021), have focused on finger development in RMI at a single interface (Zhou Reference Zhou2017a,Reference Zhoub; Zhou et al. Reference Zhou, Clark, Clark, Glendinning, Skinner, Huntington, Hurricane, Dimits and Remington2019, Reference Zhou2021). Nevertheless, RMI often occurs at finite-thickness fluid layers (Liang & Luo Reference Liang and Luo2023b), such as those in ICF capsules and supernovae. In these scenarios, the evolving fingers at adjacent interfaces might contact, leading to finger collisions. These collisions can hinder finger development, contributing to the suppression of perturbation growth in ICF. As a result, it is of significance to investigate the finger collisions at a finite-thickness fluid layer.
Studies on the instability development of fluid layers have been carried out extensively. Theoretically, Taylor (Reference Taylor1950) was the first to explore fluid-layer perturbation growth in RTI. It was found that the coupling effect between the two interfaces becomes pronounced when the layer thickness is below one-third of the wavelength. Mikaelian (Reference Mikaelian1995, Reference Mikaelian1996) extended the study to fluid layers in RMI. By defining a coupling angle to characterize the interface coupling strength, Mikaelian (Reference Mikaelian1995, Reference Mikaelian1996) proposed a model to describe the linear growth rates of both interfaces. Jacobs et al. (Reference Jacobs, Jenkins, Klein and Benjamin1995) established an alternative linear model for predicting the layer perturbation growth by solving velocity potential functions. Recently, the model of Jacobs et al. (Reference Jacobs, Jenkins, Klein and Benjamin1995) has been extended to a fluid layer separating three different fluids (Liang & Luo Reference Liang and Luo2022a). These theories have shown strong capabilities in describing the amplitude growth of fluid layers prior to the collision of the two interfaces (Zhou Reference Zhou2017a,Reference Zhoub; Liang & Luo Reference Liang and Luo2023b).
The first gas-layer experiment was conducted by Jacobs et al. (Reference Jacobs, Klein, Jenkins and Benjamin1993), who created a vertically flowing curtain of SF$_6$ in a horizontal shock tube. Later, Balakumar et al. (Reference Balakumar, Orlicz, Tomkins and Prestridge2008a,Reference Balakumar, Orlicz, Tomkins and Prestridgeb) enhanced the membraneless interface formation technique of Jacobs et al. (Reference Jacobs, Klein, Jenkins and Benjamin1993) and generated a perturbed heavy gas layer with improved repeatability. Using this layer type, studies have explored the dependence of late-time mixing on incident Mach numbers and initial shapes (Orlicz et al. Reference Orlicz, Balakumar, Tomkins and Prestridge2009, Reference Orlicz, Balasubramanian, Vorobieff and Prestridge2015; Balasubramanian, Orlicz & Prestridge Reference Balasubramanian, Orlicz and Prestridge2013; Orlicz, Balasubramanian & Prestridge Reference Orlicz, Balasubramanian and Prestridge2013), while finger collisions have received limited attention. Recently, a membraneless gas layer with a flat interface on top and a single-mode interface below was generated in a vertical shock tube using two different combinations of three gases: air over CO$_2$ over SF$_6$, and helium over air over SF$_6$ (Schalles et al. Reference Schalles, Louie, Peabody, Sadler, Zhou and Jacobs2024). It was shown that the existence of the upper, initially flat interface reduces the nonlinear amplitude growth compared with an equivalent single interface configuration. However, this flat interface configuration is unfavourable for studying finger collisions.
The soap-film technique (Liu et al. Reference Liu, Liang, Ding, Liu and Luo2018; Li et al. Reference Li, Cao, Wang, Zhai and Luo2023) has been used to generate fluid layers. This interface formation technique provides a suitable experimental condition for studying finger collisions, since it ensures the controllability of initial layer configurations, including interface amplitudes and phases, and layer thicknesses, as well as density combinations. Using the soap-film technique, Liang & Luo (Reference Liang and Luo2021, Reference Liang and Luo2022a,Reference Liang and Luob, Reference Liang and Luo2023a) formed various fluid layers, and examined the influence of interface coupling and reverberating waves on the amplitude growth of both perturbations. These studies have focused primarily on the regime before the two interfaces contact, while the instability development after finger collisions remains unclear, motivating the current work.
Previous shock-tube studies (Liang & Luo Reference Liang and Luo2023b) have demonstrated that under the impact of a single shock, the fingers of the layer evolve slowly so that the collisions between fingers are not significant. In this work, a reshock that propagates in the opposite direction to the incident shock is considered. The reshock would inject energy into the developing interface, accelerating the evolution of fingers and thus intensifying their collisions. Additionally, after the reshock impact, the interface's velocity would be significantly reduced (Brouillette & Sturtevant Reference Brouillette and Sturtevant1993), causing the mixing layer to almost evolve at a fixed position. This is advantageous for the observation of finger collisions in shock-tube experiments. Note that reshock is common in practical situations (Zhou Reference Zhou2017a,Reference Zhoub), such as in ICF, where reshock is generated due to the reflection of the incident shock after reaching the capsule centre (Lindl et al. Reference Lindl, Landen, Edwards, Moses and Team2014). The reshock would return to impact the developing material layer, markedly influencing the finger development (Balakumar et al. Reference Balakumar, Orlicz, Tomkins and Prestridge2008b; Balasubramanian et al. Reference Balasubramanian, Orlicz, Prestridge and Balakumar2012; Mohaghar et al. Reference Mohaghar, Carter, Musci, Reilly, McFarland and Ranjan2017, Reference Mohaghar, Carter, Pathikonda and Ranjan2019). Thus exploring finger collisions under reshock conditions is also significant.
In this work, shock-tube experiments are conducted to study finger collisions in a light fluid layer under reshock conditions. The light fluid layer is closely associated with double-shell ICF implosion, wherein a lower-density foam is employed as the cushion between the higher-density outer and inner shells (Montgomery et al. Reference Montgomery2018). Unlike other layer types where wave-induced Rayleigh–Taylor effects are evident (Liang & Luo Reference Liang and Luo2021, Reference Liang and Luo2022a, Reference Liang and Luo2023a), the light layer case involves only RMI before reshock (Liang & Luo Reference Liang and Luo2022b), thereby eliminating the potential impact of Rayleigh–Taylor effects on finger collisions after reshock. The soap-film technique is utilized to generate the SF$_6$/air/SF$_6$ light layers. The research content of this paper is outlined as follows. First, to understand the wave dynamics and interface motions during finger collisions, unperturbed light layer experiments and one-dimensional (1-D) theoretical analyses are performed. Then eight distinct perturbed layer cases, with four thicknesses and two interface phase combinations, are examined to explore the finger collision mechanism as well as the dependence of collisions on initial conditions. Finally, linear and nonlinear models are developed to quantify the perturbation growth for both interfaces before and after collisions.
2. Experimental set-up and methods
Figure 1 shows the initial configurations of the perturbed light fluid layers. Two sinusoidal interfaces with in-phase or anti-phase configurations, as presented in figures 1(a,b), are positioned at both sides of the fluid layer to create different types of finger collisions. For the convenience of labelling and discussion, the upstream interface of the layer is designated as interface 1 (I1), while the downstream interface is designated as interface 2 (I2). In the Cartesian coordinate system, the perturbations at I1 and I2 can be expressed as $-L_0 + x = a_0^{\rm {I1}}\cos (ky)$ and $x = a_0^{\rm {I2}}\cos (ky)$. Here, $a_0^{\rm {I1}}$ and $a_0^{\rm {I2}}$ denote the initial amplitudes of I1 and I2, $k$ ($=2{\rm \pi} /\lambda$, with $\lambda$ the initial interface wavelength 40 mm for each case) denotes the wavenumber of the two interfaces, and $L_0$, the initial layer thickness, is defined as the distance between the average positions of I1 and I2. The detailed values of $a_0^{\rm {I1}}$, $a_0^{\rm {I2}}$ and $L_0$ for each perturbed case are listed in table 1. Both in-phase (IP) and anti-phase (AP) perturbed cases involve four scenarios, with $L_0 = 50$, 30, 10 and 5 mm, designed to examine the effect of thickness variation on finger collisions. We define the in-phase (anti-phase) cases with $L_0 = 50$, 30, 10 and 5 mm as cases L50-IP (L50-AP), L30-IP (L30-AP), L10-IP (L10-AP) and L5-IP (L5-AP), respectively. As depicted in figure 1, both I1 and I2 consist of three-wavelength sinusoidal perturbations connecting two flat sections of 10 mm on each side. These flat sections are introduced to minimize the wall effects of the shock tube (Brouillette & Sturtevant Reference Brouillette and Sturtevant1994; Reilly et al. Reference Reilly, McFarland, Mohaghar and Ranjan2015) and have negligible influence on the evolution of the middle sinusoidal perturbation (Luo et al. Reference Luo, Liang, Si and Zhai2019). The reflection distance $L_{re}$, defined as the distance from the average position of I2 to the reflecting wall, is consistently set at 100 mm for all cases. This distance ensures that at the time of reshock arrival, the amplitude growth for both interfaces remains in the initial stage so that the existing theories are expected to describe the perturbation growth during finger collisions. Additionally, four unperturbed cases, with $L_0 = 50$, 30, 10 and 5 mm, denoted as cases L50-1D, L30-1D, L10-1D and L5-1D, are designed to analyse the wave dynamics and interface motions during the finger collision process. In this work, the values of $L_0/\lambda$ for $L_0 = 50$, 30, 10 and 5 mm are 1.25, 0.75, 0.25 and 0.125, respectively. For incompressible fluids, Taylor (Reference Taylor1950) indicated that when $L_0/\lambda < 1/3$, the coupling between the two interfaces becomes significant. Based on this, we classify the cases with $L_0 = 50$ and 30 mm as the larger $L_0$ cases, and those with $L_0 = 10$ and 5 mm as the smaller $L_0$ cases.
Figure 2 depicts the interface formation device used to generate the perturbed soap-film interfaces. This device comprises three components: left, middle, and right devices, all fabricated by transparent acrylic plates. The precision of the engraving machine used for processing the interface formation device is 0.02 mm, significantly smaller than the interface amplitude of 2 mm and the wavelength of 40 mm. Therefore, the differences in phase and amplitude due to processing among different cases can be considered negligible. For the perturbed case, the edges of the acrylic plates are pre-carved into the sinusoidal shape. To constrain the soap film to the designed shape, a super-hydrophobic-oleophobic (SHO) material is applied to the sinusoidal edges of the left and right devices (Li et al. Reference Li, Cao, Wang, Zhai and Luo2023; Gao et al. Reference Gao, Guo, Zhai and Luo2024). The SHO coating does not introduce obstacles in the flow field (Wang et al. Reference Wang, Wang, Zhai and Luo2022) and thereby has no effect on the interface evolution. Then a rectangular brush, dipped in a suitable amount of soap solution along its borders, is pulled along the sinusoidal edges. Finally, soap-film interfaces are generated on the left and right devices, as presented in figure 2. Note that high-wavenumber perturbations would occur at the developing interface due to the breakup of the soap film caused by the shock impact. The scale of these perturbations is comparable to the size of the shock-induced atomized soap droplets. Previous studies have shown that at Mach number approximately 1.26, the size of the atomized droplets is approximately $35\ \mathrm {\mu }{\rm m}$ (Ranjan et al. Reference Ranjan, Niederhaus, Oakley, Anderson and Bonazza2009), much smaller than the interface wavelength 40 mm. Thus the influence of the high-wavenumber perturbations induced by the atomized droplets is negligible.
Gas SF$_6$ is inflated into the left and right devices to generate an SF$_6$/air/SF$_6$ fluid layer. When the soap-film interfaces are prepared, SF$_6$ is first charged into the right device through the inlet hole, and the air is discharged from the outlet hole, as illustrated in figure 2. Subsequently, the left, middle and right devices are connected through a drawer device, then the combined unit is inserted into the test section of the shock tube. Gas SF$_6$ is injected into the left device using a tube inserted into the shock tube, ultimately generating an SF$_6$/air/SF$_6$ fluid layer. During the SF$_6$ inflation process, a flow valve is used to maintain a suitable inflation rate, thus preserving the integrity of the soap film and ensuring the repeatability of experiments. For all experimental runs, the volume fraction of SF$_6$ on the left (right) side of I1 (I2) is maintained at $67.5\,\% \pm 1.0\,\%$ ($87.2\,\% \pm 1.0\,\%$). The soap film allows a small amount of SF$_6$ to diffuse into the middle device, resulting in a volume fraction of SF$_6$ within the layer of $3\,\% \pm 0.5\,\%$. According to the densities of gases inside and outside the fluid layer, the Atwood numbers ($=(\rho _h-\rho _l)/(\rho _h+\rho _l)$, with $\rho _h$ and $\rho _l$ the densities of the heavy and light fluids) for I1 and I2 are determined as $0.54 \pm 0.01$ and $0.60 \pm 0.01$, respectively.
The experiments are conducted in the horizontal shock tube designed by our group, which has proven its feasibility and reliability in reshock experiments (Cong et al. Reference Cong, Guo, Si and Luo2022; Guo et al. Reference Guo, Cong, Si and Luo2022a). The driver and driven sections of the shock tube are initially separated by a thin polyethylene terephthalate (PET) film. Air is then pumped into the driver section using an air compressor. Upon reaching the endurance limit of the PET film, it breaks, resulting in the formation of an incident shock that propagates along the driven section. When the incident shock arrives at the test section, it first traverses the fluid layer and then encounters a rigid wall that is formed by an acrylic block located 100 mm downstream of I2 (see figure 2). Subsequently, a reflected shock (namely, reshock) is generated. The reshock returns to impact the developing fluid layer, resulting in complex wave–interface interactions and additional vorticity deposition. In this work, the incident shock and the reshock have Mach numbers 1.262 and 1.268, respectively. The flow field is recorded by a schlieren system combined with a high-speed camera (FASTCAM SA-Z, Photron Limited). Further details about the schlieren system can be found in the previous work (Guo et al. Reference Guo, Cong, Si and Luo2022a). The frame rate of the camera is 60 000 frames per second, and the exposure time is $0.6\ \mathrm {\mu }{\rm s}$. The pixel resolution is 0.29 mm per pixel. The ambient temperature and pressure are $291.1 \pm 1\ {\rm K}$ and 101.0 kPa, respectively.
3. The 1-D wave dynamics and interface motions
In this section, the wave dynamics and interface motions in unperturbed cases are investigated both experimentally and theoretically. Since the wave–wave and wave–interface interactions are sensitive to $L_0$, we will demonstrate separately the results for the larger (L50-1D, L30-1D) and smaller (L10-1D, L5-1D) $L_0$ cases.
3.1. Larger layer thickness cases
Case L50-1D is taken as an example to illustrate the motions of waves and interfaces for the larger $L_0$ cases. Figure 3 shows the schlieren images and the corresponding sketches for case L50-1D at different moments. The $x\unicode{x2013}t$ diagram for this case, a plot of the spatial location of various waves along with the interfaces on the $x$-axis as a function of time on the $y$-axis, is presented in figure 4. Note that for clarity, only the waves inside and on the right side of the fluid layer are included, since these waves interact directly with the interfaces. As shown in figure 4(a), the interactions of the incident shock (IS) and the fluid layer lead to generations of multiple transmitted shocks (TS$_{a}$, TS$_{1}$, TS$_{2}$) and reflected shocks (RS$_{a}$, RS$_{b}$). Then TS$_{1}$ and TS$_2$ successively reach the end wall, generating the reflected shocks RTS${_1^{\prime }}$ and RTS${_2^{\prime }}$ (see figure 3b). Shock RTS${_2^{\prime }}$ catches up with RTS${_1^{\prime }}$ before they arrive at I2, then the two shocks merge into one shock, denoted as the first reshock RS$_1$ (see figure 3c). The interactions of RS$_1$ and the fluid layer result in multiple waves, including the reverberating shocks (TS$_{{b}}$, RS$_{c}$, RS$_{d}$), the reflected rarefaction wave (RW$_1$) and the transmitted shock (TS$_{3}$). Wave RW$_1$ and shock TS$_{3}$ propagate towards the end wall, subsequently leading to complex shock–rarefaction–wall interactions, and the details of these wave dynamics are magnified in figure 4(b). After the shock–rarefaction–wall interactions, the reflected rarefaction wave, denoted as RRW$_1$, and the second reshock, denoted as RS$_2$, are generated. Wave RRW$_1$ and shock RS$_2$ successively collide with I2, resulting in the formations of transmitted waves including a rarefaction wave (TRW$_{a}$) and a shock (TS$_{c}$). Overall, after multiple interactions of reshocks and rarefaction waves with the fluid layer, both interfaces approach near-stationary states in the late stage.
Note that in figure 4(a), we focus only on the reverberating waves that are significant for the interface motions, although theoretically, an infinite number of reverberating waves exist within the fluid layer. Based on the experimental conditions of this work, Mach numbers for RS$_b$, RS$_d$ and TS$_c$ are determined as 1.012, 1.013 and 1.038, respectively, through 1-D gas dynamics theories (Han & Yin Reference Han and Yin1993). Subsequent reverberating shocks following these three shocks possess Mach numbers below 1.01, resulting in the induced jump velocity not exceeding $4\ {\rm m}\ {\rm s}^{-1}$. This velocity is much smaller than the velocity (${>}60\ {\rm m}\ {\rm s}^{-1}$) induced by the incident shock or reshock, indicating limited effects on the interface motions. Consequently, reverberating shocks after RS$_b$, RS$_d$ and TS$_c$ are not included in figure 4. The rarefaction waves RRW$_1$ and TRW$_a$ induce interface velocity variations $27.0\ {\rm m}\ {\rm s}^{-1}$ and $19.4\ {\rm m}\ {\rm s}^{-1}$, respectively. The subsequent reverberating rarefaction waves induce interface velocity variations less than $5\ {\rm m}\ {\rm s}^{-1}$, indicating limited influence on the interface movements. Therefore, the rarefaction waves after TRW$_a$ are not considered in figure 4.
The 1-D flow for a reshocked light fluid layer, as presented in figure 4, involves the shock–interface interaction, rarefaction–interface interaction, shock–shock interaction, rarefaction–rarefaction interaction, shock–rarefaction interaction, shock–wall interaction and rarefaction–wall interaction. The fundamental relations for the wave–wave and wave–interface interactions have been outlined in previous publications on gas dynamics (Han & Yin Reference Han and Yin1993; Zucker & Biblarz Reference Zucker and Biblarz2019). Based on these fundamental relations, Liang & Luo (Reference Liang and Luo2022b) developed models to describe the motions of shocks and interfaces in a singly shocked light layer case. However, the flow of a reshocked light layer case is much more complex than that (involving only the shock–interface interaction) in the single shock condition. To characterize the motions of waves and interfaces for the reshocked light fluid layer, several specific times, including $t_0$, $t_1$, $t_2$, $t_3$ and $t_4$, are defined, as illustrated in figure 5. Specifically, $t_0$, defined as time zero ($t_0$ = 0), denotes the moment when RS$_1$ arrives at I2, $t_1$ denotes the moment when RS$_d$ arrives at I1, $t_2$ denotes the moment when the head of RRW$_1$ arrives at I2, $t_3$ denotes the moment when RS$_2$ arrives at I2, and $t_4$ denotes the moment when TS$_c$ arrives at I1. The $t_1$, $t_2$, $t_3$ and $t_4$ times can be expressed, respectively, as follows:
In this work, we use $t$, $x$, $U$, $\Delta U$, $V$ and $g$ to denote time, location, interface velocity, interface velocity variation, wave velocity and interface acceleration, respectively. The meanings of various physical quantities involved in (3.1a)–(3.1d) are outlined in table 2. The specific values of $t_0\unicode{x2013}t_4$ calculated by (3.1a)–(3.1d) are provided in table 3.
The acceleration of a shock on an interface is instantaneous, while a rarefaction wave has a width, thus its interaction with an interface is a continuous process. Since the duration of the rarefaction wave accelerating the interface is relatively short in this work (no more than $100\ \mathrm {\mu }{\rm s}$), here, the average acceleration is employed to characterize the rarefaction–interface interaction (Morgan, Likhachev & Jacobs Reference Morgan, Likhachev and Jacobs2016; Morgan et al. Reference Morgan, Cabot, Greenough and Jacobs2018; Liang & Luo Reference Liang and Luo2021; Cong et al. Reference Cong, Guo, Si and Luo2022). The time ($\Delta t_{RRW1}^{\rm {I2}}$) of passage for RRW$_1$ through I2, and the average acceleration ($g_{RRW1}^{\rm {I2}}$) imposed on I2, can be expressed, respectively, as
The time ($\Delta t_{TRWa}^{\rm {I1}}$) of passage for TRW$_a$ through I1, and the average acceleration ($g_{TRWa}^{\rm {I1}}$) imposed on I1, can be expressed, respectively, as
The detailed values of $\Delta t_{RRW1}^{\rm {I2}}$, $g_{RRW1}^{\rm {I2}}$, $\Delta t_{TRWa}^{\rm {I1}}$ and $g_{TRWa}^{\rm {I1}}$ determined by (3.2a)–(3.3b) are listed in table 3.
In short, the motions of waves and interfaces for the reshocked light fluid layer in five stages can be described by a 1-D theory. As depicted in figure 5, stage 1 occurs during the time interval $t_0< t< t_1$, during which both interfaces experience multiple reshock–interface interactions, leading to a decrease in their velocity from $U_{f1}$ (${\sim }68\ {\rm m}\ {\rm s}^{-1}$) to $U_{f2}$ (${\sim }3\ {\rm m}\ {\rm s}^{-1}$). Stage 2 occurs during the time interval $t_1< t< t_2$, during which both interfaces move at a constant velocity $U_{f2}$. Stage 3 occurs during the time interval $t_2< t< t_3$, during which the rarefaction–interface interactions dominate. Stage 4 occurs during the time interval $t_3< t< t_4$, during which the velocities of both interfaces decrease to $U_{f3}$ (${\sim }0\ {\rm m}\ {\rm s}^{-1}$) due to the reshock–layer interaction. Stage 5 occurs when $t_4< t$, during which both interfaces move at a constant velocity $U_{f3}$. Figure 4(a) presents the comparison of interface motions for case L50-1D between the experimental results and 1-D theoretical predictions in different stages. Good agreement between experimental and theoretical results is achieved.
3.2. Smaller layer thickness cases
Case L10-1D is taken as an example to illustrate the motions of waves and interfaces for the smaller $L_0$ cases. The $x\unicode{x2013}t$ diagram for case L10-1D is presented in figure 6(a), with the shock–rarefaction–wall interactions enclosed by the red dashed lines magnified in figure 6(b). In comparison with the $x\unicode{x2013}t$ diagram shown in figure 4, there are two differences in wave behaviours in figure 6. First, TS$_1$ and TS$_2$ merge into TS$_{12}$ before reaching the end wall. Second, before RS$_{2}$ and RRW$_1$ reach I2, RS$_{2}$ catches up with RRW$_1$, transforming the rarefaction wave region overtaken by the shock into the post-shock region (Han & Yin Reference Han and Yin1993; Gao et al. Reference Gao, Guo, Zhai and Luo2024). As a result, RS$_{2}$ becomes the tail of RRW$_1$, and thereby TS$_c$ becomes the tail of TRW$_a$. For both larger and smaller $L_0$ cases, the Mach number of RS$_1$ is approximately 1.268, indicating that the difference in merging time for TS$_1$ and TS$_2$ has almost no influence on the intensity of RS$_1$. However, RS$_{2}$ catching up with RRW$_1$ and TS$_c$ catching up with TRW$_a$ result in differences in the calculations of $t_3$ and $t_4$ between the larger and smaller $L_0$ cases. The $t_3$ and $t_4$ values in cases L10-1D and L5-1D can be expressed, respectively, as follows:
with
and
The meanings of quantities in (3.4a)–(3.6c) are described in table 2. Notably, for cases L10-1D and L5-1D, (3.1a)–(3.1b) are still effective in describing $t_1$ and $t_2$, and (3.2a)–(3.3b) are applicable for describing the rarefaction–interface interactions. The detailed values of $t_0\unicode{x2013}t_4$, $\Delta t_{RRW1}^{\rm {I2}}$, $\Delta t_{TRWa}^{\rm {I1}}$, $g_{RRW1}^{\rm {I2}}$ and $g_{TRWa}^{\rm {I1}}$ in cases L10-1D and L5-1D are listed in table 3.
In short, the 1-D theory quantifies the specific times $t_3$ and $t_4$ in cases L10-1D and L5-1D, which have different calculations from those in cases L50-1D and L30-1D. Based on the specific times $t_0$, $t_1$, $t_2$, $t_3$ and $t_4$, the interface motions after reshock for cases L10-1D and L5-1D can also be classified into five stages, as described in § 3.1. Figure 6(a) presents the comparison of interface motions for case L10-1D between the experiments and the 1-D theory in different stages. It is observed that there is good agreement between experimental and theoretical results.
4. Experimental analyses of finger collisions
4.1. Morphology of interface evolution
Figure 7 shows the evolution of the in-phase perturbed cases with varying initial layer thicknesses. Notably, a resemblance in interface morphology is observed between cases L50-IP and L30-IP, as well as between cases L10-IP and L5-IP. Here, we take case L30-IP as an example to illustrate the interface evolution for both cases L50-IP and L30-IP. As depicted in figure 7(b), I1 initially experiences phase reversal due to its heavy/light configuration relative to the incident shock. Before the first reshock (RS$_1$) arrival, I1 and I2 transition from an initially in-phase state to an anti-phase state ($-17\ \mathrm {\mu }{\rm s}$). Subsequently, RS$_1$ and its transmitted shock sequentially strike I2 and I1, reversing I2's phase while promoting I1's development. The I1 spike moves downstream and eventually catches up with the I2 bubble, resulting in a spike–bubble rear-end collision (SBC) ($553\ \mathrm {\mu }{\rm s}$). The I2 spike gradually develops upstream, leading to another SBC ($1250\ \mathrm {\mu }{\rm s}$). At late times, the SBCs yield periodically arranged finger structures, fostering a nearly symmetrical expansion of the mixing zone ($1250\unicode{x2013}2350\ \mathrm {\mu }{\rm s}$).
As illustrated in figures 7(c) and 7(d), the interface evolution for cases L10-IP and L5-IP exhibits distinctions compared with cases L50-IP and L30-IP. Specifically, in cases L10-IP and L5-IP, the SBC occurs earlier, resulting in a more complete merging of the two interfaces. Notably, upstream of the mixing zone, the I1 bubble and the I2 spike gradually merge into a spike-like structure, while downstream, the I1 spike and the I2 bubble gradually merge into a bubble-like structure ($841\unicode{x2013}1241\ \mathrm {\mu }{\rm s}$). The asymmetric development of these spike- and bubble-like structures leads to the evolution of the mixing zone closely resembling that of a shocked single interface (2341 and $2345\ \mathrm {\mu }{\rm s}$) (Jacobs & Krivets Reference Jacobs and Krivets2005; Morgan et al. Reference Morgan, Aure, Stockero, Greenough, Cabot, Likhachev and Jacobs2012; Liu et al. Reference Liu, Liang, Ding, Liu and Luo2018).
Figure 8 shows the evolution of the anti-phase perturbed cases with varying initial layer thicknesses. In case L50-AP, as illustrated in figure 8(a), I1 inverts its phase after the incident shock impact. Subsequently, the two interfaces transition into an in-phase state before the RS$_1$ arrival ($-42\ \mathrm {\mu }{\rm s}$). After the impact of RS$_1$, I2 undergoes a phase reversal so that its spike continuously moves upstream. Eventually, the spikes of I1 and I2 encounter each other, leading to a spike–spike head-on collision (SSC) ($530\ \mathrm {\mu }{\rm s}$). In this scenario, the impact force of spikes for both interfaces is comparable, resulting in a significant inhibition of the spike developments. In contrast, the bubbles of both interfaces continuously develop after SSC, and at late times, two large bubble structures, characterized by rounded heads, emerge both upstream and downstream of the field of view ($846\unicode{x2013}2346\ \mathrm {\mu }{\rm s}$).
In case L30-AP, as depicted in figure 8(b), the SSC occurs just as I2 undergoes a phase inversion ($525\ \mathrm {\mu }{\rm s}$). In other words, the spike at I1 predominates over that at I2 during the SSC. The vortex pairs at the I1 spikes gradually develop, entraining the surrounding fluids into the vortical structure ($842\unicode{x2013}2342\ \mathrm {\mu }{\rm s}$). Consequently, these vortex pairs continuously squeeze the adjacent bubbles at I2, resulting in the thinning of bubbles at I2 in the late stage ($2342\ \mathrm {\mu }{\rm s}$).
As illustrated in figures 8(c) and 8(d), for cases L10-AP and L5-AP, the collision between I1 spikes and I2 precedes the I2 phase reversal (170 and $157\ \mathrm {\mu }{\rm s}$), thereby impeding I2 from inverting its phase. It is generally understood that a heavy/light interface would undergo phase reversal after a shock impact (Meyer & Blewett Reference Meyer and Blewett1972; Holmes et al. Reference Holmes, Dimonte, Fryxell, Gittings, Grove, Schneider, Sharp, Velikovich, Weaver and Zhang1999; Guo et al. Reference Guo, Si, Zhai and Luo2022b). However, in cases L10-AP and L5-AP, an abnormal RMI phenomenon occurs such that I2 fails to reverse its phase due to the SSC (853 and $840\ \mathrm {\mu }{\rm s}$). As a result, in addition to the normally generated bubble structure, another bubble structure emerges at the original spike position on I2, with its tip positioned further downstream than the normal bubble tip (1253 and $1240\ \mathrm {\mu }{\rm s}$).
Table 4 summarizes the types of finger collisions after reshock for different cases. For initial in-phase cases, SBC occurs, while for initial anti-phase cases, SSC emerges. In particular, SSC results in abnormal RMI when $L_0$ is relatively small.
4.2. Interface amplitude and mixing width
Figures 9(a) and 9(b) show the dimensionless reshocked amplitude growth for both interfaces in the initial in-phase and anti-phase cases, respectively. The interface amplitude is defined as half of the distance between the bubble tip and the spike tip. For clarity, the amplitude data of I1 and I2 are presented respectively in the upper and lower halves of figures 9(a) and 9(b). Notably, the amplitude variations during the compression process resulting from the reshock–layer interaction are not included in figure 9; hence the amplitude evolution is displayed from $t = t_1$. Similar to previous reshock studies that scaled time using the interface jump velocity (Balakumar et al. Reference Balakumar, Orlicz, Ristorcelli, Balasubramanian, Prestridge and Tomkins2012; Guo et al. Reference Guo, Cong, Si and Luo2022a), time in this work is scaled as $k\,\Delta U_f(t-t_1)$, where $\Delta U = |U_{f2}-U_{f1}|$ characterizes the change in layer interface velocity due to reshock–layer interactions. The amplitudes for I1 and I2 are normalized as $k\,|a^{\rm {I1}}-a^{\rm {I1}}_1|$ and $-k\,|a^{\rm {I2}}-a^{\rm {I2}}_1|$, respectively, where $a^{\rm {I1}}_1$ and $a^{\rm {I2}}_1$ represent the amplitudes for I1 and I2 at $t_1$, respectively.
For the initial in-phase cases, as illustrated in figure 9(a), the evolving amplitudes of both I1 and I2 decrease as $L_0$ diminishes, indicating that a smaller layer thickness is more favourable for the suppression of amplitude growth due to SBC. For the initial anti-phase cases, as presented in figure 9(b), the amplitude growth of I2 also shows a monotonic variation with $L_0$. Especially, SSC leads to nearly stagnant amplitude growth of I2 in all initial anti-phase cases from dimensionless time 5. However, unlike the initial in-phase cases, the amplitude growth of I1 does not follow a monotonic trend with $L_0$. This discrepancy is attributed to the abnormal RMI in cases L10-AP and L5-AP, where the suppression of spike growth is relatively weaker compared with cases L50-AP and L30-AP. As a result, the evolving amplitudes in cases L10-AP and L5-AP eventually exceed those in case L30-AP. Overall, compared with the initial in-phase cases, the interface amplitude growth in initial anti-phase cases is more suppressed due to SSC, even resulting in stagnation of I2's amplitude growth.
Figure 10(a) shows the mixing widths – defined as the distance from the leftmost side of I1 to the rightmost side of I2 – as functions of time. The time axis is normalized in the same manner as the interface amplitude used in figure 9, and the mixing width is scaled as $k(h-h_1)$, with $h_1$ denoting the mixing width at $t_1$. It is observed that for the initial in-phase cases, the growth of the mixing width gradually decreases with a reduction of $L_0$. However, this trend is disrupted in the initial anti-phase scenarios. Specifically, due to the SSC, a substantial reduction in the mixing width growth is observed beyond dimensionless time 7 for cases L50-AP and L30-AP. Nevertheless, in cases L10-AP and L5-AP, the abnormal RMI causes the mixing width growth rates to gradually surpass those of cases L50-AP and L30-AP. After dimensionless time 13, the mixing width of case L5-AP even exceeds the values for cases L50-AP and L30-AP.
Figure 10(b) utilizes the reshocked linear mixing width growth rate ($v_h$) to normalize the time axis, a method similar to that used in the previous study on heavy fluid layers (Cong et al. Reference Cong, Guo, Si and Luo2022). It is observed that this scaling method collapses the mixing width data, except for cases L50-AP and L30-AP. The data for these two cases are notably lower than those for other cases, further highlighting the SSC effectiveness in suppressing the whole mixing width growth.
It is known that suppressing the development of both individual interface amplitude and overall layer mixing width is crucial for ICF (Lindl et al. Reference Lindl, Landen, Edwards, Moses and Team2014; Betti & Hurricane Reference Betti and Hurricane2016). Figures 9 and 10 indicate that SSC effectively reduces the growth of interface amplitude and overall mixing width by suppressing spike growth, which is the primary driver of perturbation growth (Mikaelian Reference Mikaelian1998; Zhang Reference Zhang1998; Buttler et al. Reference Buttler2012; Dimonte et al. Reference Dimonte, Terrones, Cherne and Ramaprabhu2013). Notably, maximizing SSC effectiveness in attenuating growth requires a sufficiently large initial layer thickness. This ensures that I2 can reverse phase and develop adequately, allowing spikes to fully collide and thereby cancel out their growth.
4.3. Effects of waves
During finger collisions, the waves (TRW$_a$, RRW$_1$, TS$_c$ and RS$_2$) continually interact with the interfaces, influencing the interface evolution. The durations of interactions of different waves with both interfaces for cases L50-IP and L50-AP are marked with dotted lines, as depicted in figures 9(a) and 9(b). During the interactions of TRW$_a$ and RRW$_1$ with the interfaces, the amplitude growth rates increase, while during the interactions of TS$_c$ and RS$_2$ with the interfaces, the amplitude growth rates decrease. As a result, the overall amplitudes for both I1 and I2 exhibit an oscillatory growth trend. This trend is also observed in cases L30-IP and L30-AP, although the durations of wave–interface interactions are not marked for clarity. In contrast, the amplitude growth trends in cases L10-IP, L5-IP, L10-AP and L5-AP are smooth, differing from the oscillatory growth seen in the aforementioned cases. To elucidate the effects of these distinct waves (RRW$_1$, TRW$_a$, RS$_2$ and TS$_c$) on interface evolution, schematics of the interactions between the four waves and the interfaces are presented in figure 11. Figures 11(a–c) correspond to the initial in-phase cases, and figures 11(d–f) correspond to the initial anti-phase cases. Note that the two interfaces are depicted without collision to better isolate the effects of waves on each interface.
As depicted in figures 11(a) and 11(d), the influence of RRW$_1$ on I2 encompasses two primary aspects. (i) Wave RRW$_1$ strikes first the downstream side of I2 and then the upstream side, inducing interface stretching along the streamwise direction, known as the stretching effect (Cong et al. Reference Cong, Guo, Si and Luo2022). (ii) The RRW$_1$–I2 interaction induces RTI due to the imposed acceleration $g_{RRW1}$ directed from air to SF$_6$ (i.e. light fluids accelerate heavy fluids). In this scenario, the vorticity resulting from the RRW$_1$–I2 interaction aligns with the original vorticity, thereby promoting the I2 evolution. As depicted in figures 11(b) and 11(e), TRW$a$ affects I1 in two main ways: (i) the stretching effect, and (ii) the Rayleigh–Taylor stabilization (RTS) (Mikaelian Reference Mikaelian2009), resulting from the acceleration $g_{TRWa}$ directed from SF$_6$ to air. It is evident that the RTS and the stretching effect exert opposing influences on the I1 amplitude growth. As shown in figure 9, in cases L50-IP and L50-AP, the I1 amplitude growth increases during the passage of TRW$_a$, indicating the dominance of the stretching effect between the two impacts imposed by TRW$_a$. As presented in figures 11(b) and 11(e), RS$_2$ compresses I2 and introduces vorticity opposite to that deposited by RRW$_1$, indicating opposing influences of RS$_2$ and RRW$_1$ on I2 evolution. Similarly, the effects of TS$_c$ and TRW$_a$ on I1 evolution oppose each other, as shown in figures 11(b), 11(c), 11(e) and 11( f). For the entire fluid layer, the stretching effect induced by rarefaction waves increases the distance between I1 and I2, thereby reducing the finger collision intensity. Conversely, the second reshock compresses the layer, enhancing the collision intensity.
The reasons for the diminished wave effects in cases L10-IP, L5-IP, L10-AP and L5-AP are explored. As discussed in the 1-D analysis in § 3.2, for the smaller $L_0$ cases, RS$_2$ (TS$_c$) catches up with RRW$_1$ (TRW$_a$), becoming the tail of RRW$_1$ (TRW$_a$). Subsequently, RS$_2$ and TS$_c$ promptly interact with these interfaces after the interactions of RRW$_1$ and TRW$_a$. As mentioned above, the influences of RS$_2$ and TS$_c$ oppose those of RRW$_1$ and TRW$_a$, effectively neutralizing these wave effects. Consequently, a relatively smooth amplitude growth trend occurs in cases L10-IP, L5-IP, L10-AP and L5-AP, as presented in figure 9.
5. Theoretical predictions
5.1. Linear amplitude growth
Before the collision of fingers, both interfaces exhibit linear amplitude growth, as shown in figure 9. Table 5 presents the experimental linear amplitude growth rates $v_{e}^{{\rm {I1}}}$ and $v_{e}^{{\rm {I2}}}$ for I1 and I2. These values are determined through linear fits of the experimental amplitude data, with positive or negative signs depending on the observed slopes in figure 9. Notably, both $v_{e}^{{\rm {I1}}}$ and $v_{e}^{{\rm {I2}}}$ can be regarded as the linear superposition of two components (Mikaelian Reference Mikaelian1985; Charakhch'yan Reference Charakhch'yan2001): (i) the amplitude growth rate before reshock, denoted as $v^{\rm {I1}}_{bf}$ and $v^{\rm {I2}}_{bf}$ for I1 and I2; and (ii) the reshock-induced amplitude growth rate, denoted as ${\mathrm {d}a^{\rm {I1}}}/{{\rm {d}}t}$ and ${\mathrm {d}a^{\rm {I2}}}/{{\rm {d}}t}$ for I1 and I2. Here, $v^{\rm {I1}}_{bf}$ and $v^{\rm {I2}}_{bf}$ can be obtained through linear fits of the amplitude data before reshock (see table 5 for detailed values), as performed in previous studies (Charakhch'yan Reference Charakhch'yan2001); ${\mathrm {d}a^{\rm {I1}}}/{{\rm {d}}t}$ and ${\mathrm {d}a^{\rm {I2}}}/{{\rm {d}}t}$, directly related to the reshock–layer interaction, will be quantified theoretically.
For a shocked fluid layer separating three fluids with different densities (i.e. an A/B/C-type layer), Liang & Luo (Reference Liang and Luo2022a) extended the model of Jacobs et al. (Reference Jacobs, Jenkins, Klein and Benjamin1995) to the following forms (the LL model) to describe the linear amplitude growth of both interfaces:
where $\rho _{1,3}$ and $\rho _2$ represent the densities of fluids outside and inside the layer, respectively. To simply the model, Liang & Luo (Reference Liang and Luo2022a) considered only the first two shock–interface interactions, and used the jump velocity $\Delta U_i$ ($\Delta U_t$) to characterize the impulsive strength imparted to I1 (I2) by the incident (transmitted) shock. However, considering only the first two shock–interface interactions is likely to be insufficient, as I1 and I2 do not reach the same final velocity ($\Delta U_i \neq \Delta U_t$) (Cong et al. Reference Cong, Guo, Si and Luo2022; Zhang et al. Reference Zhang, Zhou, Ding and Luo2022).
The LL model is modified to describe the reshock-induced linear amplitude growth rates ${\mathrm {d}a^{\rm {I1}}}/{{\rm {d}}t}$ and ${\mathrm {d}a^{\rm {I2}}}/{{\rm {d}}t}$. The modifications to the LL model aim to accurately characterize the reshock–layer interactions. Taking the in-phase scenario as an example, figure 12 shows the process of interactions of RS$_1$ and its subsequent reverberating shocks (TS$_b$, RS$_c$ and RS$_d$) with the two interfaces. As depicted in figure 12(a), before the RS$_1$ impact, the amplitudes of I1 and I2 are denoted as $a^{\rm {I1}}_{bf}$ and $a^{\rm {I2}}_{bf}$, respectively, and the densities of fluids are denoted as $\rho _1^\prime$, $\rho _2^\prime$ and $\rho _3^\prime$, respectively. Then RS$_1$ and TS$_b$ impact I2 and I1, imposing jump velocities $\Delta U_{RS1}^{\rm {I2}}$ ($=-87.9\ {\rm m}\ {\rm s}^{-1}$) and $\Delta U_{TSb}^{\rm {I1}}$ ($=-64.1\ {\rm m}\ {\rm s}^{-1}$) on the respective interfaces, as illustrated in figures 12(b) and 12(c). After the impacts of RS$_1$ and TS$_b$, I2 and I1 reach velocities $-20.4\ {\rm m}\ {\rm s}^{-1}$ and $3.5\ {\rm m}\ {\rm s}^{-1}$, respectively, demonstrating a notable discrepancy between them. This indicates that considering only the first two reshock–interface interactions is insufficient for characterizing the total reshock-induced impulsive strength. As depicted in figures 12(d) and 12(e), RS$_c$ and RS$_d$ impose jump velocities $\Delta U_{RSc}^{\rm {I2}}$ ($=16.1\ {\rm m}\ {\rm s}^{-1}$) and $\Delta U_{RSd}^{\rm {I1}}$ ($=-5.5\ {\rm m}\ {\rm s}^{-1}$) on I2 and I1, respectively. After the impacts of RS$_c$ and RS$_d$, I2 and I1 respectively reach velocities $-4.3\ {\rm m}\ {\rm s}^{-1}$ and $-2.1\ {\rm m}\ {\rm s}^{-1}$, with both values being very close. The jump velocities induced by the later reverberating shocks decay rapidly, not exceeding $1.5\ {\rm m}\ {\rm s}^{-1}$, indicating minimal influence on the interface movement. As a result, besides the first two reshock–interface interactions, two more reshock–interface interactions are considered in the modification to the LL model.
The compression effects resulting from the reshock–layer interaction are quantified through the post-reshock quantities to further modify the LL model. Notably, among the four reshock–interface interactions mentioned above, the first involves a heavy/light interface configuration, while the three remaining cases involve a light/heavy configuration. The methods proposed by Meyer & Blewett (Reference Meyer and Blewett1972) and Richtmyer (Reference Richtmyer1960) have been validated for describing post-shock amplitudes in heavy/light (Holmes et al. Reference Holmes, Dimonte, Fryxell, Gittings, Grove, Schneider, Sharp, Velikovich, Weaver and Zhang1999; Guo et al. Reference Guo, Cong, Si and Luo2022a) and light/heavy (Jacobs & Krivets Reference Jacobs and Krivets2005; Liu et al. Reference Liu, Liang, Ding, Liu and Luo2018) configurations, respectively, and are therefore adopted in this study. Specifically, the amplitude ($a_\alpha ^{\rm {I2}}$) for I2 after the RS$_1$ impact is expressed as the average of the amplitudes when RS$_1$ just contacts and completely passes through I2. This amplitude equals the value when RS$_1$ arrives at the centre of I2, as illustrated in figure 12(b). The post-reshock amplitudes ($a_\alpha ^{\rm {I1}}$, $a_\beta ^{\rm {I2}}$ and $a_1^{\rm {I1}}$) for the three remaining cases are expressed as the amplitudes when TS$_b$, RS$_c$ and RS$_d$ completely traverse the corresponding interface, as depicted in figures 12(c), 12(d) and 12(e). The values for $a_\alpha ^{\rm {I2}}$, $a_\alpha ^{\rm {I1}}$, $a_\beta ^{\rm {I2}}$ and $a_1^{\rm {I1}}$ obtained from experiments are listed in table 5. After the four reshock–interface interactions, the fluid densities transition from $\rho _1^\prime$, $\rho _2^\prime$ and $\rho _3^\prime$ to $\rho _1^\ast$, $\rho _2^\ast$ and $\rho _3^\ast$, which can be determined by 1-D gas dynamics theories (Han & Yin Reference Han and Yin1993). The fluid-layer thickness ($L^*$) after the four reshock–interface interactions can be expressed as
After considering the jump velocities induced by the first four reshock–interface interactions and the reshock compression effects, (5.1a) and (5.1b) are modified as
where
By solving (5.3a) and (5.3b), the reshock-induced linear amplitude growth rates ${\mathrm {d}a^{\rm {I1}}}/{{\rm {d}}t}$ and ${\mathrm {d}a^{\rm {I2}}}/{{\rm {d}}t}$ can be expressed as
with
According to the linear superposition principle (Mikaelian Reference Mikaelian1985; Charakhch'yan Reference Charakhch'yan2001), we can obtain a linear model by summing ${\mathrm {d} a^{\rm {I1}}}/{\mathrm {d} t}$ and $v^{\rm {I1}}_{bf}$, and by summing ${\mathrm {d} a^{\rm {I2}}}/{\mathrm {d} t}$ and $v^{\rm {I2}}_{bf}$, to describe the overall amplitude growth rates for I1 and I2 after reshock:
Table 5 presents a comparison between the theoretical and experimental linear amplitude growth rates after reshock. It is observed that in most cases, the theoretical values of $v_{t}^{{\rm {I1}}}$ and $v_{t}^{{\rm {I2}}}$ given by the linear model (5.7a)–(5.7b) are in good agreement with the experimental values of $v_{e}^{{\rm {I1}}}$ and $v_{e}^{{\rm {I2}}}$. The deviation observed in several cases with smaller $L_0$ values is primarily because SBC and SSC occur early, violating the model's requirement for the non-contact coupling between the two interfaces.
5.2. Nonlinear amplitude growth
The collision between fingers directly influences the perturbation growth of both interfaces, resulting in intense nonlinearity. In this subsection, theoretical modelling is conducted to evaluate the nonlinear amplitude growth under finger collision conditions.
5.2.1 Larger $L_0$ cases
First, the nonlinear amplitude growth for the larger $L_0$ cases is estimated theoretically. Figures 13(a)–13(d) show the dimensionless amplitude growth for I1 and I2 in cases L50-IP, L50-AP, L30-IP and L30-AP, respectively. It is observed that the nonlinear amplitude growth exhibits an overall logarithmic trend, similar to observations in scenarios of the single interface RMI (Jacobs & Krivets Reference Jacobs and Krivets2005; Morgan et al. Reference Morgan, Aure, Stockero, Greenough, Cabot, Likhachev and Jacobs2012; Liu et al. Reference Liu, Liang, Ding, Liu and Luo2018; Mansoor et al. Reference Mansoor, Dalton, Martinez, Desjardins, Charonko and Prestridge2020). This implies that the overall logarithmic growth trend during finger collisions may be described by the nonlinear model proposed for the single interface configuration. Noteworthy are the oscillations in amplitude growth, depicted by shaded areas in figure 13, originating from the interactions of RRW$_1$, TRW$_a$, RS$_2$ and TS$_c$ with the interfaces. These oscillations can be characterized by quantifying the effects of the waves. Subsequently, by superimposing these wave effects onto a suitable nonlinear model, comprehensive estimations of the entire oscillatory nonlinear growth can be obtained.
The nonlinear model (DR model) proposed by Dimonte & Ramaprabhu (Reference Dimonte and Ramaprabhu2010), applicable to scenarios with various initial interface amplitudes and density ratios, is employed to describe the overall logarithmic nonlinear growth. The DR model expresses the bubble and spike amplitude growth rates ($v_{bu/sp}^{{\rm {I1}}}$ and $v_{bu/sp}^{{\rm {I2}}}$) for I1 and I2 as follows:
where
The subscripts ‘$bu$’ and ‘$sp$’ denote bubbles and spikes, and $v^{{\rm {I1}}}_{st}$ and $v^{{\rm {I2}}}_{st}$ denote the start-up growth rates of the DR model for I1 and I2, respectively, which correspond to $v^{{\rm {I1}}}_{t}$ and $v^{{\rm {I2}}}_{t}$ obtained from the linear model (5.7a)–(5.7b). Also, $a^{\rm {I1}}_{st}$ and $a^{\rm {I2}}_{st}$ denote the amplitudes for I1 and I2 at the end of the linear growth.
As discussed in § 4.3, the impacts of TRW$_a$ on the I1 development consist of both RTS and the stretching effect. Here, the Rayleigh model (Rayleigh Reference Rayleigh1883; Taylor Reference Taylor1950; Mikaelian Reference Mikaelian2009) is adapted to predict the amplitude growth rate induced by RTS. To simplify the analysis, we assume that the RTS is induced by the 1-D TRW$_a$, allowing us to substitute the I1 acceleration $g^{\rm {I1}}_{TRWa}$ into the Rayleigh model, thereby resulting in the modified form
Considering the initial conditions $({\mathrm {d} a^{\rm {I1}}}/{\mathrm {d}t})|_{t=0}=0$ and $a^{\rm {I1}} |_{t=0}=a^{\rm {I1}} _ {hTRWa}$, where $a^{\rm {I1}} _ {hTRWa}$ is the I1 amplitude when the head of TRW$_a$ meets it, and integrating the time term in (5.10), we can obtain the interface amplitude induced by RTS:
where
The increase in amplitude ($\Delta a^{\rm {I1}}_{stretch}$) of I1 due to the stretching effect of TRW$_a$ can be expressed as
where $c_{2}^{*}$ represents the sound speed at the head of TRW$_a$.
Table 6 compares the amplitude variations ($\Delta a^{\rm {I1}}_{RTS}$ and $\Delta a^{\rm {I1}}_{stretch}$) of I1 resulting from RTS and the stretching effect. It is observed that the amplitude reduction ($\Delta a^{\rm {I1}}_{RTS}$) caused by RTS is smaller than the increase ($\Delta a^{\rm {I1}}_{stretch}$) caused by the stretching effect. Consequently, the stretching effect predominates over RTS in influencing I1, thereby enhancing the amplitude growth rate during the TRW$_a$–I1 interaction, as illustrated in figure 13.
The impacts of RRW$_1$ on the I2 evolution consist of RTI and the stretching effect. To predict the amplitude growth rate induced by RTI, we modify the ZG model (Zhang & Guo Reference Zhang and Guo2016), which characterizes the growth rates of bubbles and spikes at any density ratio. Similar to the approach used for RTS, we consider that the RTI of I2 is induced by the 1-D RRW$_1$. Then substituting the I2 acceleration $g^{\rm {I2}}_{RRW1}$ into the ZG model results in the modified form
where
The amplitude increment ($\Delta a^{\rm {I2}}_{stretch}$) of I2 caused by the stretching effect of RRW$_1$ can be expressed as
where $a^{\rm {I2}}_{hRRW1}$ is the I2 amplitude when the head of RRW$_1$ just contacts it, and $c_{3}^{*}$ is the sound speed at the RRW$_1$ head.
The impingements of TS$_c$ and RS$_2$ on I1 and I2 lead primarily to amplitude compressions, denoted as $\Delta a^{\rm {I1}}_{TSc}$ and $\Delta a^{\rm {I2}}_{RS2}$, respectively. These reductions in amplitude can be calculated using the expressions
where $a^{\rm {I1}}_{TSc}$ ($a^{\rm {I2}}_{RS2}$) denotes the amplitude for I1 (I2) when TS$_c$ (RS$_2$) just contacts it.
The theoretical predictions of the nonlinear growth in the larger $L_0$ cases are presented in figure 13. The DR model effectively captures the logarithmic nonlinear amplitude growth for both I1 and I2. Equations (5.11) and (5.13) well quantify the amplitude variations resulting from RTS and the stretching effect of TRW$_a$, and (5.14) and (5.16) well predict the amplitude enhancements resulting from RTI and the stretching effect of RRW$_1$. Equations (5.17a) and (5.17b) give good predictions of the amplitude compressions caused by TS$_c$ interacting with I1, and RS$_2$ interacting with I2, respectively. Notably, the SSC results in stagnation of the spike growth (i.e. $v_{sp}^{{\rm {I1}}} = 0$, $v_{sp}^{{\rm {I2}}} = 0$) for cases L50-AP and L30-AP. To capture the perturbation growth when the spike growth rates approach zero, only the bubble components ($v_{bu}^{{\rm {I1}}}$ and $v_{bu}^{{\rm {I2}}}$) of the DR model are adopted. Additionally, the DR model is not included in the prediction during the passage of RRW$_1$. This is because when using (5.14), the RMI growth rates $v_{bu/sp}^{{\rm {I2}}}$ are utilized as initial conditions for integration to obtain the growth rate of RTI induced by RRW$_1$, implying that (5.14) inherently includes the growth rate induced by RMI.
5.2.2 Smaller $L_0$ cases
The nonlinear amplitude growth for the smaller $L_0$ cases is estimated theoretically. The interface amplitude growth data in cases L10-IP, L10-AP, L5-IP and L5-AP are plotted in figures 14(a)–14(d), respectively. Since TS$_c$ (RS$_2$) closely follows the impact of TRW$_a$ (RRW$_1$) on I1 (I2), counteracting the influence of TRW$_a$ (RRW$_1$), both I1 and I2 exhibit a smooth logarithmic growth trend in amplitude. Therefore, only the DR model is utilized to predict the nonlinear amplitude growth in these cases. Notably, owing to the limitations of the linear model in accurately capturing amplitude growth rates under certain scenarios (see table 5 for details), the linear growth rate obtained through linear fitting (denoted by dash-dotted lines in figure 14) is employed as the start-up growth rate for the DR model. Remarkably, the DR model provides good predictions of the nonlinear amplitude growth rates for both I1 and I2 in cases L10-IP, L10-AP, L5-IP and L5-AP.
Notably, for cases L10-AP and L5-AP, the abnormal RMI leads to the formation of two bubble structures within a single wavelength at I2, as presented in the schlieren image inset in figure 14(b). The widths of these bubbles, denoted as $h_{bu1} = x_1-x_3$ and $h_{bu2} = x_2-x_3$, respectively, are measured from the downstream positions of the bubbles ($x_1$ and $x_2$) to their upstream position ($x_3$). The I2 amplitude ($a^{\rm {I2}}$) in the nonlinear growth period can be determined as half the difference between $h_{bu1}$ and $h_{bu2}$. To predict the nonlinear amplitude growth of I2, $h_{bu1}$ and $h_{bu2}$ are first estimated using the bubble components (DR$_{hbu1}$ and DR$_{hbu2}$) of the DR model. As illustrated in the insets of figures 14(b) and 14(d), the theoretical predictions represented by the red and green lines for DR$_{hbu1}$ and DR$_{hbu2}$ align well with the experimental results. Then, by computing $({\rm DR}_{hbu1}-{\rm DR}_{hbu2})/2$, the theoretical prediction, denoted by orange lines in figures 14(b) and 14(d), effectively captures the I2 nonlinear amplitude growth in both cases L10-AP and L5-AP.
In short, the successful application of the DR model indicates that the nonlinear growth pattern during finger collisions shows similarities to that of a single interface configuration. Specifically, in the SSC cases, although spike growth is dramatically suppressed, the amplitude growth of bubbles on both sides of the layer is minimally affected, remaining comparable to that in a single interface scenario. In the SBC cases, the spike growth of I1 (I2) is inhibited, while the bubble growth of I1 (I2) is promoted. This inhibition and promotion largely cancel each other out, resulting in the overall amplitude growth of I1 and I2 resembling that of a single interface configuration. As a result, the DR model can describe the nonlinear amplitude growth during finger collisions.
6. Conclusions
The finger collisions in an SF$_6$/air/SF$_6$ light fluid layer under reshock conditions are investigated both experimentally and theoretically. Using the soap-film technique, four unperturbed fluid layers with varying thicknesses are generated to analyse the wave dynamics and interface motions during finger collisions; and eight perturbed fluid layers with four thicknesses and two interface phase combinations are created to explore the finger collision mechanism as well as the dependence of collisions on initial conditions. Schlieren photography combined with a high-speed video camera is adopted to capture the shocked and reshocked flows.
Experimental studies and theoretical analyses are conducted for the four unperturbed cases. Compared with the singly shocked scenario that involves only shock–interface interactions, the reshocked case exhibits significantly more complex interactions among shocks, rarefactions, interfaces and the reflecting wall. The wave dynamics in the reshocked case is sensitive to the initial layer thickness. To clarify these phenomena, a 1-D theory is applied, effectively quantifying the motions of layer interfaces, shock waves and rarefaction waves.
The initial condition dependence of finger collisions is examined for the eight perturbed cases. After reshock, the initial in-phase and anti-phase cases experience SBCs and SSCs, respectively. A relatively larger layer thickness allows the downstream interface to reverse phase and develop sufficiently by the time of finger collision. Consequently, the impact forces between the fingers are comparable, resulting in a nearly symmetrical development of the mixing zone. Compared with SBC, SSC greatly inhibits the spike development, resulting in significant growth attenuation of amplitudes and mixing widths. For the smaller thickness cases, the downstream interface has not completed phase reversal by the time of collision, causing the fingers at the upstream interface to dominate in SBC or SSC. In particular, the SSC prevents the downstream interface from reversing its phase, giving rise to abnormal RMI. The abnormal RMI reduces the SSC's ability to suppress the perturbation growth. To maximize SSC effectiveness in attenuating growth, the initial layer thickness should be sufficiently large. This ensures that spikes at both interfaces develop adequately, allowing the spikes to fully collide and thereby cancel out their growth.
The effects of rarefaction waves and the second reshock on interface evolution during finger collisions are studied. Rarefaction waves affect the evolution of both interfaces through the Rayleigh–Taylor and stretching effects. Specifically, the Rayleigh–Taylor effect stabilizes the upstream interface while destabilizing the downstream interface, and the stretching effect enhances the amplitudes of both interfaces. Overall, rarefaction waves facilitate the evolution of both interfaces; however, the second reshock exerts an opposing influence. These wave effects are noticeable primarily in cases with larger layer thicknesses, causing oscillations in their nonlinear amplitude growth. Conversely, in cases with smaller thicknesses, the second reshock promptly interacts with the interfaces after the interactions of rarefaction waves, counteracting their influence. Rarefaction waves stretch the fluid layer, increasing the distance between the two interfaces and thereby reducing the intensity of finger collisions. In contrast, the second reshock compresses the layer, enhancing the collision intensity.
Linear and nonlinear models are developed to predict amplitude growth for both interfaces before and after finger collisions. The reshock-induced amplitude growth rate is first estimated using a modified form of the Jacobs-type model (Jacobs et al. Reference Jacobs, Jenkins, Klein and Benjamin1995; Liang & Luo Reference Liang and Luo2022a). Then this growth rate is combined with the pre-reshock growth rate to establish a linear model that effectively describes the whole linear amplitude growth rate. The DR model (Dimonte & Ramaprabhu Reference Dimonte and Ramaprabhu2010) provides good predictions of the RMI-induced nonlinear amplitude growth for both interfaces under SBC and SSC conditions. By quantifying both Rayleigh–Taylor and stretching effects induced by rarefaction waves, along with amplitude compression caused by the second reshock, the oscillations in amplitude growth during finger collisions are predicted successfully.
Funding
This work was supported by the National Natural Science Foundation of China (nos 12302371, 12027801 and 12388101), the Youth Innovation Promotion Association CAS, the Chinese Academy of Sciences Project for Young Scientists in Basic Research (no. YSBR-087), and the Fundamental Research Funds for the Central Universities (no. WK2090000048).
Declaration of interests
The authors report no conflict of interest.