

Introduction
Before an avalanche is released, several tension cracks are formed in the snow-cover near the crest of a mountain slope, and the formation mechanism of the tension cracks has been considered to be due to brittle fracture, based on many tensile-strength measurements of snow (Reference Keeler and WeeksKeeler and Weeks, 1967; Reference KeelerKeeler, 1969; Reference MartinelliMartinelli, 1971; Reference SommerfeldSommerfeld, 1971). This paper describes the results of a detailed study of the deformation behaviour of snow under tension, including modes of crack formation and fracture. It is considered that these forms of mechanical behaviour of snow under tension are very important in understanding properly the initiation mechanism of avalanches.
Experimental apparatus and methods
The apparatus used for the tension tests, shown schematically in Figure 1, could provide different constant deformation rates between 2.5 - 10–9 and 3.1 - 10–3 m s–1. The ascending or falling speed of the rod was controlled by changing the deceleralors, which were directly connected with the rod and the motor, and the reduction ratio between the gears X and Y (Fig. 1). For the tensile tests, 18 different speeds were chosen, ranging from 6.8 - 10–8 to 3.1 - 10–4 m s–1, which corresponded to strain-rates from approximately 5.5 - 10–7 to 2.5 - 10–3 s–1. The tensile forces were measured with load cells with capacities of 2 - 103 N and 5 - 102 N, which were used depending on the snow density. The forces were recorded continuously on a strip chart.

Fig. 1. Schematic diagram of the experimental apparatus. 1. Snow specimen; 2. Load cell; 3. Connector; 4. Ascending rod; 5. Decelerators; 6. Motor.
Snow samples of homogeneous structure, grain shape, and density were obtained from natural snow layers by close inspection of slices about 10 mm thick by transmitted light. The snow was then cut into a cylindrical shape having a diameter of 5 - 10–2 m and a length of 12.5 - 10–2 m. The long axis was chosen to lie in the snow layer.
The snow specimen was fixed by freezing to the two metal connectors, transmitting the force to the load cell and ascending rod. The contact surfaces of the connectors had many circular grooves (1 mm depth) at intervals of 1 mm in order to increase the contact surface area between the snow specimen and the connectors. The values of strain and strain-rate of the specimen were computed from the change of distance between the connectors.
Specimens used were fine-grained old snow of density ranging from 240 to 470 kg m–3. The preparation of specimens and measurements were carried out in a cold laboratory at — 10±2°C. As the temperature of the snow layer from which specimens were cut was almost constant around —3 to —5°C, measurements were conducted after a snow specimen had been kept dry and the snow temperature throughout became — 10°C. Internal structures of snow specimens were observed by making thin sections of snow samples after testing by the method developed by Reference Kinosita and WakahamaKinosita and Wakahama (1960).
Results and considerations
Types of deformation of snow
When a snow sample is under tension, a resisting force arises with increasing deformation. The shape of the resisting force-strain curve is determined essentially by the deformation speed and the density of snow. Typical curves obtained are shown in Figure 2; in these tests the snow was elongated up to a maximum strain of 23% when no rupture occurred, but most specimens were elongated up to a strain of 15-20%.

Fig. 2. Typical resisting force-strain curves. Type a, strain-rate 8.33- 10–4 s–1, density 370 kg m –3. Type b, strain-rate 9.15 - 10–5s–1, density 298kgm–3. Type c, strain-rate 2.96 - 10 –5 s–1, density 445 kg m–3. Type d, strain-rate 9.54- 10–7 s–1, density 337 kg m–3.
Type a refers to a brittle fracture. The resisting force increased linearly with increasing strain to result in rupture. Most of the fracture took place in the central part of a cylindrical specimen, lying in a plane perpendicular to its long axis. The fracture pattern was characterized by a fracture accompanying the rapid growth of a crack without plastic deformation.
In type b, snow specimen did not rupture even when the force passed through a critical point C, at which the force deviated from a linear relation. The force became almost constant after passing through the critical point and began to decrease at point K because of the growth of invisible small cracks. Catastrophic fracture of the snow took place when the strain was about 6.9%. Just before rupture many small cracks appeared throughout the entire specimen (Fig. 3).

Fig. 3. Photograph of cracks. The arrows show the direction of elongation.
In type c, the deformation behaviour is similar to that of type b at lower strains but at point G two or three of the many small cracks described above grew larger. As a result, the resisting force decreased rapidly. In these two cases (types b and c), the snow can be said to have behaved as a ductile material, since the fracture was characterized by gradual crack growth after considerable plastic deformation. The Poisson ratio during deformation was about 0.18.
In type d, no maxima of the resisting force nor cracks were observed. However, if the specimen continues to be strained it will finally fracture, possibly in a ductile manner. Photographs of snow specimens of each deformation type are shown in Figure 4.

Fig. 4. Photographs of snow specimens at the final stage of tests. a, b, c, and d correspond to types a, b, c, and d in Figure 2.
Maximum strength of snow
The relations between the maximum strength and the strain-rate are shown in Figure 5, together with the deformation types. The maximum strength is defined in this paper as σmax =P m⁄A, where Pm is the largest resisting force in a curve, as shown in Figure 2, and A is the area on which the force acts. The dotted curves A, B, C, D, and E in Figure 5 are equi- density lines of about 300, 330, 370, 410, and 445 kg m–3, respectively. It was found that the maximum strength had maxima in the range of about 1 - 10–4 to 2 - 10–5 s–1 of the strain-rate. The peaks have a tendency to shift towards lower strain-rates with increase in the density.
It is clear from Figure 5 that the deformation types are specified by the ranges of strain- rate; brittle fracture (type a) took place at strain-rates above about 1 - 10–4 s–1. Ductile behaviour, which is shown by two different deformation modes (b and c), is located in the range from about 2 - 10–4 to 5.5-10–7s–1. Type b is located in the narrow range from 2 - 10–4 to 7 - 10–5 s–1 but it is partly superposed on the brittle fracture. A point belonging to type b is at a strain-rate of 1.6 - 10–5 s₋1, which is outside the above range. This deviation is considered to have been caused by nuclei for the rupture which were probably formed during the preparation stage of the specimen.
Type c is found in the range of about 7 - 10–5 to 5.5 - 10–7 s–1. Type d is shown by the data of three specimens at strain-rates less than 9.5 - 10–7s–1. Their densities were 295, 305, and 335 kg m–3. But the snow of higher density deformed in type c at the same range of strain-rate.
The strain-rate at the maximum strength (Fig. 5) is plotted as a function of the density in Figure 6. The boundaries dividing deformation types are represented by dotted lines.
Formation of small cracks in snow
It is important to know at which stage small cracks appear, since the cracks can be nuclei of the failure of snow, thus causing avalanching. Strains at which small cracks appeared are plotted against the strain-rate in Figure 7. The strain was obtained by measuring the elongation up to the rupture in the case of brittle fracture, and up to the beginning of the decrease in the resisting force in case of ductile fracture and deformation. A strong dependence is found between the strain and the strain-rate.

Fig. 5. Relations between the maximum strength and the strain-rate. Deformation types are specified by the symbols: ![]() (type a),
(type a), ![]() (type b),
(type b), ![]() (type c), and
(type c), and ![]() (type d).
(type d).
In the case of brittle fracture, the strain was almost constant within a range of 0.3-0.7%. In the other cases, the strain increased with decreasing strain-rate. At strain-rates of 10–4, 10–5, and 10–6 s–1, the strains were about 3, 10, and 13% respectively.
Internal structures of snow
When snow specimens were deformed to a large amount under tensile force, many small cracks appeared. Thin sections of snow which were elongated to about 13% at strain-rates of 7.7 - 10–6 s–1 and 9.5 - 10–7 s–1 are shown in Figure 8(a) and (b), respectively. Some of the long and narrow voids lying in the plane perpendicular to the long axis of the specimen are small cracks; they are shown by small arrows in the photographs. Their average diameters and lengths were about 1-2 mm and 5-6 mm, respectively. In the above examples, the sizes of cracks at smaller strain-rates were smaller than those at larger strain-rales but the numbers increased at smaller strain-rates. This was the general tendency in the present tests. Reference Kinosita and WakahamaWakahama (1960) observed different deformation modes in bonds and grains in compressive tests of thin sections of snow. The detailed observation of the above thin sections under tension did not show such different modes; in the tensile tests, fracture occurred mostly at the crystal boundaries (intercrystalline fracture). However, elongated ice bonds were noted to appear around a crack which opened largely at larger deformations (Fig. 8(c)). These facts suggest that bonds in snow are preferentially cut initially rather than elongated.

Fig. 6. Plot of the strain-rate against the density. The meaning of the symbols is the same as in Figure 5.
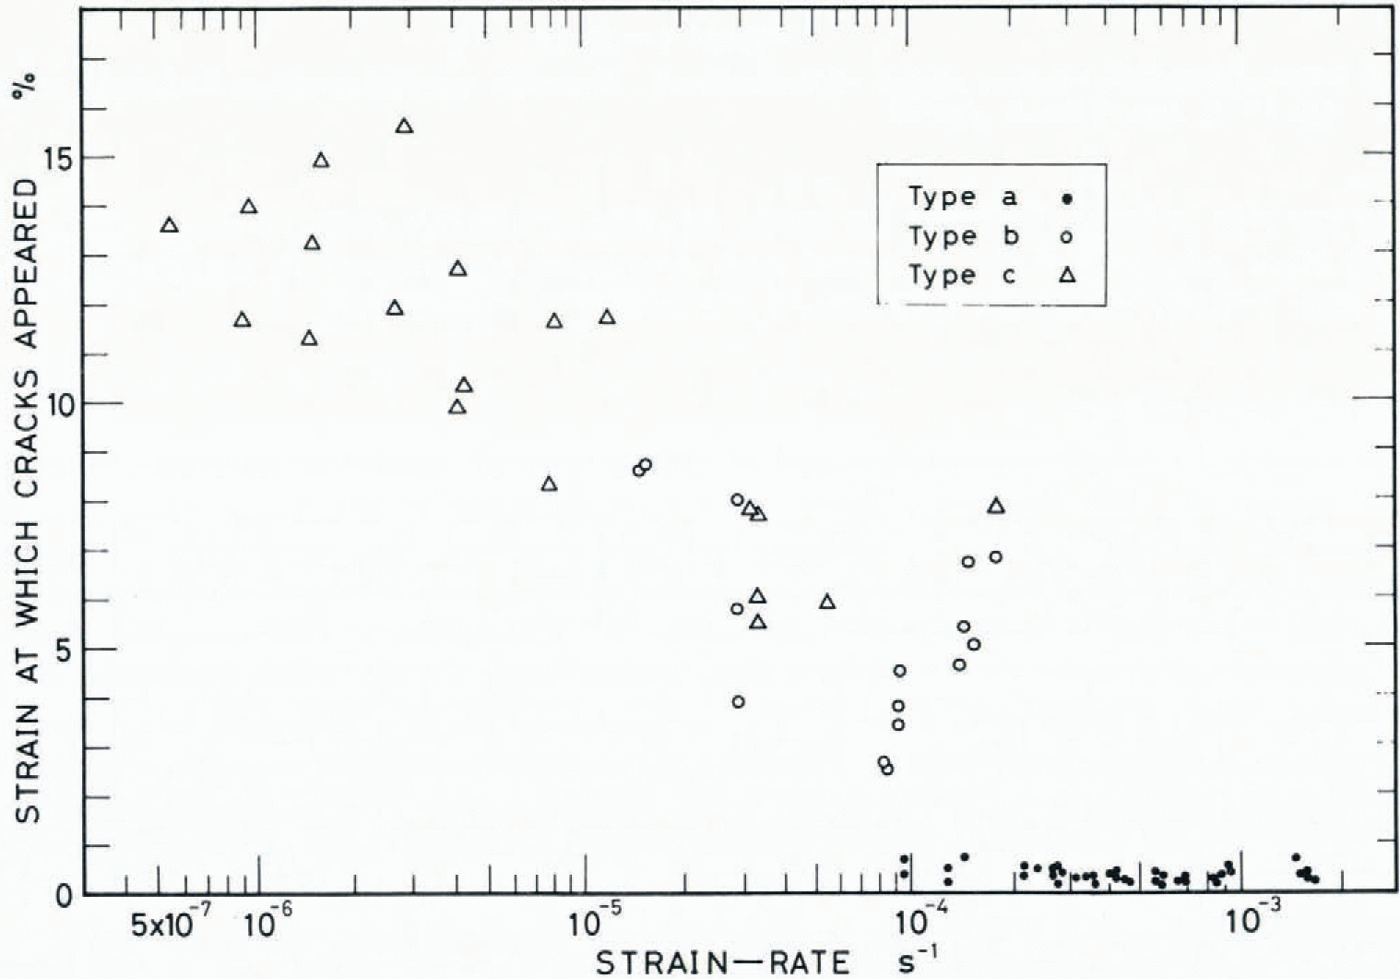
Fig. 7. Relations between the strain when cracks appeared and the strain-rate.

Fig. 8. Thin sections of snow in the type c deformation. The arrows show the direction of elongation. (a) Strain-rate 9.5 - 10–7 s–1, Strain 13.6%, density 440 kg m–3 (b) Strain-rate 7.7 - 10–6s–1, strain 13.3%, density 410 kg m–3. (c) Strain- rate 4.1 - 10–6 s–1, strain 12.7%, density 425 kg m–3.

Fig. 9. Thin section of snow sample under the natural tensile conditions in the vicinity of a tension crack on a mountain slope. The arrows show the direction of maximum inclination of the slope.
A photograph of a thin section of natural snow under tension on a mountain slope is shown in Figure 9. The sample was collected in the vicinity of a tension crack in the snow-cover in a frequent avalanche path. Some long and narrow voids are seen in the photograph; these lie in a plane perpendicular to the direction of maximum angle of inclination of the slope. Their features are similar to those of the small cracks observed in the present tensile tests of snow.
Concluding remarks
When snow was deformed under tensile stress, various deformation types were found at different strain-rates. Namely, the snow behaved as a brittle material at higher strain-rates and as a ductile material at lower strain-rates. The critical value of strain-rate dividing the two types depended principally on the density and possibly on temperature. The transition between brittle and ductile deformations lies at a strain-rate around 10–4s–1; it becomes smaller for larger densities. Brittle deformation was a rupture which took place by rapid growth of a crack. On the other hand, in ductile deformation, many small cracks appeared throughout the entire snow specimen after considerable plastic deformation. Ductile deformation was divided into two types: one in which catastrophic fracture took place at a strain of 6—14% after considerable plastic deformation, and the other in which several small cracks grew gradually with increasing strain but without catastrophic fracture.
Maximum strength increased with decreasing strain-rate in both brittle and catastrophic fracture, but it decreased with decreasing strain-rate in ductile deformation. The maximum strength had a peak at a strain-rate around 10–5s–1. The strain-rate dependence of the fracture and maximum strength varied with temperature, snow qualities, etc., and further experimental studies are required before the detailed mechanism of the deformation of snow is clarified.
Acknowledgements
The author is grateful to Dr N. Maeno of the Institute of Low Temperature Science, Hokkaido University, for his helpful suggestions and for critically reading the manuscript. The author is also grateful to Mrs S. Nagayama for her typing and preparation of the photographs, to Dr S. Takikawa, Director of the Research and Training Forest of Hokkaido University, Teshio District, and his colleagues for their logistic support at the Avalanche Research Station.


