Introduction
We present a new transport algorithm to compute the evolution of the surface of a glacier for a given mass-balance input. The algorithm is mass-conserving to a high accuracy and it is stable and efficient for a large range of glacier geometries.
Several three-dimensional ice-sheet models based on the shallow-ice approximation apply finite differences for the computation of the flow and temperature fields, and for the surface evolution (Huybrechts and others, 1997). Similarly, three-dimensional glacier models applying higher-order mechanics have been introduced (Reference Albrecht, Jansson and BlatterAlbrecht and others, 2000; Reference PattynPattyn, 2003; Reference Saito, Abe-Ouchi and BlatterSaito and others, 2006), that apply finite-difference methods. With the availability of versatile packages, further glacier models applied finite elements to obtain full Stokes solutions of three-dimensional ice flow (Reference GudmundssonGudmundsson, 1999; Reference Zwinger, Greve, Gagliardini, Shiraiwa and LylyZwinger and others, 2007; Reference Gagliardini and ZwingerGagliardini and Zwinger, 2008). Mesh generation is still a demanding task and, thus, three-dimensional models with a moving surface that apply finite elements or finite volumes have emerged only recently (Reference Martán, Navarro, Otero, Cuadrado and CorcueraMartín and others, 2004; Reference ReistReist, 2005; Reference Deponti, Pennati, de Biase, Maggi and BertaDeponti and others, 2006). The requirement to adapt the mesh every time-step may cause problems at ice margins with large curvature or with steep bed slopes.
In this paper, we propose a different approach for handling the surface evolution of a glacier. The presence of ice is indicated by a volume of fluid (VOF) function, which takes the value of 1 inside and 0 outside the glacier. This description allows the geometry of the glacier to change its topology. The full Stokes solution of the flow field is computed on a fixed unstructured mesh, and the varying surface is computed on a fixed and regular Cartesian grid with high resolution, by solving an equation for the mass transport for the VOF function. Two mass-conserving post-processing steps prevent numerical diffusion and numerical compression. The surface mass balance is taken into account by adding a source term to the transport equation.
In the next two sections, we outline the theoretical foundation of the transport equation and describe the numerical methods used to solve the free-boundary problem. Then an application of the method to various reconstructed states of Vadret Muragl in the eastern Swiss Alps demonstrates the possibilities of the model.
Modelling
Velocity and pressure fields
Let ![]() be a box containing the domain of ice Ω(t) occupied by a glacier when time t varies from 0 to T. The volume, Ω(t), is bounded by the base,
be a box containing the domain of ice Ω(t) occupied by a glacier when time t varies from 0 to T. The volume, Ω(t), is bounded by the base,
and the ice–air interface:
where B(x, y) and S(t, x, y) are functions defined for ![]() (Fig. 1).
(Fig. 1).
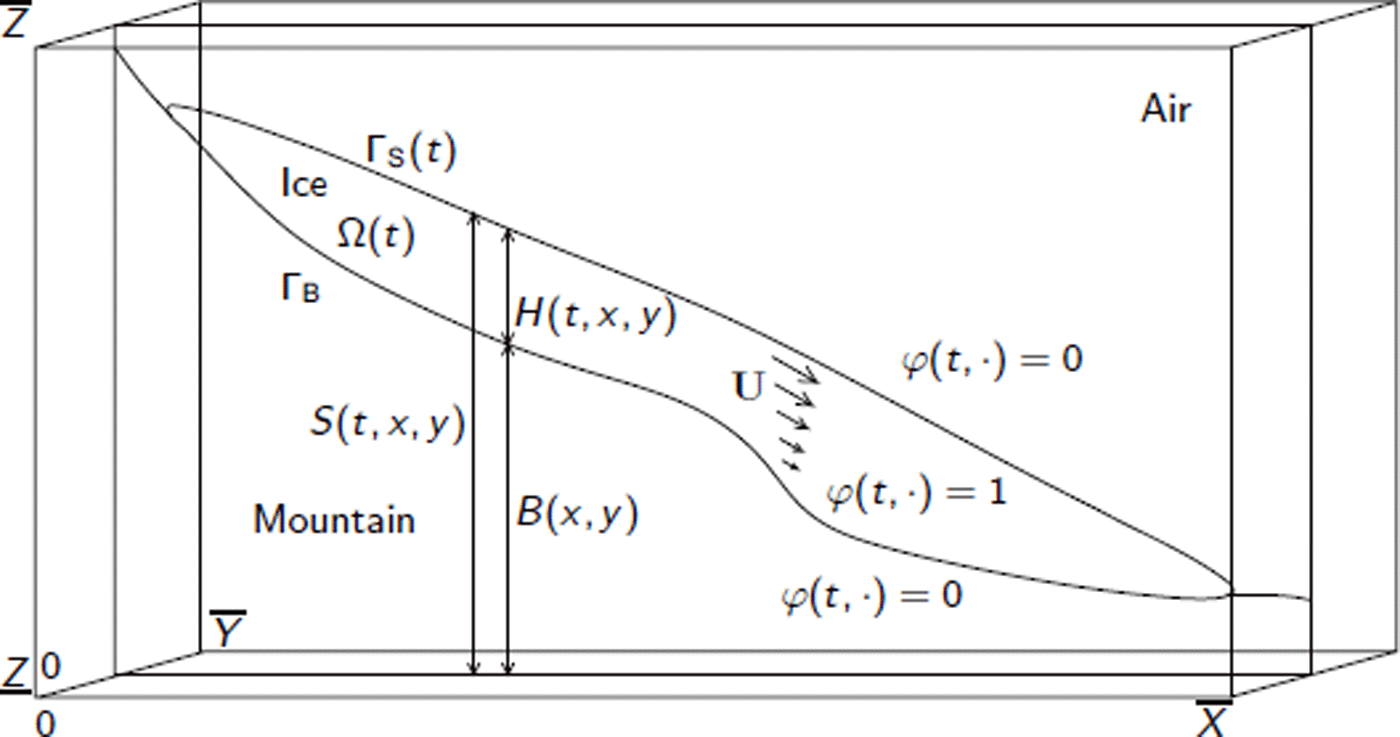
Fig. 1. The box, Λ, showing altitude of ice base, B, ice thickness, H, and ice velocity, U. The ice domain, surface and base are denoted by Ω, ΓS and ΓB, respectively, and φ is the VOF function.
When the ice domain, Ω(t), is known, the velocity, U = (u, v, w), and pressure, p, satisfy the incompressible stationary Stokes equations in Ω(t) (Reference GlenGlen, 1958):
where ε(U) = 0.5 (∇U + ∇U t ) is the strain tensor, ρ is the ice density and g is acceleration due to gravity. The viscosity, μ(U), in Equation (3) is defined as being the unique solution of
where ![]() , A is the rate factor and
, A is the rate factor and ![]() is Glen’s exponent. The term σ
0 is a regularization of Glen’s flow law to prevent infinite viscosity at vanishing effective stress (Reference NyeNye, 1953; Reference GlenGlen, 1958; Reference MeierMeier, 1958). No slip conditions are applied on the mountain base:
is Glen’s exponent. The term σ
0 is a regularization of Glen’s flow law to prevent infinite viscosity at vanishing effective stress (Reference NyeNye, 1953; Reference GlenGlen, 1958; Reference MeierMeier, 1958). No slip conditions are applied on the mountain base:
A zero force condition holds on the ice–air interface:
where v is the normal outwards vector along ΓS(t).
A Eulerian formulation for the transport of ice
Several procedures (e.g. Reference Scardovelli and ZaleskiScardovelli and Zaleski, 1999) may be used to compute the motion of the ice–air free surface, ΓS(t), and consequently to determine the domain, Ω(t). Two classes of methods can be distinguished: Lagrangian methods and Eulerian methods. The principle of Lagrangian methods is to track each point of the ice–air free surface, while Eulerian methods introduce a new variable, φ, defined in the whole box, Λ, from which the position of the ice–air interface is obtained.
Two models describing the motion of the ice region are presented here. The first is the most often used currently in the field of glaciology (Reference Picasso, Rappaz, Reist, Funk and BlatterPicasso and others, 2004; Reference Deponti, Pennati, de Biase, Maggi and BertaDeponti and others, 2006) and is a Lagrangian method. The second adopts the Eulerian viewpoint which allows possible changes of topology.
Let b(t, x, y, z) be the thickness of a layer of ice added (accumulation) or removed (ablation) during a given time-step. This function may depend on the position, (x, y, z), and time, t. However, in all examples presented in this paper, it is assumed to be only a function of the altitude, z = z(x, y), of the ice surface (b = b(t, z) in what follows).
The Lagrangian model: Saint-Venant
The thickness of the ice is given by H(t, x, y) = S(t, x, y) − B(x, y), where S and B are the elevations of the ice surface and bed, respectively. The mass balance of a vertical column (Reference Picasso, Rappaz, Reist, Funk and BlatterPicasso and others, 2004; Reference Deponti, Pennati, de Biase, Maggi and BertaDeponti and others, 2006) yields the Saint-Venant equation,

where

and ![]() is defined correspondingly.
is defined correspondingly.
The Eulerian model: volume of fluid
Among the Eulerian methods, the level-set approach is most common (Reference Osher and FedkiwOsher and Fedkiw, 2001). It has been used to describe the changes of glacier surfaces by Reference Pralong, Funk and LüthiPralong and others (2003). In this paper, the VOF method is preferred to follow the changes of the domain of ice, Ω(t) (Reference Scardovelli and ZaleskiScardovelli and Zaleski, 1999). The level-set method defines the free boundary by the level line of a smooth function, whereas the VOF method uses a discontinuous function. The VOF fraction, φ, is defined in the box, Λ, by:

This method has already been used to simulate Newtonian and viscoelastic flows with complex free surfaces (Reference Maronnier, Picasso and RappazMaronnier and others, 2003; Reference Bonito, Picasso and LasoBonito and others, 2006). With a given local mass balance, we now derive an equation for φ that is compatible with Equation (8).
At time t, consider an arbitrary volume, V, containing part of the ice–air interface (ΓS(t) ∩ V ≠ ∅) The mass difference in the volume, V, between time t and t + Δt is given by:
Assuming that the divergence-free velocity field, U, can be extended smoothly in the box, Λ, the mass flux and the mass budget between t and t + Δt on the ice–air interface is given by

where ∂V is the boundary of V and v is the unit normal outwards to ∂V. Considering the equality of quantities (11) and (12) and applying the divergence theorem, we obtain, when Δt goes to zero,

Since U is divergence-free, we obtain
where ![]() is the three-dimensional Dirac delta function on the surface ΓS(t). Since φ(t, x ,y, z) is discontinous at ΓS(t) U ΓB, its derivatives with respect to time and space in Equation (14) must be understood in a weak sense. (Refer to appendix A of Reference Cottet and KoumoutsakosCottet and Koumoutsakos (2000) for a precise mathematical definition of weak derivatives and weak solutions for transport problems.)
is the three-dimensional Dirac delta function on the surface ΓS(t). Since φ(t, x ,y, z) is discontinous at ΓS(t) U ΓB, its derivatives with respect to time and space in Equation (14) must be understood in a weak sense. (Refer to appendix A of Reference Cottet and KoumoutsakosCottet and Koumoutsakos (2000) for a precise mathematical definition of weak derivatives and weak solutions for transport problems.)
Relation to the Saint-Venant equation
It can be shown that the model (14) includes the Saint-Venant model (8) in the following sense: if φ is a solution of (14) and if H(t, x, y) is the thickness of the glacier defined by

then H(t, x, y) is the solution of Equation (8). This is the consequence of a formal integration of Equation (14) from ![]() to
to ![]() (Fig. 1). Note that φ can be deduced from H using the following relation:
(Fig. 1). Note that φ can be deduced from H using the following relation:

The VOF model strictly includes the Saint-Venant model. Furthermore, the VOF function can describe ice cliffs and overhanging ice.
Summary of the model
Let Ω(0) be the initial domain of the glacier and φ(0, x, y, z) be the corresponding VOF deduced using Equation (10), then the problem is to find a set of (φ, U, p) that satisfies the advection problem, Equation (14), and the elliptic problem, Equations (3–7), with the initial condition φ(0, x, y, z).
Numerical Method
Let ![]() be a uniform subdivision of the time interval [0, T], ti
= i Δt, where
be a uniform subdivision of the time interval [0, T], ti
= i Δt, where ![]() is the time-step. Assume that φn
, U
n
and pn
, approximations of φ, U and p at time tn
, are available. We now describe how φn
+1, U
n
+1 and pn
+1 are computed.
is the time-step. Assume that φn
, U
n
and pn
, approximations of φ, U and p at time tn
, are available. We now describe how φn
+1, U
n
+1 and pn
+1 are computed.
Time-splitting scheme for Equation (14)
Suppose φn is known, then the numerical method for solving Equation (14) between time tn and time tn +1 consists of two parts.
Firstly, we solve Equation (14) without the interface term on the right-hand side using a forward characteristic method (Reference PironneauPironneau, 1989). Let ![]() denote an approximation of the solution at time tn
+1 of :
denote an approximation of the solution at time tn
+1 of :

The method of characteristics states that the solution of Equation (17) is constant along the trajectories of the fluid particles which are given by x′(t) = U
n
(x(t)), where x(t) = (x(t), y(t), z(t)). Using x(tn
) + Δt
U
n
(x(tn
)) as an approximation of x (tn
+1), we define ![]() to satisfy:
to satisfy:
Secondly, we solve Equation (14) without the advection term. Let φn +1 denote an approximation of the solution at time tn +1 of:

This step corresponds to ice accumulation or ablation. Using relations (15) and (16), solving Equation (19) is equivalent to solving

where ![]() is the ice thickness deduced from
is the ice thickness deduced from ![]() using Equation (15). An approximation of the solution of Equation (20) at tn
+1 is given explicitly by
using Equation (15). An approximation of the solution of Equation (20) at tn
+1 is given explicitly by
Finally, φn +1 is deduced from Hn +1 using Equation (16).
Space discretization
Two different meshes are used (Fig. 2) to take into account the various specifications of the advection and elliptic problems. These two meshes are fixed and are not changed during the computations.
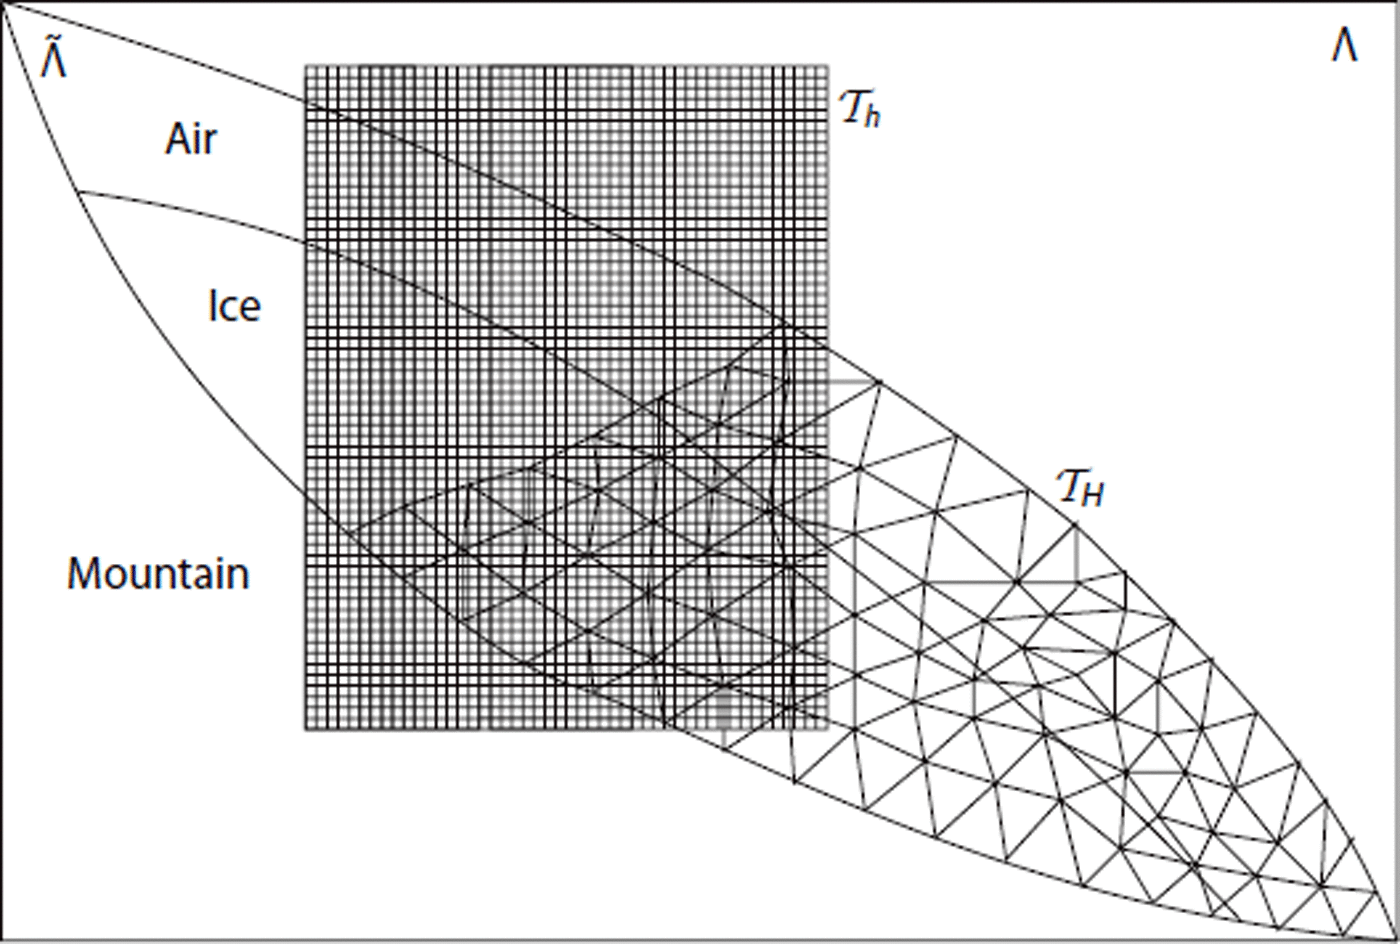
Fig. 2. Sections of the two meshes: ![]() is an unstructured mesh while
is an unstructured mesh while ![]() is a structured grid of rectangular cells.
is a structured grid of rectangular cells.
We start by choosing a fixed domain, ![]() , in which
, in which ![]() for all time, t. As the solution of the elliptic problem, Equations (3–7), is smooth, a coarse mesh,
for all time, t. As the solution of the elliptic problem, Equations (3–7), is smooth, a coarse mesh, ![]() , with a typical size, H, of the tetrahedrons is chosen in
, with a typical size, H, of the tetrahedrons is chosen in ![]() to solve the equations for pressure and velocity fields. Since the shape of a glacier is shallow, the mesh,
to solve the equations for pressure and velocity fields. Since the shape of a glacier is shallow, the mesh, ![]() , can be chosen to be anisotropic with comparable numbers of nodes along the vertical and horizontal directions. The solution of Equations (3–7) is described in detail in the next subsection.
, can be chosen to be anisotropic with comparable numbers of nodes along the vertical and horizontal directions. The solution of Equations (3–7) is described in detail in the next subsection.
A fine-structured grid of cubic cells, ![]() , with cell size h is used to implement Equation (18). The reasons for using another grid,
, with cell size h is used to implement Equation (18). The reasons for using another grid, ![]() , rather than
, rather than ![]() are that, firstly, the method of characteristics can be easily implemented on structured grids whereas the implementation becomes more tedious on unstructured grids, and, secondly, solving Equation (18) on a fine grid,
are that, firstly, the method of characteristics can be easily implemented on structured grids whereas the implementation becomes more tedious on unstructured grids, and, secondly, solving Equation (18) on a fine grid, ![]() , on size h < H enables us to localize the interface with greater accuracy. A recommended ratio between the size of meshes is around five, H ≈ 5h.
, on size h < H enables us to localize the interface with greater accuracy. A recommended ratio between the size of meshes is around five, H ≈ 5h.
Algorithm
Let ![]() and
and ![]() denote the values of φn
and U
n
at the middle of cell (ijk) of the structured grid,
denote the values of φn
and U
n
at the middle of cell (ijk) of the structured grid, ![]() . The computation of
. The computation of ![]() and
and ![]() is described in the following.
is described in the following.
Solving Equation (17)
Using Equation (18), the advection step on cell number (ijk) consists in advecting ![]() by
by ![]() and projecting the values onto the structured grid. The projection holds proportionally to the rate of overlapping. An example of cell advection and projection is shown in Figure 3 in two space dimensions (Reference Maronnier, Picasso and RappazMaronnier and others, 2003).
and projecting the values onto the structured grid. The projection holds proportionally to the rate of overlapping. An example of cell advection and projection is shown in Figure 3 in two space dimensions (Reference Maronnier, Picasso and RappazMaronnier and others, 2003).
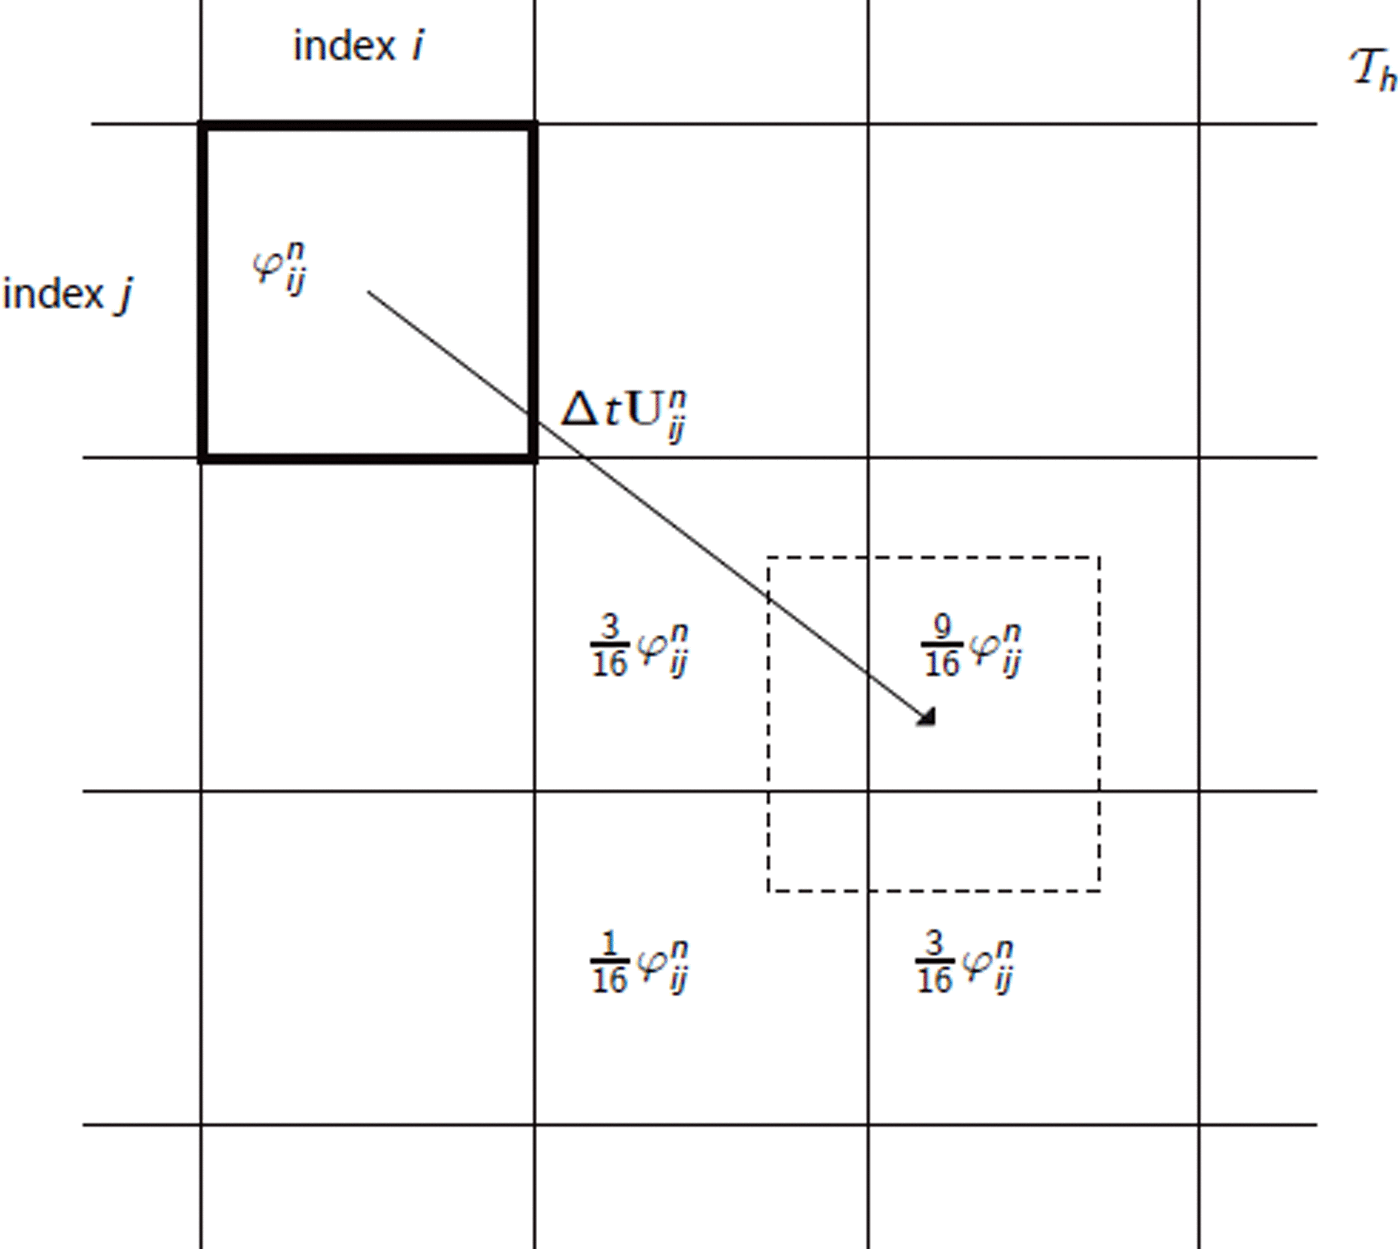
Fig. 3. An example of two-dimensional advection of ![]() (bold line) by
(bold line) by ![]() , and projection on the grid. The four cells containing the advected cell (dotted line) receive a fraction of
, and projection on the grid. The four cells containing the advected cell (dotted line) receive a fraction of ![]() , determined by the covered area.
, determined by the covered area.
Let ∥U max∥Δt/h be the Courant–Friedrichs–Lewy (CFL) number. With this method of characteristics, CFL numbers >1 can be used. In all model runs presented here, the time-step, Δt, and the cell spacing, h, were chosen such that 3 ≤ CFL ≤ 5. This ensures that no more than five cells are crossed during one time-step. Numerical experiments, reported by Reference Maronnier, Picasso and RappazMaronnier and others (2003), have shown that this choice is a good trade-off between numerical diffusion and computational costs or memory requirements.
Post-processing
The previous algorithm causes two problems. The first is that numerical diffusion (Fig. 4) is introduced during the projection step. The second occurs when the time-step is too large, since two cells may arrive at the same place, producing numerical compression. Two post-processing steps (Reference Maronnier, Picasso and RappazMaronnier and others, 2003) are implemented so that the VOF is approximated by a step function between 0 and 1. The first post-processing step is the simple line interface calculation (SLIC) algorithm presented by Reference Scardovelli and ZaleskiScardovelli and Zaleski (1999) which reduces numerical diffusion. Figure 4 shows the numerical diffusion of a projection step and the efficiency with which the SLIC algorithm suppresses this diffusion in a simple example. The second step removes artificial compression and forces the VOF to be ≤1. When using these two post-processing algorithms, it is observed that the width of the diffusion layer through the interface almost never exceeds one cell.
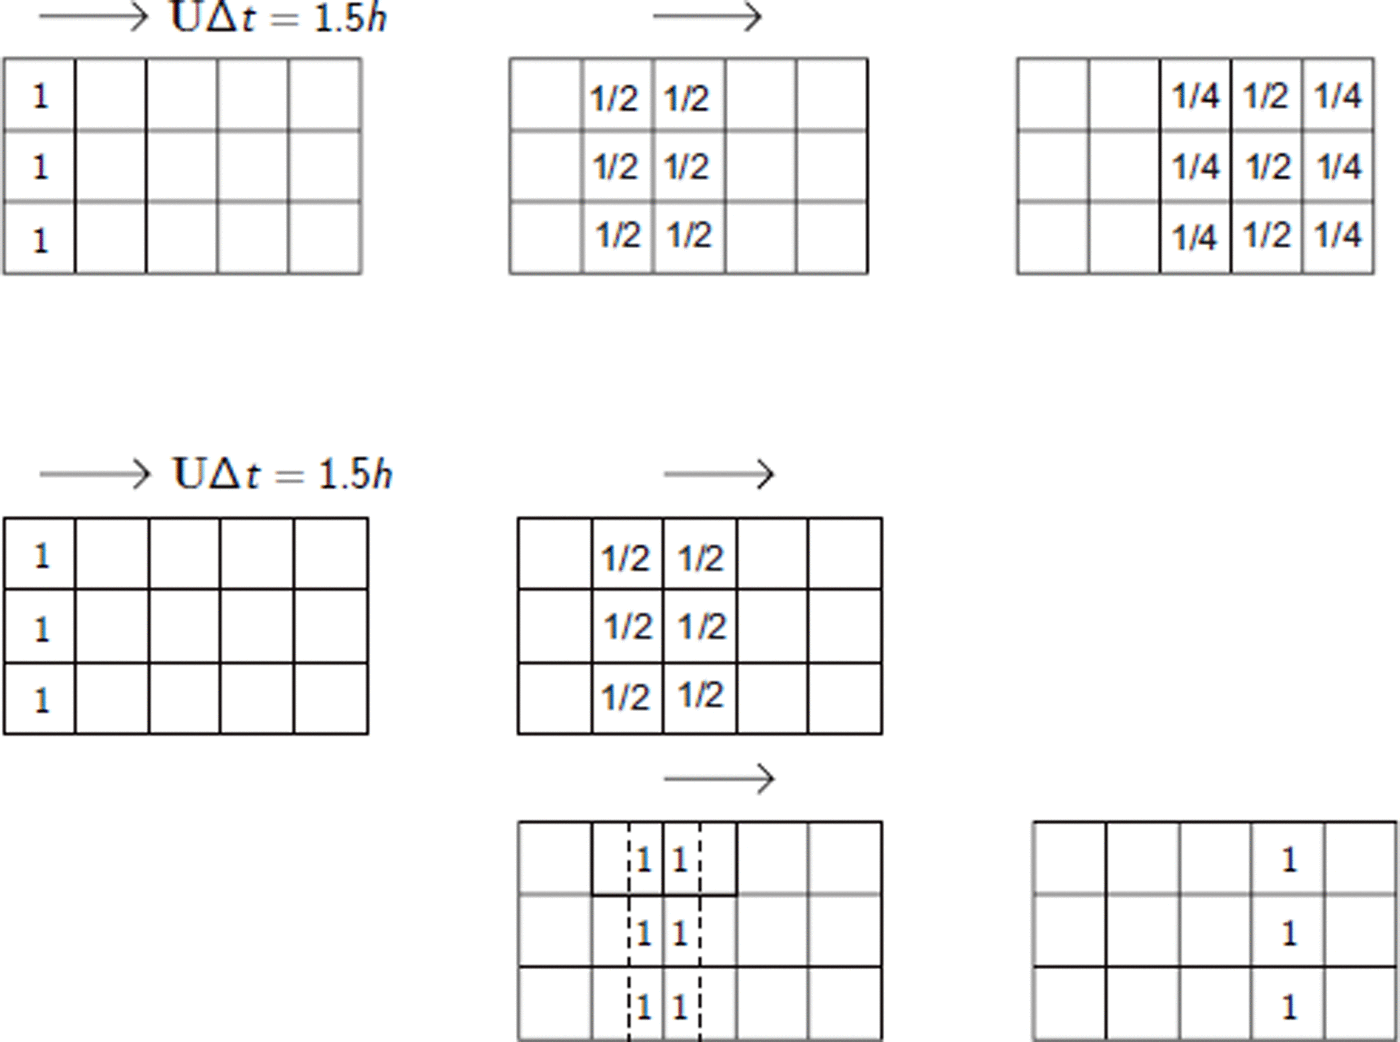
Fig. 4. Top line: The horizontal velocity, U, is chosen such that one half cell is crossed during one time-step. Numerical diffusion increases rapidly. Bottom lines: reducing numerical diffusion using the SLIC algorithm.
Solving Equation (19)
The process described in the following holds for each vertical column, (ij), of the structured grid, ![]() . The first task is to compute the height of ice,
. The first task is to compute the height of ice, ![]() . Using the rectangle formula for evaluating Equation (15), we set
. Using the rectangle formula for evaluating Equation (15), we set

According to Equation (21), the amount of ice that has to be added or removed is ![]() , where (xi
, yj
) are the horizontal coordinates of the center of the column, (ij). We denote by
, where (xi
, yj
) are the horizontal coordinates of the center of the column, (ij). We denote by

the number of cells to be filled (Iij
> 0) or to be emptied (Iij
< 0). We then find the largest vertical index, k, such that ![]() and
and ![]() . Afterwards, the filling is carried out from bottom to top while the emptying is carried out from top to bottom until |Iij| vanishes. The algorithm is illustrated in Figure 5 and is written as follows:
. Afterwards, the filling is carried out from bottom to top while the emptying is carried out from top to bottom until |Iij| vanishes. The algorithm is illustrated in Figure 5 and is written as follows:


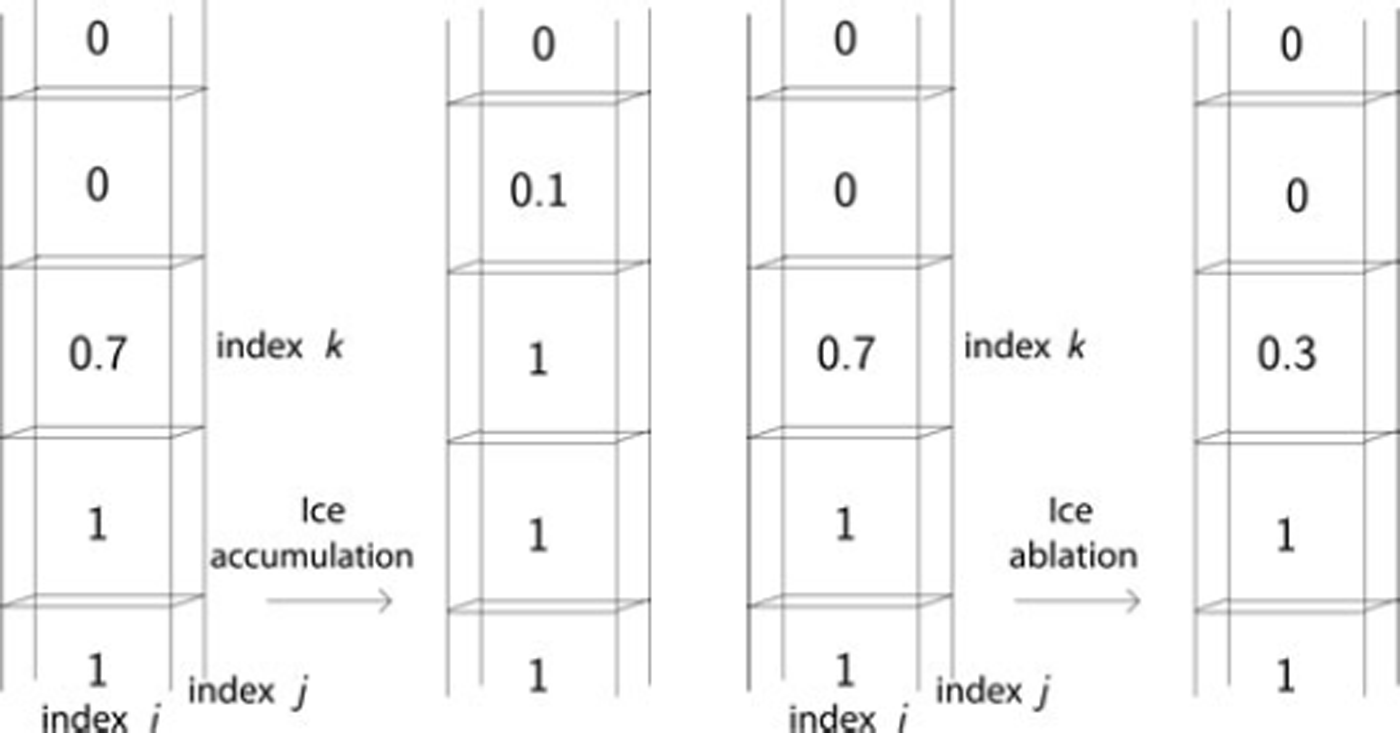
Fig. 5. VOF filling (on the left) and VOF emptying (on the right) of cells having index (ij). On the left, Iij = 0.4 means that 0.4 VOF has to be added starting from cell (ijk). In the same way, Iij = −0.4 on the right means that 0.4 VOF has to be subtracted.
Interpolation of φn
+1 on  and definition of
Firstly the VOF φn
+1, previously computed on the structured mesh ![]() , must be interpolated on
, must be interpolated on ![]() (see, e.g., Maronnier and others, Reference Maronnier, Picasso and Rappaz2003). The VOF
(see, e.g., Maronnier and others, Reference Maronnier, Picasso and Rappaz2003). The VOF ![]() at vertex P of the unstructured mesh
at vertex P of the unstructured mesh ![]() is computed by considering all the cells (ijk) contained in the union of tetrahedrons containing vertex P (Fig. 6).
is computed by considering all the cells (ijk) contained in the union of tetrahedrons containing vertex P (Fig. 6).
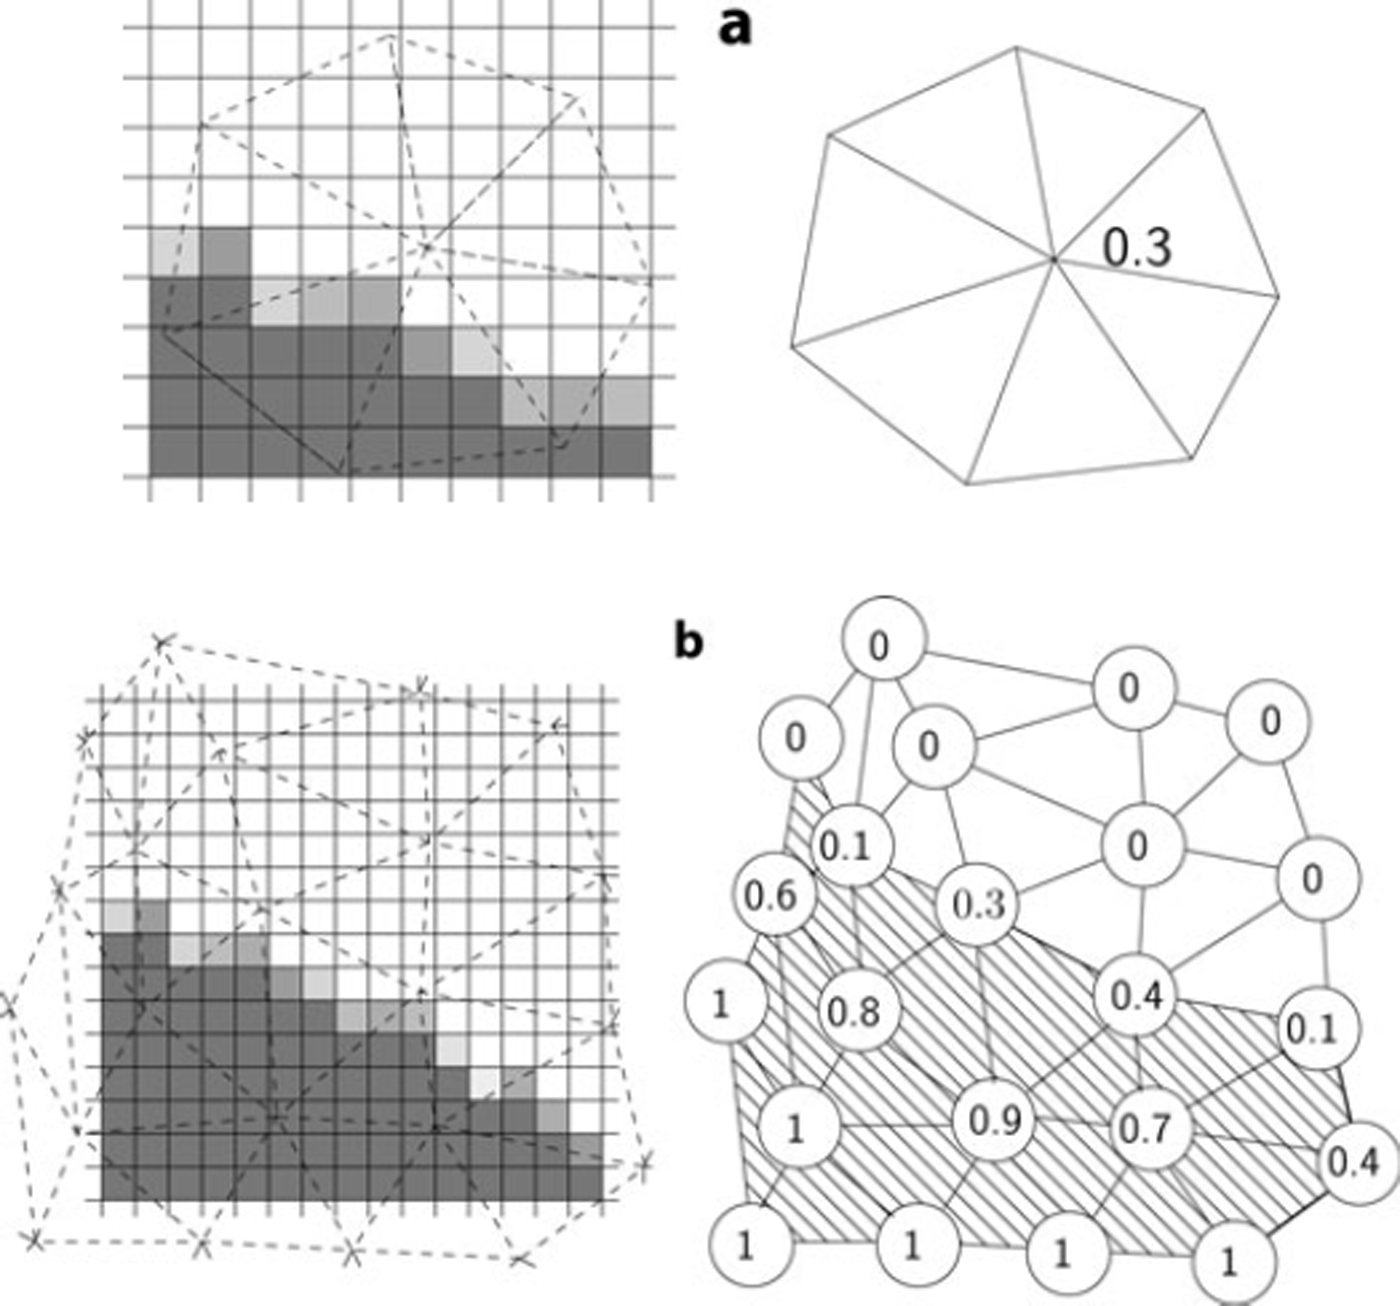
Fig. 6. (a) Interpolation of the VOF function to the vertices of the unstructured mesh ![]() . On the left, the VOF is represented at each cell of T
h
by a nuance of gray (from white if VOF = 0 until dark gray if VOF = 1). On the right, the interpolation procedure gives the value 0.3 to the VOF at the consided node. (b) Definition of the computational domain in mesh
. On the left, the VOF is represented at each cell of T
h
by a nuance of gray (from white if VOF = 0 until dark gray if VOF = 1). On the right, the interpolation procedure gives the value 0.3 to the VOF at the consided node. (b) Definition of the computational domain in mesh ![]() . On the right, the values of the VOF at vertices designate the pattern area to be the computational domain.
. On the right, the values of the VOF at vertices designate the pattern area to be the computational domain.
Secondly, the mesh ![]() being fixed in time, the new computational domain,
being fixed in time, the new computational domain, ![]() , for Equations (3–7) must be redefined. A tetrahedron is defined as ice filled at time tn
+1 if at least one of its vertices, P, is such that
, for Equations (3–7) must be redefined. A tetrahedron is defined as ice filled at time tn
+1 if at least one of its vertices, P, is such that ![]() . The computational domain,
. The computational domain, ![]() , is then defined to be the set of all ice-filled elements. We denote by
, is then defined to be the set of all ice-filled elements. We denote by ![]() the union of nodes of
the union of nodes of ![]() localized on the boundary of
localized on the boundary of ![]() which are not on ΓB (Fig. 6). In practice, the use of the SLIC algorithm ensures that the VOF jumps from zero to one in a region of width H. Consequently, the result,
which are not on ΓB (Fig. 6). In practice, the use of the SLIC algorithm ensures that the VOF jumps from zero to one in a region of width H. Consequently, the result, ![]() , is not sensitive to the arbitrariness of the criterion
, is not sensitive to the arbitrariness of the criterion ![]() .
.
Solving Equations (3–7)
Given the new ice domain, ![]() , a fixed-point algorithm is used to solve the non-linear problem, Equations (3–7). The pressure and velocity fields computed at the previous time-step are chosen as the starting point for the iteration. The process is summarized as follows:
, a fixed-point algorithm is used to solve the non-linear problem, Equations (3–7). The pressure and velocity fields computed at the previous time-step are chosen as the starting point for the iteration. The process is summarized as follows:
-
* Let (U 0, p 0) = (U n , p n ) if n ≥ 1, otherwise (0,0).
-
* For k = 0, 1, 2, 3, … until convergence: Find (U k+1, p k+1) such that

where μ(U k ) is computed solving Equation (5) with Cardan’s formula if
 . Otherwise, a Newton method can solve Equation (5) for every
  . The above set of equations is solved using a stabilized continuous, piecewise-linear finite-element method (Reference Franca and FreyFranca and Frey, 1992), which ensures the velocity field satisfies ∇ · U
k
= O(H).
 -
* Set
 .
.
As shown by Reist (Reference Reist2005), convergence of this fixed-point algorithm can be proven, provided the starting point is close enough to the solution. Moreover, it can be shown that the rate of convergence depends on ![]() , where
, where ![]() is the Glen’s flow-law exponent defined in Equation (5).
is the Glen’s flow-law exponent defined in Equation (5).
Interpolation of U
n+1 on 
The solution of the above problem yields a new velocity field, U
n
+1, on the new domain, ![]() . Then the values are linearly interpolated at the center, Cijk
, of cells (ijk) to obtain values
. Then the values are linearly interpolated at the center, Cijk
, of cells (ijk) to obtain values ![]() (Maronnier and others, Reference Maronnier, Picasso and Rappaz2003) (see Fig. 7). The knowledge of
(Maronnier and others, Reference Maronnier, Picasso and Rappaz2003) (see Fig. 7). The knowledge of ![]() and
and ![]() on each cell (ijk) allows the process to be started for the next time-step.
on each cell (ijk) allows the process to be started for the next time-step.
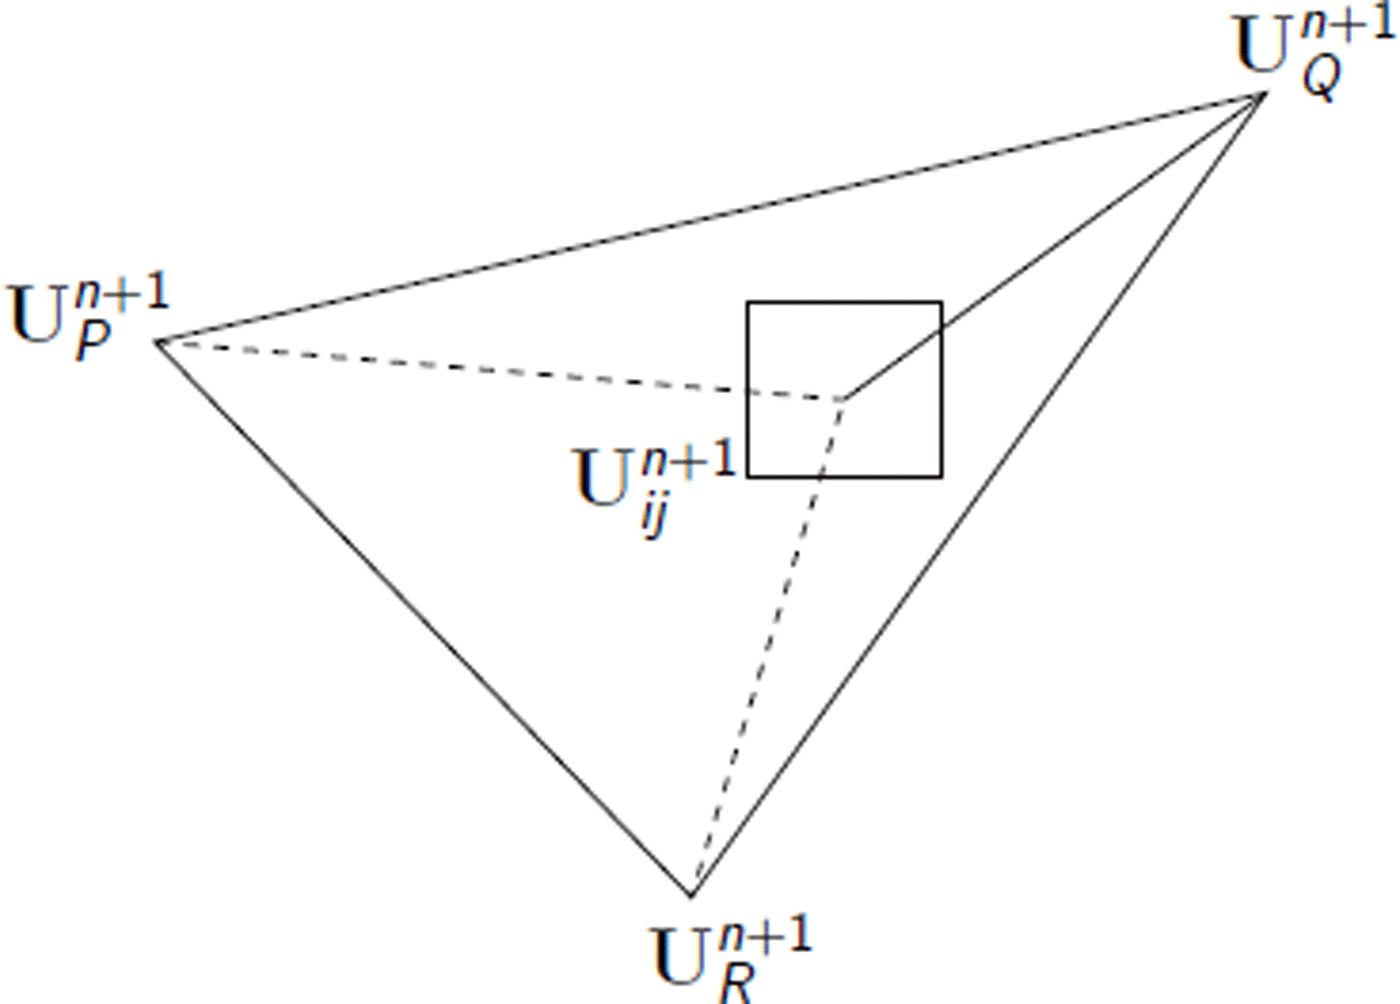
Fig. 7. Interpolation of U
n
+1 on ![]() in two dimensions.
in two dimensions. ![]() is defined using the values of U at vertices P, Q and R of the element containing the cell (ij).
is defined using the values of U at vertices P, Q and R of the element containing the cell (ij).
Numerical validation
Convergence test for the two-dimensional transport algorithm
The scheme presented is unconditionally stable and ![]() convergent (see characteristic Galerkin methods in Pironneau,Reference Pironneau1989). A simple situation enables the transport algorithm for a given divergence-free velocity field which is constant with time to be tested. A free boundary surface is chosen in the two-dimensional box, Λ = [0, 200] × [0, 200]. Let
convergent (see characteristic Galerkin methods in Pironneau,Reference Pironneau1989). A simple situation enables the transport algorithm for a given divergence-free velocity field which is constant with time to be tested. A free boundary surface is chosen in the two-dimensional box, Λ = [0, 200] × [0, 200]. Let

be defined in Λ, let B(x) = 0 be the base function defined on [0, 200] and let H(t, x) = S(t, x) = 100 (t + 1) − x be the thickness of the ice. These data applied in the two-dimensional version of Equation (8) yield

We deduce the mass budget function b(t, z) = 2z − 100 t identifying the right-hand side of Equation (22) with that, b(t, S(t, x)), of the transport equation (8). Figure 8 shows the evolution of the ice region.
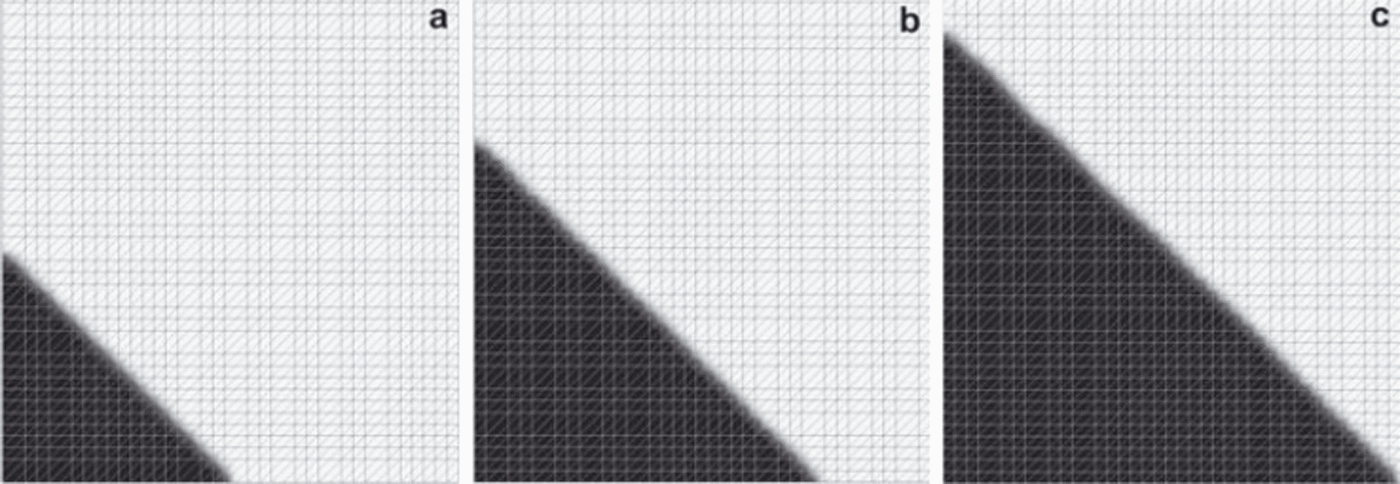
Fig. 8. Evolution of the interface in the test case for the two-dimensional transport algorithm. (a) t = 0, (b) t = 0.5 and (c) t = 1 year.
The error of φ (defined by Equation (16)) is checked at the final time, T = 1 year:

where (xi , zk ) are the coordinates of the center of the cell (ik). The physical meaning of E is the difference between the computed and the exact ice volume. Three levels of refinement (coarse, medium and fine) are built by dividing the grid size and the time-step together by two. Table 1 presents the error, E, against the level of refinement. A linear convergence is observed conforming to the order of convergence expected (h and Δt are linked).
Table 1. Error, E, according to the level of refinement

Mass conservation
Mass conservation is an important advantage of this method. The advection step reallocates the mass of all cells without global mass loss or gain. In the same way, the two post-processing steps guarantee an exact mass conservation. This point is checked by looking for simulations of steady-state glaciers with a vanishing mass balance (see ‘Steady-state geometry’ below).
Applications to Vadret Muragl, Swiss ALPS
Reconstructed terminus positions
Presently, Vadret Muragl is a small glacier, 200–300 m long, in the highest reaches of the Val de Muragl, in the eastern Swiss Alps. The glacier reached the main valley of Pontresina during some stages in the Late-glacial period. Based on geomorphological evidence, three positions of the glacier terminus were reconstructed: (1) the maximum Little Ice Age position with a length of 1.5 km at ∼1850, (2) the ‘Margun’ position with a length of ∼3.65 km, and (3) the ‘Punt Muragl’ position with a length of ∼5.7 km (Reference RothenbühlerRothenbühler, 2000; Reference ImbaumgartenImbaumgarten, 2005). The Margun and Punt Muragl states are related to the Egesen Late-glacial between 12 000 and 10 000 years BP (Reference MaischMaisch, 1982; Reference Ivy-Ochs, Kerschner and SchlüchterIvy-Ochs and others, 2007).
We use the reconstructed Margun and Punt Muragl (see Fig. 9) positions to demonstrate the possibilities of the proposed algorithm and to test the underlying geomorphological and climatological hypotheses. Based on the hypothesis that a glacier does not deposit large frontal moraines during phases of rapid retreat or advance, we assume that the deposited moraines mark stagnant phases. Although a stagnant terminus does not imply an equilibrium state, we approximate these positions with the equilibrium shapes of the ice surfaces.
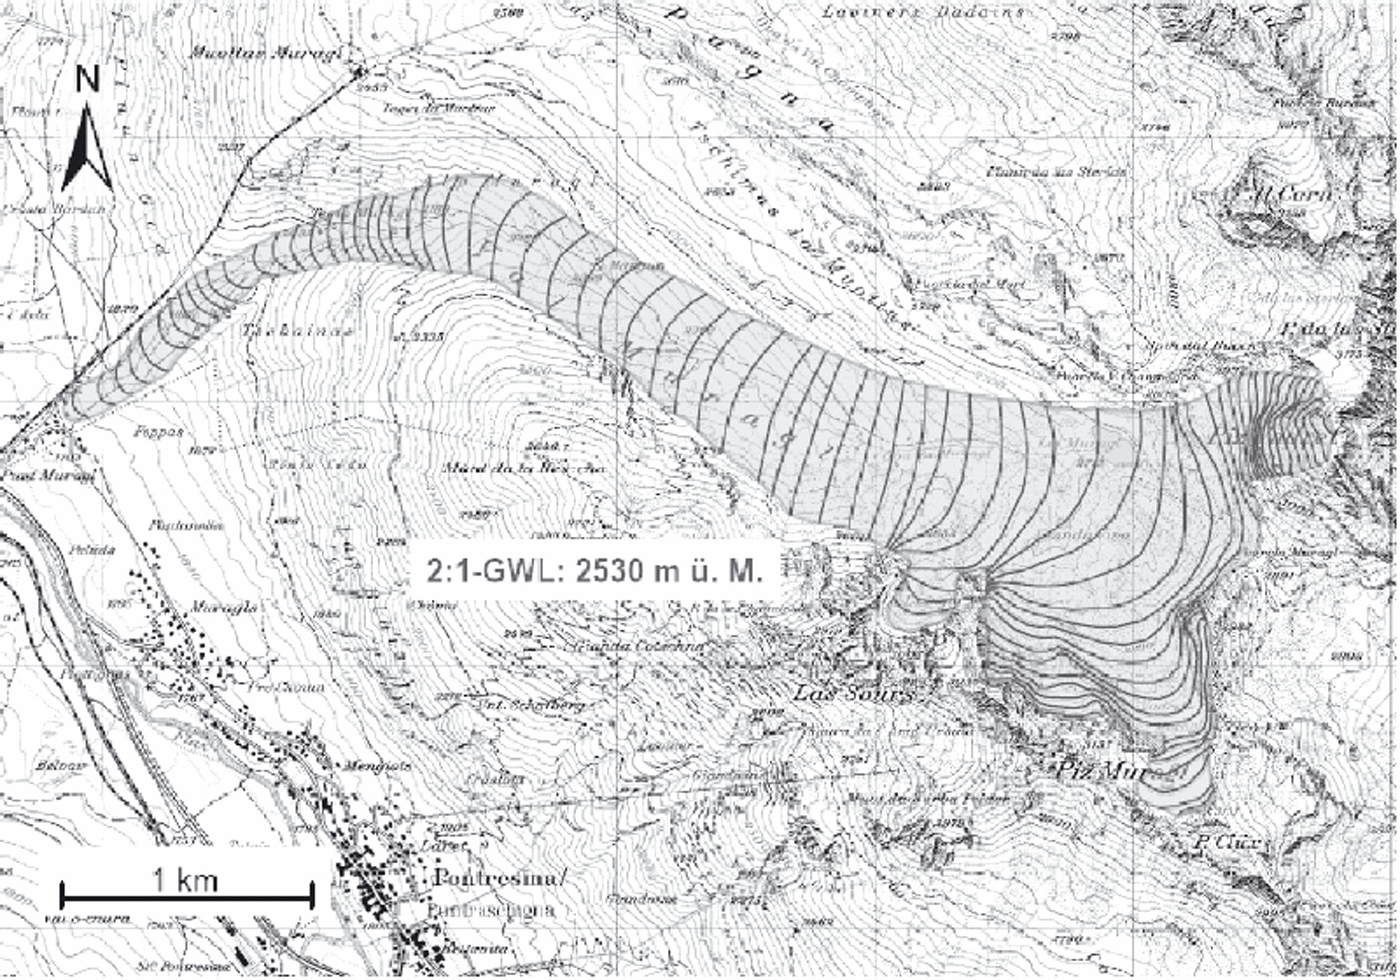
Fig. 9. Reconstructed position Punt Muragl for Vadret Muragl, from Reference ImbaumgartenImbaumgarten (2005).
Mass-balance parameterization
The mass-balance distribution on a glacier surface is influenced by precipitation and melt patterns, which, in turn, are influenced by topography, wind patterns and perhaps debris coverage. Despite these complications, the mass balance, b(z), is predominantly elevation-dependent. To reduce the number of degrees of freedom in a possible mass-balance parameterization, a simple distribution is defined by the melt gradient, a m, the equilibrium-line altitude, z ELA, and the maximum accumulation rate, a c (Fig. 10):
This simplified parameterization follows the observation that the mass balance increases approximately linearly with altitude in the ablation zone and often levels out in the accumulation zone (Reference KuhnKuhn, 1981; Reference Cogley, Adams, Ecclestone, Jung-Rothenhäusler and OmmanneyCogley and others, 1995; Reference StroevenStroeven, 1996). Furthermore, the mass-balance gradient appears to be quite independent of the climate in the individual years.
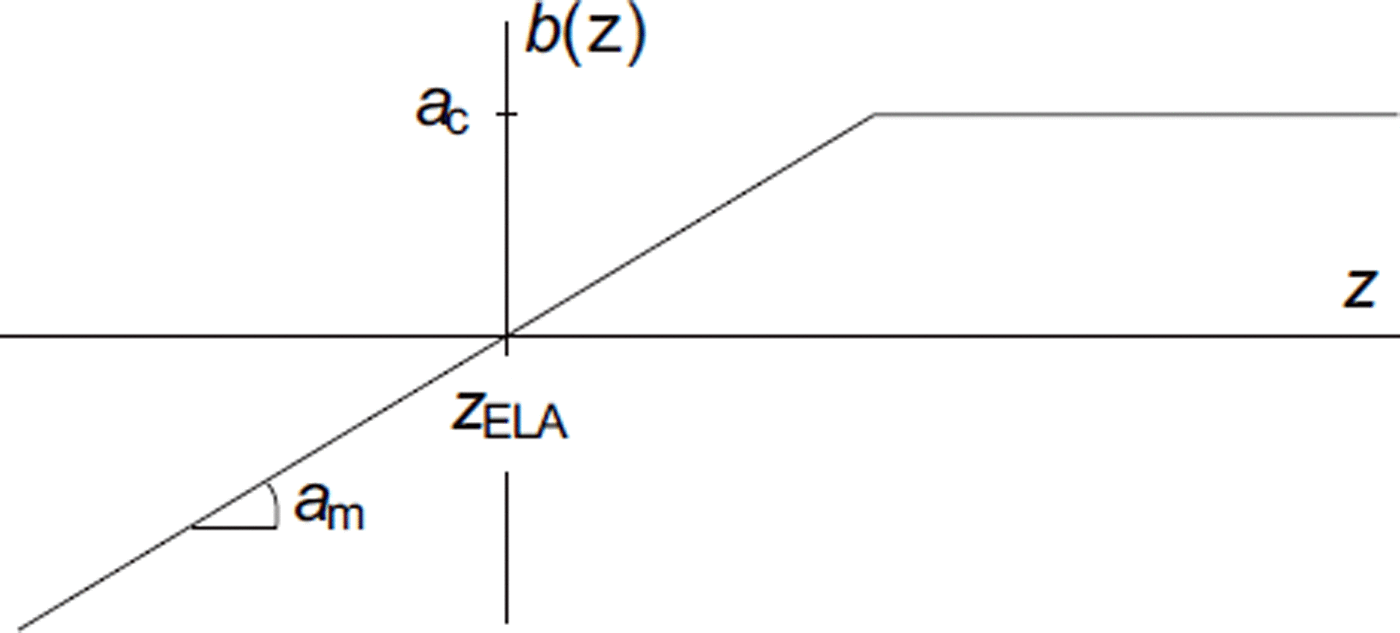
Fig. 10. Ablation/accumulation function, b(z).
Steady-state geometry
Firstly, we test the ability of the model to compute accurate equilibrium shapes and the assumed uniqueness of an equilibrium shape for a given mass-balance distribution. For a given elevation-dependent mass balance, the model was run with two different initial shapes. One run started with a small glacier corresponding to the Little Ice Age geometry, and the second run with the large shape corresponded to the Punt Muragl geometry (Fig. 9). The numerical values of the physical parameters in both runs were ![]() for the flow-law exponent, rate factor A = 0.08 bar
−
3 a−1 and regularization parameter
for the flow-law exponent, rate factor A = 0.08 bar
−
3 a−1 and regularization parameter ![]() (see Equation (5)). The time-step for surface evolution was Δt = 1 year, and the grid spacing for the advection cells was 5 m.
(see Equation (5)). The time-step for surface evolution was Δt = 1 year, and the grid spacing for the advection cells was 5 m.
The obtained converged states were reached after a few hundred years and coincided within 50 m (Fig. 11); thus, the differences lie within the grid resolution and are not significant. This geometry is considered to be the steady-state shape of the free-boundary problem for the given mass-balance distribution. Although this is not a rigorous proof of the uniqueness of the steady state in general, for this relatively simple geometry of the Val de Muragl the uniqueness is a safe assumption.
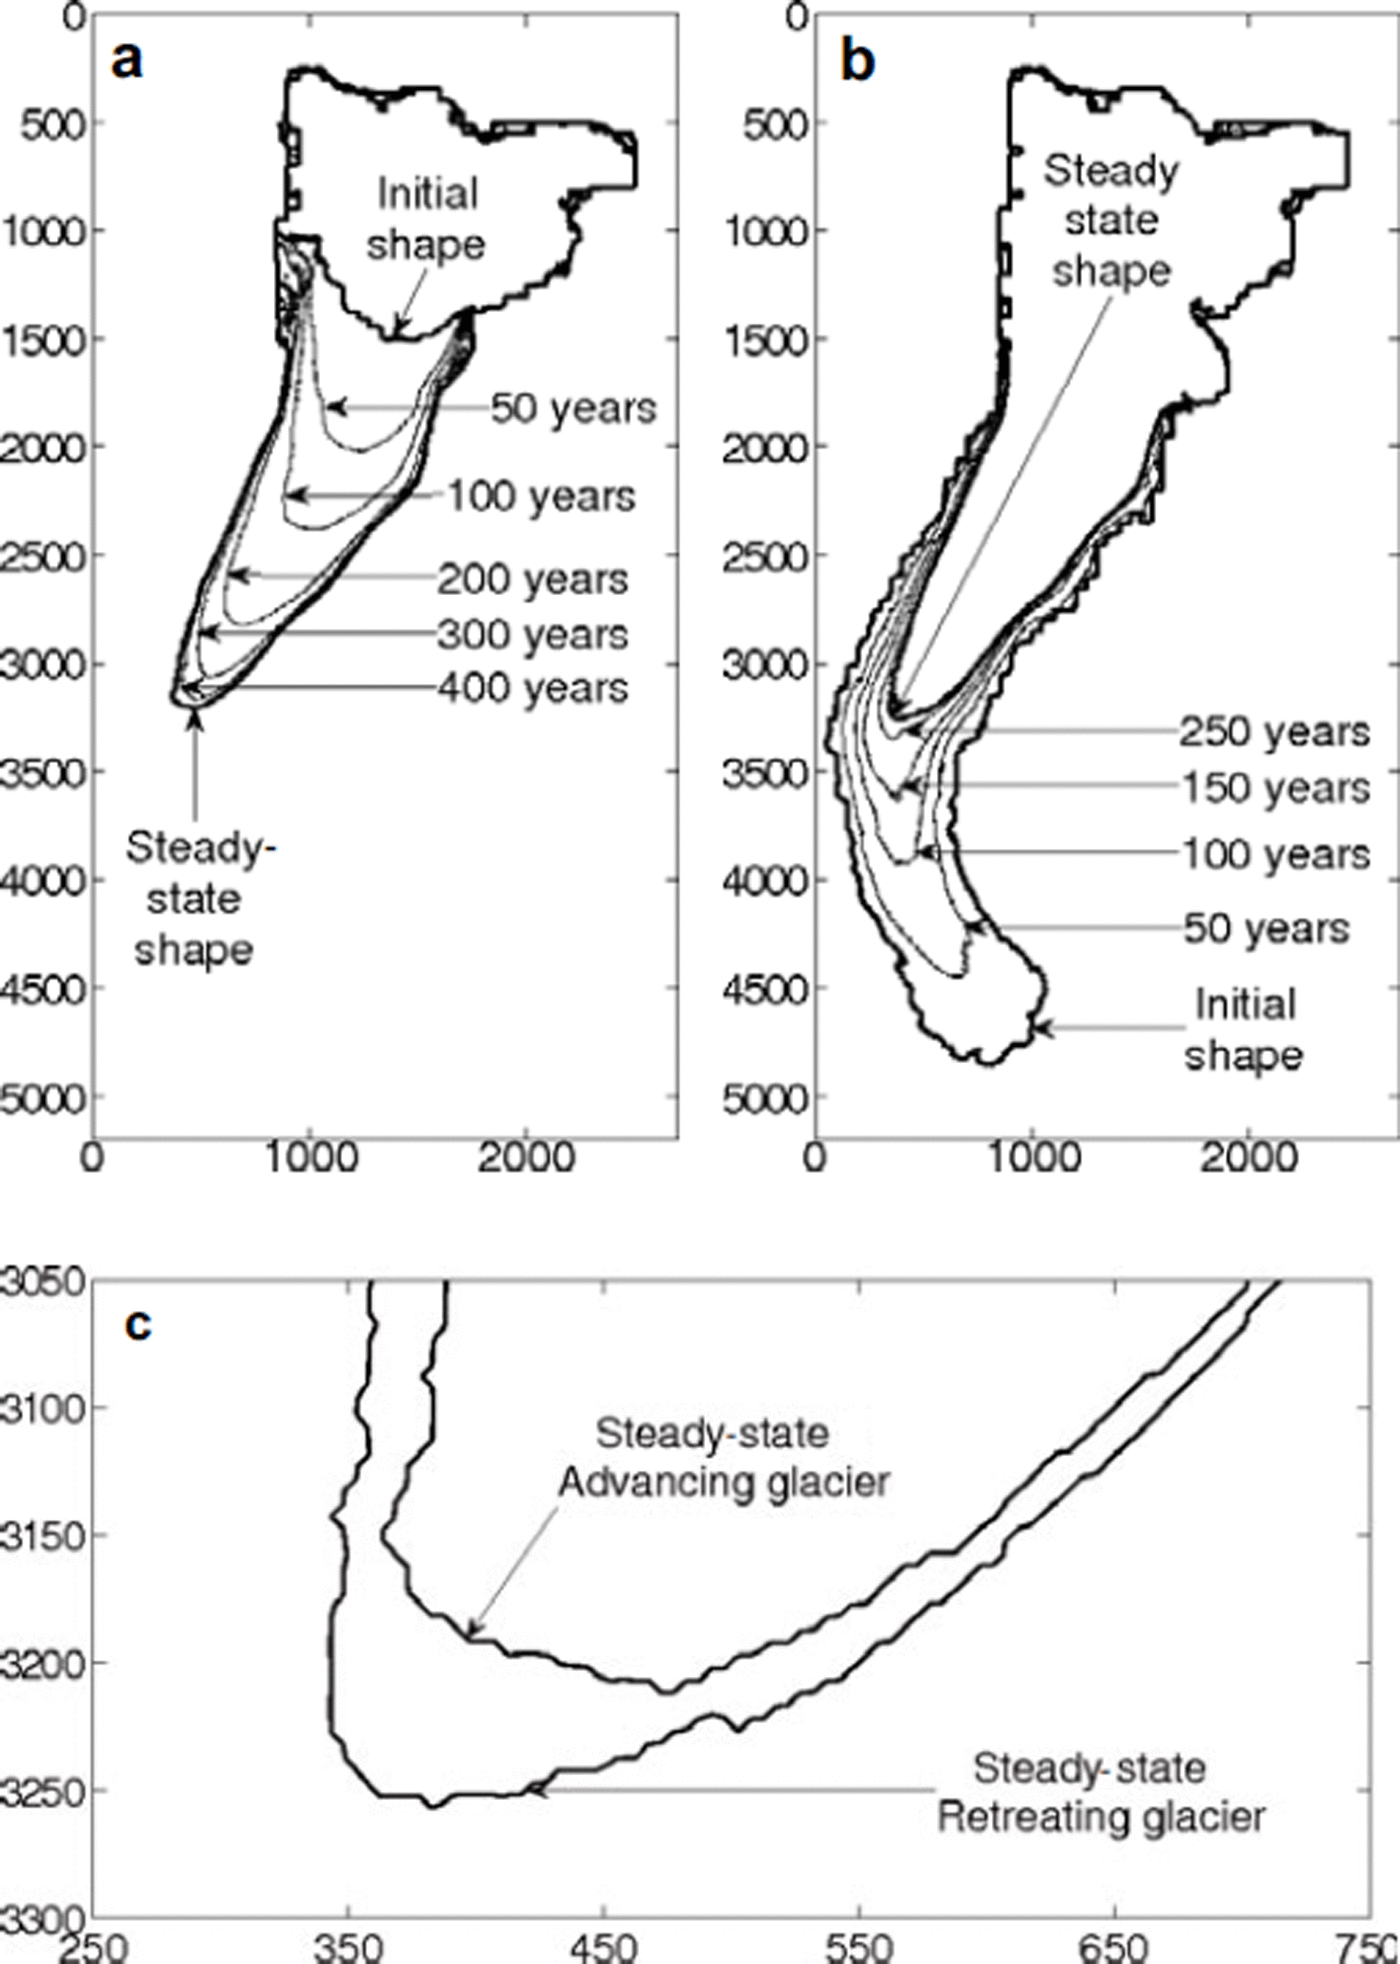
Fig. 11. Evolution of the glacier starting from (a) the Little Ice Age position and (b) the Punt Muragl position. The parameter values for the steady state corresponding approximately to the Margun position are z ELA = 2700 m a.s.l., a c = 0.5 m a−1 and a m = 0.004 a−1. (c) The difference between the locations of the two tongues. Axis labels are in meters.
The approach of steady state was used to test the mass conservation of the algorithm. Near the steady state, the mass of the glacier oscillates around zero with an amplitude of ∼1000 m3 with time-steps of 1 year, which corresponds to a residual mass balance of a few millimeters per year.
A threshold for the residual mass balance was defined to determine when steady state is reached. However, to prevent premature termination due to coincidental crossing of the threshold in one time-step, the variance of the mass fluctuations over 20 time-steps was taken to decide when the threshold for steady state is reached.
Margun and Punt Muragl positions
Secant method
The independence of steady states of the initial shape motivates the solution of the inverse problem: find the mass-balance distribution such that the modelled glacier fits a given tongue position. In this study we investigate the two reconstructed positions, Margun and Punt Muragl, in terms of the three mass-balance parameters defined in Equation (23). Our goal is to find sets of parameters (a c, a m, z ELA), for which the computed steady-state terminus position fits the given reconstructed glacier terminus. However, the solution of this inverse problem is not unique. For this reason, we search for solutions in the parameter space for the realistic intervals of each parameter. For fixed values of the two parameters, a c and a m, the equilibrium-line altitude, z ELA, can be found by an iterative process. Since the glacier length is a monotonous function of z ELA, a given tongue position can be obtained by applying a secant method, as illustrated in Figure 12.
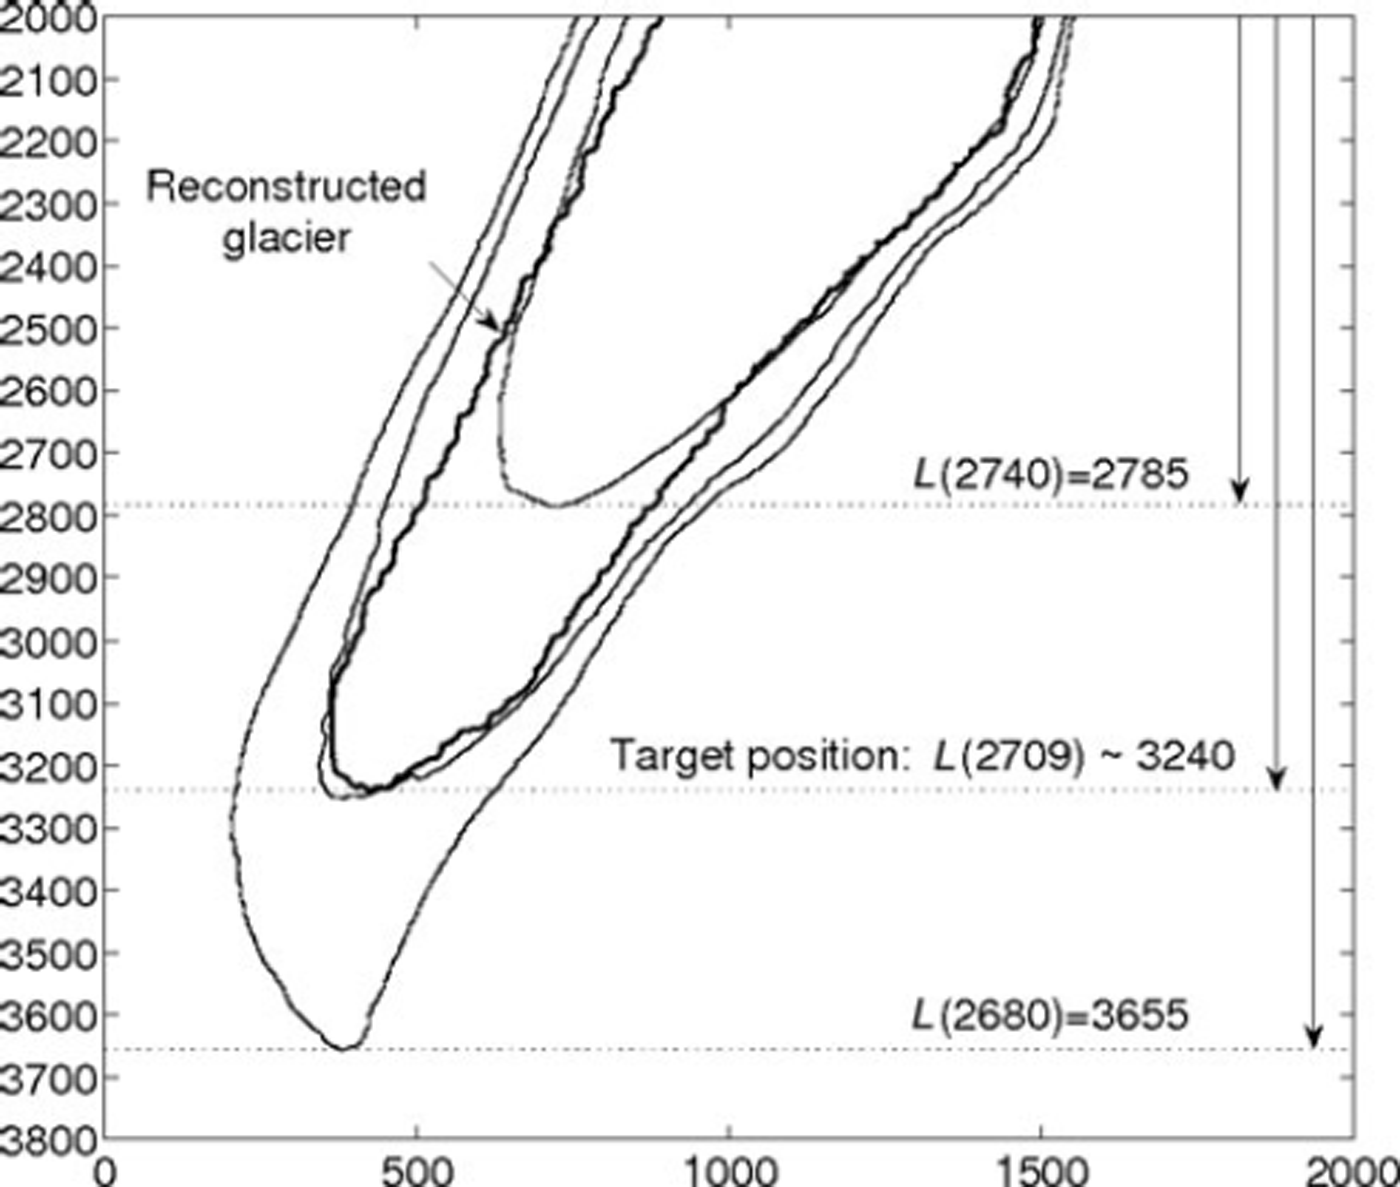
Fig. 12. Computation of steady shapes for z ELA = 2740 and 2680 m a.s.l. provides two abscissas for the tongue’s end: L(2740) = 2785 and L(2680) = 3655. Using a secant method, z ELA = 2709 m a.s.l. is a judicious choice for the next computation. Indeed, the corresponding steady shape almost fits the target position. Figure 14 shows that the target’s position is a linear zone of the function L(z ELA). This justifies the efficiency of the method in this case. Axis labels are in meters.
Climatic conditions
The Margun and Punt Muragl positions can be explained by a range of different climatic conditions. Each set of numerical values of the three parameters, a c, a m and z ELA, results in a glacier length, L; however, each given glacier length, L, may be obtained with an infinite number of sets. Figure 13 shows the solutions in the parameter space for the Margun and Punt Muragl positions for limited intervals of each of the three parameters. Within physically possible intervals of 0.002 ≤ a m ≤ 0.006 a−1 and 0.3 ≤ a c ≤ 1.0 m a−1, the equilibrium-line altitude changes as much as 100 m for the Margun state and 220 m for the Punt Muragl state. Equally, the glacier volume varies as much as 40% within this parameter range. It is thus necessary to constrain the equilibrium-line altitude by additional climatological and glaciological information on possible accumulation rates and mass-balance gradients.
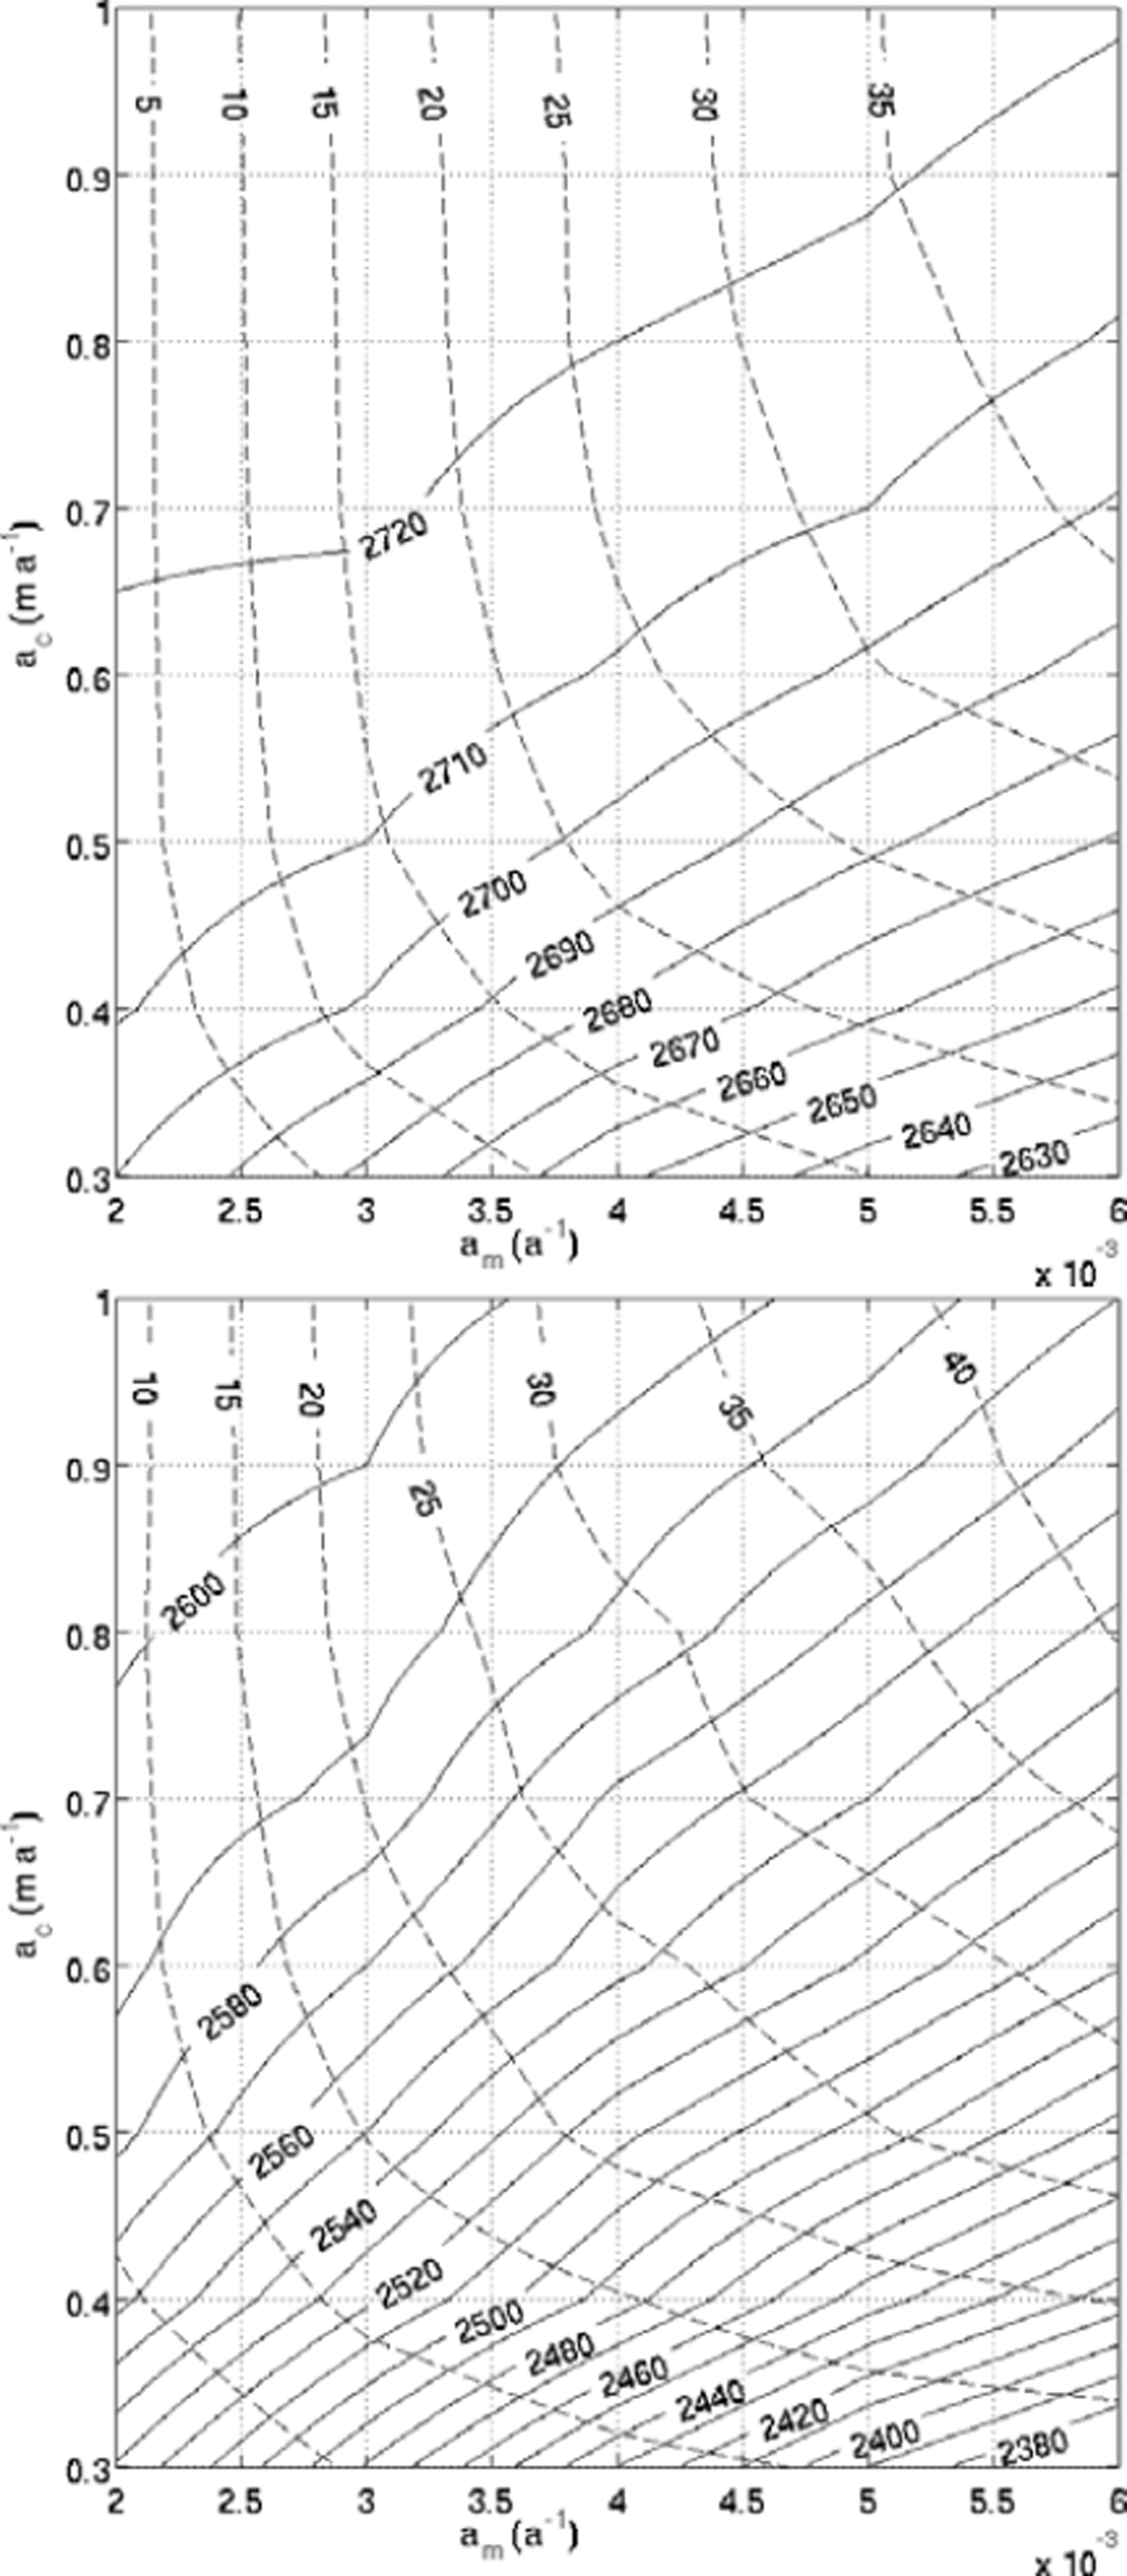
Fig. 13. The level sets of z ELA with respect to a m and a c (solid curves) and variation of the volume (in %) of the steady shapes are given relative to the smallest value, obtained with the smallest coefficients a m = 0.002 m a−1 and a c = 0.3 a−1. (a) Margun position; (b) Punt Muragl position.
In our computations, the glacier was only matched to the terminus positions. Another possible way to constrain the climatic conditions is available if additional moraines exist alongside the reconstructed glacier. In this case, the possible volume and, consequently, the mass-balance parameters are constrained further.
More realistic mass-balance models most probably require more parameters and, thus, introduce more degrees of freedom. This may make a further constraint on the climatic conditions even more demanding in terms of computing time and suitable algorithms to determine the given geometrical outlines.
Climate sensitivity
The climate sensitivity can be characterized by the change in equilibrium length, L, of a glacier divided by the change in elevation of the equilibrium line z ELA: dL/dz ELA. We determine the dependence of the climate sensitivity on glacier length and the parameters used for the mass-balance model by computing the length of Vadret Muragl for the extreme cases for melt gradient and accumulation. Figure 14 shows these dependencies and the corresponding climate sensitivity. Around the Punt Muragl position, the sensitivity is small, with a value of ∼4, compared to ∼15 near the Margun position.
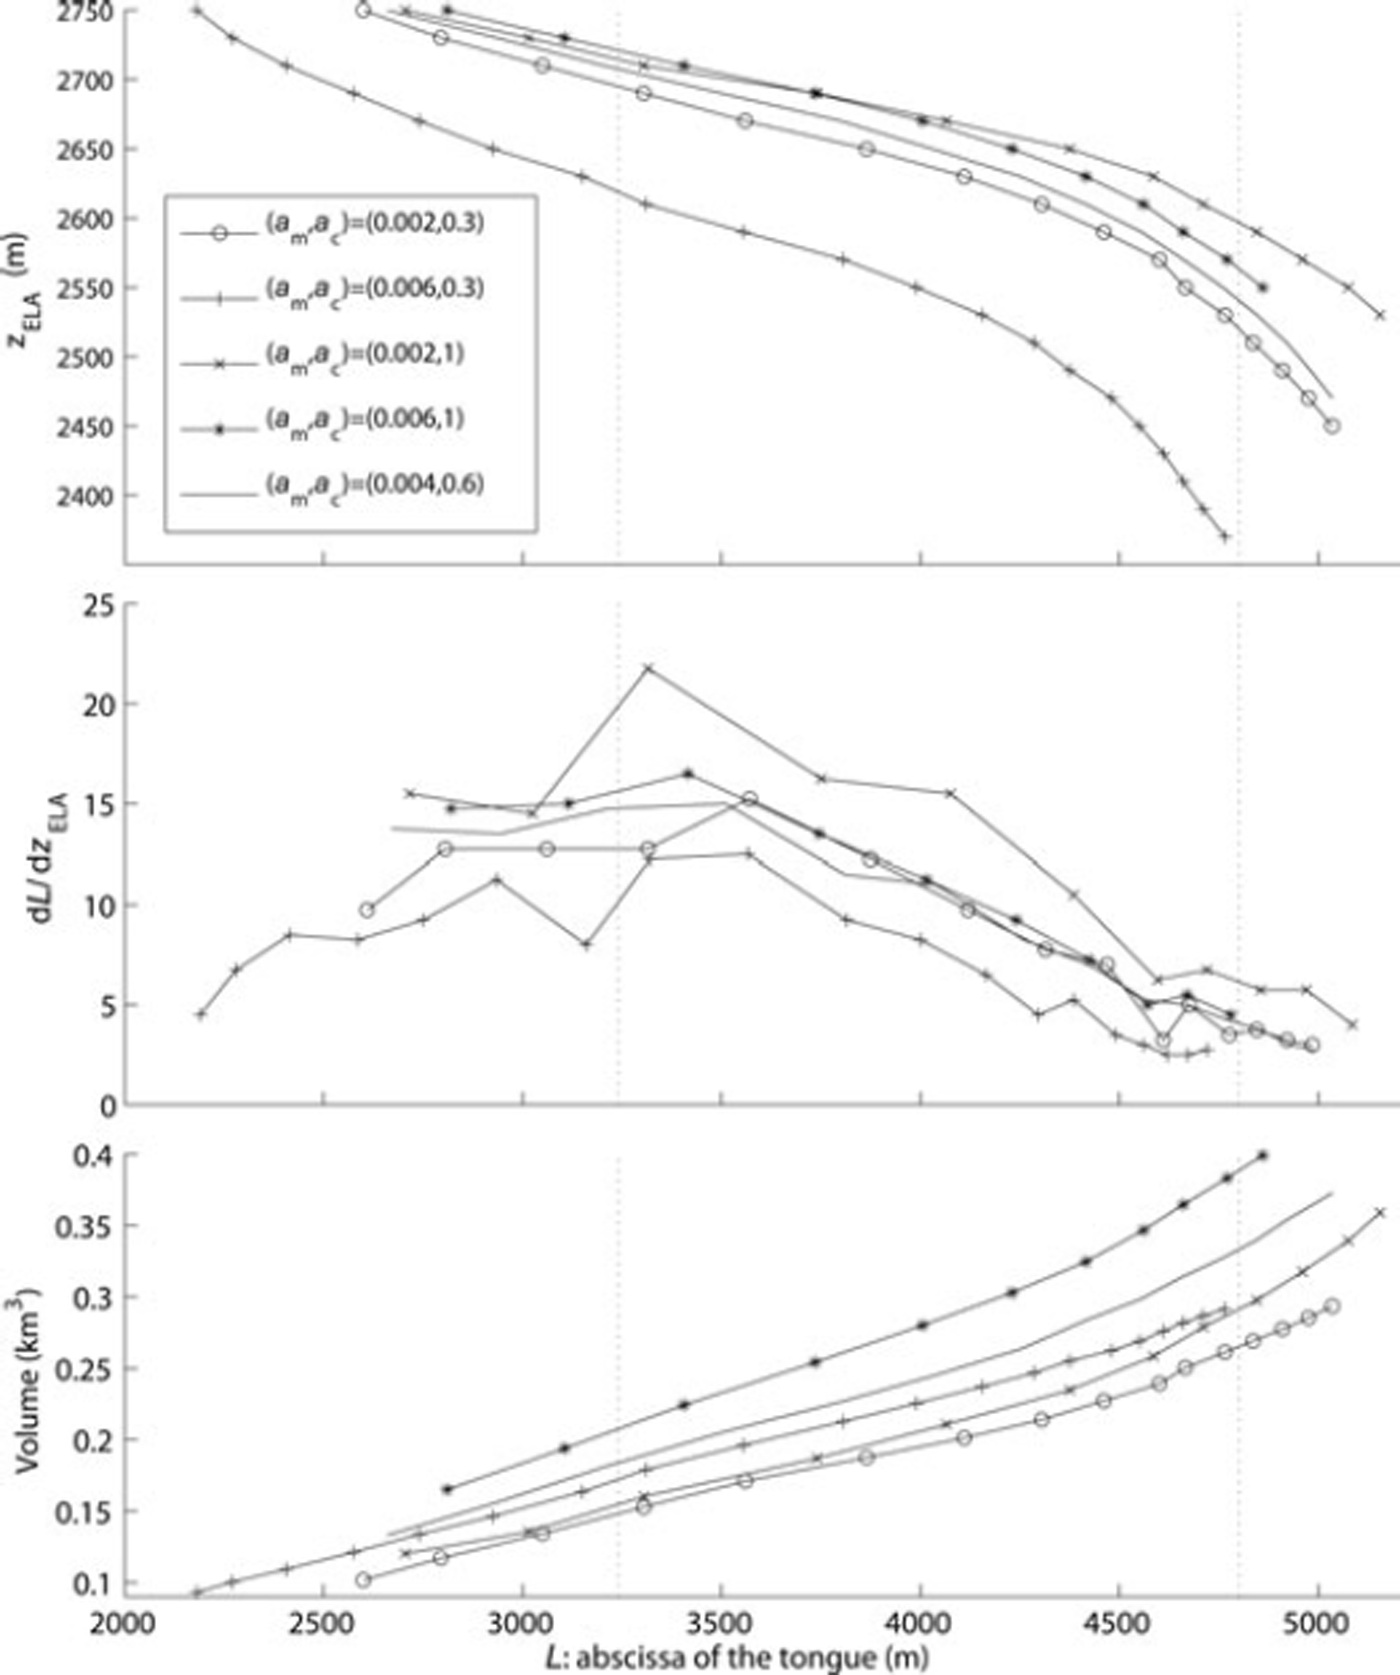
Fig. 14. (a) Equilibrium-line altitude, z ELA, (b) climate sensitivity, dL/dz ELA, and (c) volume, as a function of the equilibrium length for four extreme cases (a m = (0.002, 0.006) a−1 and a c = (0.3, 1.0) m a−1) and an intermediate case (a m = 0.004 a−1 and a c = 0.6 m a−1). Margun and Punt Muragl positions are indicated by dotted curves.
Rate factor
The chosen rate factor, A = 0.08 bar−3 a−1, corresponds to temperate ice (Reference Hubbard, Blatter, Nienow, Mair and HubbardHubbard and others, 1998; Reference GudmundssonGudmundsson, 1999; Reference Albrecht, Jansson and BlatterAlbrecht and others, 2000). To test the robustness of the results, we chose different values for A by doubling and halving the above value. The smaller value mimics colder ice, whereas the larger value may mimic some contribution from sliding. The experiments were performed with values of a c = 0.5 m a−1, a m = 0.004 a−1 and z ELA = 2697 and z ELA = 2513 ma.s.l. for the Margun and Punt Muragl positions, respectively. With A = 0.08 bar−3 a−1 these values correspond to the solution for the reconstructed positions. With the smaller A = 0.04 bar−3 a−1, the glacier is 165 and 70 m longer for the Margun and Punt Muragl positions, respectively. For softer glacier ice with A = 0.16 bar−3 a−1, the corresponding shortenings are 75 and 0 m.
For the Margun position with a mean rate factor A = 0.08 bar−3 a−1, accumulation a c = 0.5 m a−1 and mass-balance gradient a m = 0.004 a−1, the resulting equilibrium-line altitude is z ELA = 2697 m a.s.l. and the computed volume of the glacier is V = 1.808 × 10⁸ m3. For softer ice, with A = 0.16 bar−3 a−1, or harder ice, with A = 0.04 bar−3 a−1, the glacier is expected to be thinner or thicker, respectively. Table 2 summarizes the results for the Margun position for various combinations of the mass-balance parameters for the different rate factors.
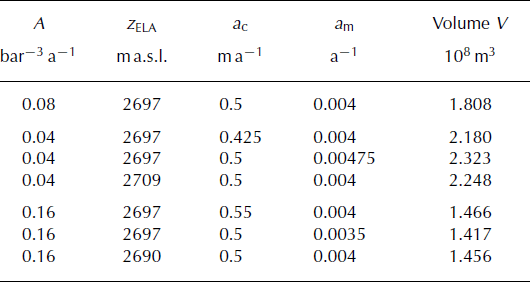
Table 2. Solutions for z ELA, a m and a c for various values of the rate factor, A, for the Margun position
Transient experiment for Punt Muragl state
The long narrow tongues of the proposed reconstruction of the Punt Muragl position (Fig. 9) arise from two lateral moraine ridges near the assumed terminus position (Reference RothenbühlerRothenbühler, 2000; Reference ImbaumgartenImbaumgarten, 2005). However, the modelled Punt Muragl state robustly shows a thick piedmont-type glacier tongue. This should be expected in view of the concave-shaped debris cone on which the glacier advances at the exit of the Muragl valley near Punt Muragl. This casts some doubt on the origin of the observed moraines and the reconstructed glacier tongue as a maximum extent during the Egesen maximum.
An advancing glacier tongue is generally steeper and thicker than a retreating glacier. This suggests transient experiments to test the hypothesis that the reconstructed ice tongue is in a transient retreat state rather than a stagnant or equilibrium position. A simulation of an advance into the Punt Muragl equilibrium state and a subsequent retreat was carried out. For the simulation, a relatively small mass-balance gradient of a m = 0.001 a−1 was chosen, corresponding to a debris-covered glacier. This choice is motivated by the assumption that in a retreat scenario a small mass-balance gradient initially leads to a faster thinning and narrowing of the glacier tongue than does a faster retreat. With an accumulation of a c = 0.3 m a−1, the equilibrium-line altitude was at 2400 m a.s.l. for the advance into the equilibrium state, and was switched to 2600 m a.s.l. for the subsequent retreat. Figure 15 shows the advance and retreat patterns over a period of ∼500 years. Although the retreating tongue is narrower than the advancing tongue, it is difficult to match the narrow reconstructed tongue.
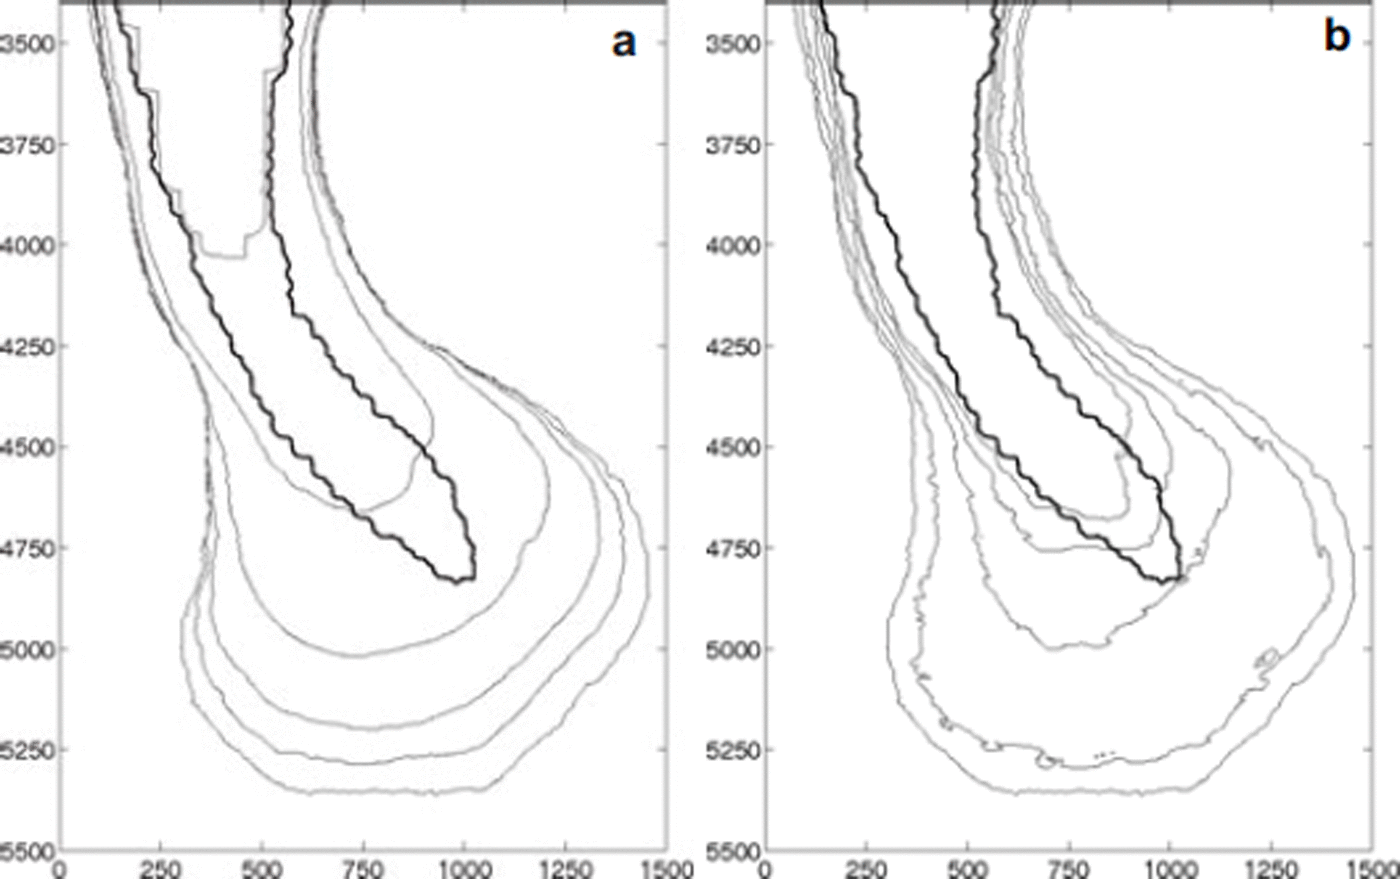
Fig. 15. Transient states of Vadret Muragl for a m = 0.001 a−1 and a c = 0.3 m a−1. (a) Advance into steady state with z ELA = 2400 m a.s.l. and (b) retreat from this steady state with z ELA = 2600 m a.s.l. The thick curve indicates the reconstructed position of Reference RothenbühlerRothenbühler (2000). Axis labels are in meters.
Discussion and Conclusions
A novel mass-transport algorithm is introduced to compute the evolution of a glacier surface for given climatic conditions. The scheme is a Euler algorithm based on a VOF method and is stable for CFL numbers >1. To avoid numerical diffusion in the mass-advection scheme, a simple line interface calculation is applied (see, e.g., Reference Scardovelli and ZaleskiScardovelli and Zaleski, 1999). A second post-processing algorithm is used to prevent numerical compression and to force the VOF to remain ≤1. The advection scheme, together with the post-processing steps, meets mass conservation to a high accuracy. For steady-state shapes with stationary climatic conditions, the residual net mass balance is of the order of a few millimeters per year.
The combination of a finite-element ice-flow model with the new transport scheme yields a flexible and stable model for the dynamics of small mountain glaciers with a wide range of sizes and shapes. The method is well suited to simulate the dynamics of a glacier over long periods of time. Moreover, it can handle complex topological shapes. Contrary to the Saint-Venant models, it can handle a change in the topology of the domain, such as a splitting of the glacier into smaller parts or the emergence of a nunatak inside the glacier area.
The use of a fine-structure grid enables us to solve Equation (14) accurately, while the coarser unstructured mesh is suitable for solving Equations (3–7), which is computationally the most expensive task.
We demonstrate the capabilities of the model with an example of an almost extinct glacier that extended several kilometers down-valley during the Late-glacial stadial of the Egesen. Two reconstructed states are reviewed in terms of the required climatic conditions. The geomorphological evidence available for these states only gives the outline of the ice tongue in the ablation area. It is not trivial to obtain an estimate of the ice-surface topography corresponding to the given margin. Comprehensive numerical modelling is one way of obtaining a topography of the glacier and possibly to test it in view of uncertain parameters, such as the climatic conditions or the rheological properties of the glacier.
The computed piedmont-type geometry of the Punt Muragl state of Vadret Muragl is robust. It can be safely concluded that the reconstructed glacier tongue (Reference RothenbühlerRothenbühler, 2000; Reference ImbaumgartenImbaumgarten, 2005) is probably not a maximum extension of Vadret Muragl in the Egesen maximum, but, rather, a transient retreat state. This also suggests that the ice volume in this valley must have been larger than estimated from geomorphological evidence alone. A combination of both geomorphology and numerical modelling seems to support both fields, in the interpretation of geomorphological observations and in the numerical modelling of glacier dynamics.
Acknowledgements
We thank T. Ewen for English corrections and M. Maisch, T. Imbaumgarten and C. Rothenbühler for the information on the reconstructed Vadret Muragl and permission to use the map in Figure 9.


