


Introduction
Recent developments in glaciology have emphasized the importance of determining the thermal and mechanical conditions at the base of a polar ice sheet. A decisive factor relating to these conditions is the presence, or absence, of water. In particular, the current research into flow instability phenomena would be greatly aided by remote methods of establishing the existence of a layer of water or of wet sediments beneath the glacier (Reference WeertmanWeertman, 1966,1969,1972).
So far, the most promising contribution in this field has come from electromagnetic methods. Radio-echo sounding exploration of the Antarctic ice sheet has revealed the apparent presence of water layers between the ice and the underlying glacier bed in some regions; these results are based upon the evidence of high electromagnetic reflection coefficients and essentially horizontal reflecting horizons (Reference Robin, Robin.de, Swithinbank and SmithRobin and others, 1970; Reference Oswald and Robin.deOswald and Robin, 1973).
Seismic evidence of a wet layer under a polar ice sheet has been reported by several workers. Reference Bull and HamiltonBull (1956) explained the existence of distinct seismic non-reflecting zones in northern Greenland as possibly due to the low reflectivity of unfrozen ground moraine. Reference Bentley and CraryBentley and Clough (1971 [b]) found both reflection and refraction evidence for a subglaeial wet zone at a site in west Antarctica. In this paper, seismic reflection records from a series of shot-points along a 150 km profile in west Antarctica are presented in an effort to illustrate some of the possibilities and difficulties of the seismic reflection method of investigating conditions at the base of an ice sheet.
Physical Background
When a vertically incident dilatational elastic wave is reflected from a horizontal interface between two homogeneous, isotropic, elastic media there will be a phase change of 180° in the wave-form if the acoustic impedance of the medium in which the wave is incident is greater than that of the medium on the other side of the interface. The acoustic impedance I is defined as the product of the density p by die phase velocity of the wave, V. The condition for phase reversal is
where the subscripts 1 and 2 refer to the medium of incidence and the reflecting medium respectively.
The amplitude ratio of the reflected wave to the incident wave is defined as the displacement reflection coefficient R. For normal incidence it is given by the expression
It can be seen that if,I 1 and I 2 are nearly equal the reflected wave will be very small, and if I 1 > I 2, i.e. if the condition for phase reversal exists, R will have a negative sign.
Let us consider the character of reflected seismic waves for the cases of media which may reasonably he expected to underlie a polar ice sheet: a water layer; a solid rock layer; a layer of saturated, unconsolidated rock debris, which may be either wet or frozen.
1. Water layer
Reference GowGow (1970) found a thin layer of fresh water at the bottom of the 2 164 m deep drill hole at “Byrd” station. The ice load at the base was 197.3 bar, the temperature — 1.6°G, and the density of the ice (ρ1) was 0.917 Mg m-3. Reference BentleyBentley (1972) calculated a value of approximately 3 845 m s_l for the dilatational wave velocity V 1 in the ice at the base, taking into account the finding that the basal ice is nearly isotropic at “Byrd” station. It is probably anisotropic in most other parts of west Antarctica (Reference Bentley, Clough and AdieBentley, 1971 [a]). However, the velocity difference due to variations in ice fabric cannot be more than a few per cent (Reference Bentley, Clough and AdieBentley, 1971 [b]) and may be considered negligible here.
The density and velocity of pure water at the pressure and temperature given above can be obtained from the tables of Reference DorseyDorsey (1940) and Reference WilsonWilson (1959): ρ2 = 1.009 Mg m-3; V 2 = I 427 m s_I. The calculated reflection coefficient for the ice—water interface at the base of the ice sheet under “Byrd” station is then, from Equation (2): R = —0.420.
Because the dilatational wave velocity in water is much smaller than it is in ice, the acoustic impedance decreases sharply across the interface and the reflection coefficient is negative. A wave through the ice reflected at this interface will exhibit a phase reversal relative to a wave that has traveled directly from the seismic source to a detector. The absolute value of R in this case is comparable to the value for an interface between ice and an indurated sandstone (Table I) and a reflection of moderate amplitude is anticipated, assuming no interference from englacial layers or substrata.
TABLE. I. Calculated reflection coefficients for an interface between ice and some rock types represented in west antarctica

2. Solid rock
Dilatational wave velocities and densities of common rock types range from approximately 1 800 rn s-1 and 2.o Mg m-3 for “soft” water-saturated sandstone and shales to over 6000 m s-1 and 2.7 Mg m-3 for “hard” limestones and granites (Reference JakoskyJakosky, 1961). For materials at the lower ends of these ranges, the acoustic impedance is nearly equal to that of ice, the reflection coefficient at the interface is very small, and only a very low amplitude reflected wave, or none at all, will be returned to the surface. With increasing velocity and/or density of the reflecting layer, the reflection coefficient increases and a relatively high-amplitude reflected wave is returned with unchanged phase.
Densities, velocities, and calculated reflection coefficients at an interface with ice under conditions similar to those at the bottom of the “Byrd” station deep drill hole are given for some rock types found in west Antarctica in Table I.
Upon freezing, the seismic velocities in saturated solid rocks increase by a substantial percentage (10% to 50%), which is largely a function of lithology, porosity, and pore structure (Reference TimurTimur, 1968), Thus, if the glacier is frozen to its bed, stronger seismic reflections may be expected than if the bottom is wet, and non-reflecting interfaces are unlikely. However, there is too great a velocity overlap among rock types for this characteristic to be diagnostic in the absence of independent data on the bottom material.
3. Unconsolidated rock debris
Studies of seismic wave propagation in soils and other unconsolidated rock materials in the vicinity of the freezing point of water have been conducted by a number of workers (Reference OgilvyOgilvy, 1969; Reference GargGarg, 1973; Reference McGinnis, McGinnis, Nakao and ClarkMcGinnis and others, 1973; Reference Nakano and FroulaNakano and Froula, 1973). In general they have found a marked increase in dilatational wave velocity during the freezing process. Since the velocities in wet, unconsolidated rock materials are usually low in relation to those in ice, this effect is important for this investigation.
The physical properties of saturated unconsolidated deposits are highly variable. In their permafrost studies Reference Nakano and FroulaNakano and Froula (1973) investigated materials ranging in density from 1.8 to 2.2 Mg m-3 and in velocity from about 1 400 to 2 900 m s-1 just above the freezing point. Using these data we obtain a range of values of reflection coefficient at an interface with ice from about —0.17 to +0.29. Reference Daly, Daly, Manger, Clark and ClarkDaly and others (1966) give several examples of Quaternary deposits with saturated densities ranging from about 1.5 to 2.0 Mg m-3. Press (1966) gives velocity values of 1 730 m s-1 for glacial till, 1 670 in s-1 for sand and gravel,
1 460 to 1 880 m s-1 for fine-grained marine deposits, and 2 160 m s-1 for tuff. These data would give a minimum reflection coefficient with ice of about —0.22.
Wet, unconsolidated materials can thus be expected to return seismic reflections with a range of characteristics: from a reversed phase wave of weak amplitude to a wave of unchanged phase with somewhat stronger amplitude. For materials with intermediate acoustic impedance the interface with ice will be non-reflecting. It should be noted that, as Reference Bentley and CraryBentley and Clough (1971 [b]) have observed, if the material is not completely saturated, compaction by the geostatic load of the ice will tend to increase the velocity and density until the acoustic impedance of the material exceeds that of ice.
Upon freezing to a temperature of –1o°C, the densities of unconsolidated rock materials do not change significantly, but their velocities increase to the range of 3 500 to 4 500 m s-1 (Press, 1966; Reference Nakano and FroulaNakano and Froula, 1973). The reflection coefficient at the frozen debris-ice interface then ranges from about 0.28 to 0.47: the frozen material reflects only waves of unchanged phase. Hence, for an unconsolidated substratum a reversed phase reflection is diagnostic of a wet glacier bed, though it does not indicate all zones of this nature.
To summarize:
-
For a water layer at the base of an ice sheet a moderately strong reflected wave of reversed phase is indicated.
-
For a solid rock layer, wet or frozen, a reflected wave of variable strength but always of unchanged phase is indicated.
-
(a) For a wet unconsolidated layer the reflected wave can range from weak with reversed phase to somewhat stronger with unchanged phase, and it may produce a non-reflecting zone.
(b) For a frozen unconsolidated layer a reflected wave of moderate strength and unchanged phase is indicated.

Fig. 1. Map of west Antarctica, showing location of “Byrd” station strain net, neighboring rock exposures, and locations of refraction profiles in the Byrd subglacial basin (sites numbered according to Reference Bentley and CraryBentley and Clough (1971 [a])).
From this analysis it follows that a reflected signal of reversed phase is indicative of either a water layer or a wet unconsolidated layer such as moraine, i.e. the base of the ice sheet is at the pressure melting point. However, some regions of the glacier underlain by wet rock or wet unconsolidated material will not be detected by this method.
Procedure
On the basis of the simple calculations above it appears to be possible to identify certain conditions of thermal regime at the base of a glacier through the seismic reflection method by phase comparison of the direct wave from a seismic source with the wave reflected from the bottom of the ice. The procedure was tried out with the records of a seismic reflection survey on the west Antarctic ice sheet. The direction of the initial ground motion as recorded on the seismogram was used as the basis of comparison in this study.
The seismograms used in this investigation were obtained from the vicinity of the “Byrd” station strain net, a double row of posts about three kilometers apart which is approximately parallel to the ice flow-line in the central part of west Antarctica (Fig. 1). Here the ice flows toward “Byrd” station and the Ross Sea from an ice-flow divide at the north-east terminus of the strain net. In this region the ice thickness varies from approximately 2 too m near “Byrd” station to more than 3 100 m near the ice divide, bedrock slopes are generally small, and (he assumption of vertical incidence for the seismic waves is approximately correct. Bedrock topography along the strain net in relation to the seismic shot-points discussed here is shown in Figure 2.
A 24-channel portable exploration seismograph of standard design was used to obtain the records. The details of equipment and field procedure and other information about the seismic program are described by Reference WhillansWhillans (1972), Reference Whillans and ThompsonWhillans and Thompson (1974) and Reference Dewart, Dewart, Whillans and BrecherDewart and others (1974).

Fig. 2. Profile of ice thickness and bedrock elevation along the "Byrd" station strain net. The line of posts on the north-west side of the strain net is numbered odd; the line 3 km to the south-east, even.
Bedrock Properties
The “Byrd” station strain net is located in the “Byrd” subglacial basin, the large bedrock depression that separates Marie Byrd Land from the Transantarctic Mountains. The deepest part of this basin lies about 150 km south-east of the strain net (see Reference Bentley, Chang and CraryBentley and Chang, 1971). There are no rock outcrops within 250 km of the strain net. The nearest of the Transantarctic ranges show exposures of intrusives and lower Paleozoic and earlier metasediments. The Whitmore Mountains consist of Paleozoic sediments and Mesozoic intrusives (Reference CraddockCraddock, 1970, plate 20) The Executive Committee Range and the Crary Mountains are composed of Cenozoic basalts and pyroclastics, probably resting on a basement complex of metasediments and intrusives (Reference Wade, Wilbanks and AdieWade and Wilbanks, 1971). Granite fragments were found in the dirty ice near the bottom of the deep drill hole at “Byrd” station (Reference GowGow, 1970). The relationship of these rocks to the bedrock under the strain net is not clear, but magnetic surveys suggest that the region lies within the Marie Byrd Land volcanic province (see Reference Behrendt and BentleyBehrendt and Bentley, 1968, plate 7).
Seismic refraction profiles at nearby points (Reference Bentley, Clough and AdieBentley and Clough, 1971 [a], Reference Bentley, Clough and Adie[b]) indicate that a thin layer of Cenozoic sediments with a low dilatational wave velocity (about 2 400 m s-1) underlies the ice in much of the basin, especially the deeper parts of it. Beneath this layer is a higher velocity material (4 100 to 4 300 m s-1) of unknown affinities, the Byrd subglacial basin rocks. This stratum apparently directly underlies the ice at “Byrd” station.
With the exception of the young sediments and some of the volcanics, the rocks noted here can be expected to form a highly reflective interface with ice (Table I). There are indications of bottom melting in the area. As noted above, Reference GowGow (1970) found water at the base of the ice sheet at “Byrd” station, while Reference Bentley, Clough and AdieBentley and Clough (1971 [b]) found evidence of a wet subglacial boundary at site 4 (Fig. 1).
Field Data
The character of the seismic reflections obtained varied greatly along the profile shown in Figure 2. The region from post I, near “Byrd” station, to post 25 was found to be virtually non-reflecting. From post 25 to post 35 strong reflections were generally recorded. From the latter point to as far as post 73 reflections were again very difficult to obtain; those produced were quite weak. As the ice divide was approached the quality of the reflections improved, though their amplitude continued to be small.
Relevant portions of several of the seismograms recorded at shot-points along the profile are presented in Figures 3–12. Salient features of these records are described below:
Post 25 (Fig. 3)
This record is typical of those obtained near “Byrd” station and post 25, and in the region between posts 35 and 73. The approximate commencement of the reflection is indicated by the vertical arrow. The reflection amplitude is barely above the noise level and the wave trains are prolonged and incoherent. The direction of first motion is impossible to determine in this case.
Shot-point 2901 (Fig. 4)
This is representative of the region between posts 25 and 29. While the reflection is quite strong on some of the traces, the initial movement is frequently obscured by noise. The best- defined motion is on trace number 14, where there is a sharp break downward, which is in-phase with the direct wave arrival (not shown). Traces 15 and 24 are similar, but there is some ambiguity because of a small upward motion immediately preceding the downward break.

Fig. 3. Section of seismogram from shot-point at post 25 showing reflection arrival (arrow). The time interval measured by the fine vertical lines is 10 ms.

Fig. 4. Section of seismogram from shot-point 2901 showing reflection arrival (arrow).
Post 34 (Fig. 5)
This point and the two that follow are close together, being located within a circle of four kilometers diameter. On this record the direct arrivals (left) are all very strongly downward. The reflected wave (right) is well recorded on traces 19-24. The initial motion requires careful interpretation. The first emphatic movement is clearly upward, but there is a small downward motion of relatively short period immediately preceding it on several of the traces. This precursor is similar in amplitude and period to the noise that precedes the reflection and is significantly smaller in amplitude and period than the waves that clearly comprise the reflection. Furthermore, a qualitative comparison of the strong direct-wave motion and the reflection wave train suggests that the first reflected motion would have amplitude above the noise level. Consequently, the author ascribes the apparent precursor to noise and interprets this record as a phase reversal.

Fig. 5. Sections of seismogram from shot point at post 34. In this figure and the following ones the arrivals of the direct wave are shown on the left, and the reflected wave on the right.
Post 35 (Fig. 6)
Here the direct arrivals are strongly downward and the reflections, which are well recorded on traces 1 to 5, begin with an upward motion, except for trace 4. On this trace, the first motion is obscured by noise and its direction is ambiguous, though the rest of the reflected wave train is coherent with the wave trains on the other traces. So, with the possible exception of trace 4, a phase reversal is indicated for this record.
Shot-point 1801 (Fig. 7)
Moderate downward motion is seen on traces 2-5 for the direct arrivals. The reflected wave is seen clearly on traces 2-4, and the apparent first motion is small and upward. While this reflection is weak and somewhat masked by noise, the sharpness of the break on traces 2 and 3 is persuasive evidence of a phase reversal.

Fig. 6. Fig. 6. Seismogram from .post 35.

Fig. 7. Seismogram from shot-point 1801.

Fig. 8. Seismogram from post 33.

Fig. 9. SeismogramJrom shot-point 2009.

Fig. 10. SeismogramJrom post 87.
Post 33 (Fig. 8)
This shot-point is near the previous three. The direct arrivals on traces 7—12 are strongly downward, and the first motion on the reflection is also strongly downward on all traces, so the reflected wave has clearly not changed phase.
Shot-point 2009 (Fig. 9)
This record is from the same general area as the four preceding ones and is typical of the region between post 29 and post 35. The initial direct wave has moderate downward motion. The reflection is of moderate amplitude and is reasonably coherent. The reflection appears to commence with the wave crests that have been marked, which would indicate phase reversal, but there is so much noise that the actual first motion is uncertain.
Post 87 (Fig. 10)
This record is typical of the area of relatively rugged subglacial topography south-west of the ice divide. The direct arrivals are all downward (except trace 8, which has reversed polarity). The reflections are very weak, and the initial motion is difficult to define. Trace 4 and its mirror image, trace 8, suggest phase reversal, but traces 2 and 7 do not. The phase relationship here is considered ambiguous.
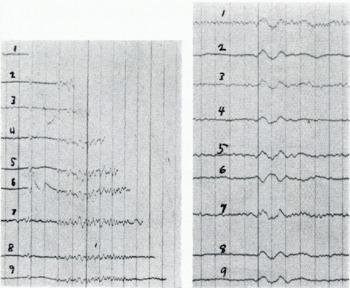
Fig. 11. Seismogram from post 93.
Post 93 (Fig. 11)
On this record the direct wave arrivals are downward on all traces except number 6, which has reversed polarity. The reflections are weak, but the first motion is consistently the same as in the direct wave, except for the questionable trace 3. Note that the reflection wave-form in trace 6, which has reversed polarity, is virtually a mirror image of the adjacent traces. A reflected wave of unchanged phase appears to be indicated at this point.
Post 105 (Fig. 12)
This record from the ice divide is very similar to the previous one. The first motion is downward on all traces except for number 3, which has reversed polarity. The reflections are weak, but they consistently show an initial downward motion (except on the mirror trace 3) that is comparable in wave-length and coherent with the rest of the reflection waves. It seems reasonable to interpret this as a wave that has not changed phase upon reflection.
Discussion
The seismograms presented here illustrate the fact that although the direct-wave motion is almost always strong and clear on the records, the reflected waves are often too weak, or the initial movement of the traces is too indistinct or too obscured by noise, for a conclusive phase comparison to be made. Nevertheless, some conclusions can be drawn from the data.
The non-reflecting character of the lower part of the profile indicates that this section of the ice sheet is underlain by material with an acoustic impedance approximately equal to that of ice. The most likely media would appear to be wet moraine, recent sediments, or volcanic ash.

Fig. 12. Seismogram from post 105.
Basal conditions in the vicinity of post 35 are apparently complex. Reflections of both unchanged and reversed phase are obtained at adjacent shot-points, indicating highly localized reflectivity variations. It may be that there are small subglacial pools of water or sediment of very low acoustic impedance interspersed with hard rock boundaries (such as Byrd subglacial basin rocks) in this region. Bentley and Clough (1971 [b]) found evidence of such spottiness at their site 4 (see Fig. 1).
The middle part of the profile is again largely non-reflecting or ambiguous, suggesting a subglacial layer of saturated sediments. Radio-echo sounding in this region has produced no evidence of a subglacial water layer (personal communication from I. M. Whillans).
In the neighborhood of the ice divide reflections of moderate amplitude and apparently unchanged phase are recorded. The base of the ice sheet is lower here and the ice thicker than at ‘'Byrd station, where the base has been found to be at the pressure melting point, so it is unlikely that the bed would be frozen in this region (see Reference Budd, Budd, Jenssen and RadokBudd and others, [1970). It may be that the base of the ice sheet is resting directly on wet rock or, if there is a layer of sediment present, as seems likely in this part or the Byrd subglacial basin, it is probably highly compacted.
Because of the difficulty of obtaining high-quality seismic reflection records under Antarctic conditions, the method illustrated herein may be of limited effectiveness for locating areas in which the base of the Antarctic icc sheet is melting. However, field experience suggests that more consistent results could be obtained from an exploration program that is specifically designed for this purpose. Such a program might emphasize:
-
Heavier explosive charges than are normally used to produce seismic reflections in a depth-sounding survey.
-
Deep (sub-firn) shot-holes,
-
Intensive experimentation to determine optimal instrumental parameters.
-
Particular regard for favorable weather and seasonal conditions for shooting.
It is also suggested that an examination of existing seismograms from the many geophysical traverses that have been completed in both the continental and ice-shelf regions of Antarctica and Greenland might yield significant data of the type described here concerning ice-sheet bottom conditions.
Acknowledgements
This work was carried out with the cooperation and assistance of the Institute of Polar Studies, Ohio State University.
Discussion
C. STERLING: Could you tell us something about the instrumentation, such as: what kind of did you use, what kind of recording system, and did you use for producing signal?
G. DEWART: This program used a standard, commercial seismograph system of the type used in petroleum prospecting. The geophones were of the “vertical” type, 20-30 Hz Most shots were made with wide filter settings, 5-500 Hz, linear gain. 1-2 kg of 60% dynamite explosive, butted at 0-5 m, were used at most shot points. I would prefer to shoot at much greater depths (in the firn-ice zone) and use larger shot-loads for this particular work.
J. W. GLEN: Can ice be treated as non-dispersive to the extent required for the wave form within its envelope to be unchanged? If it is not, then we could get apparent phase reversal from this effect even without a phase-reversing reflection. The corresponding radio-echo question also needs some thought.
DEWART: The homogeneity of the ice column as indicated by the bore-hole sounding at "Bytd" station, the large wave-length in comparison with crystal size, and the relatively short path with respect to wave-length, should minimize dispersive effects. The direct wave which is refracted through a velocity gradient, might be expected to show dispersion, but this can be checked from the geophones along the spread, and it does not appear to occur to a significant degree.
M. M. Miller: Concerning the identification of basal wet zones in west Antarctica apparently your phase-change analysis has not revealed any thick sub-glacial zones of liquid water. But assuming that such may exist, is it not of value also to analyse the shear-wave absorption to supplement the phase-reversal information? In refraction, of course, this would require a fairly broad sub-glacial water zone and one of a magnitude of tens to hundreds of meters thick. What are the future prospects of this multiple geophysical approach ?
Dewart: I believe that there is a great potential for the use of both shear and compressional waves in glacier seismic studies. So far, the main restriction has been the low production capability of energy in the shear mode. 1 understand that technical advances are curretl y being made in this field. Shear waves are produced by mode conversion in wide-angle and refraction shooting, and here they can be of great value. However, such studies, because of their scale, have been rare in the Antarctic. I would welcome more of this type of work.
R. H. Goodman: Measurements of dispersion in region i kHz to 77 kHz indicated that this dominates in the region of 8 kHz. Since this is probably due to the acoustic phonon spectrum in ice, you should not ignore this problem.
DEWART: NO doubt some dispersive effect exists, but the shot transmission paths we are dealing with here, wave-lengths of 10-3o m, over paths of up to 6 km, keep it at an insignificant level for our purposes.
J. F. NYF: I think the theory you used to decide whether a phase reversal takes place on reflection is for a perfectly flat surface. When the surface is rough on a scale larger than a certain fraction of a wave-length, I believe the criterion for an apparent phase reversal might depend also on the roughness. How would you distinguish this case ?
Dewart: Certainly I would like to use this method for other than flat “sub-ice lake” surfaces. I believe that roughness effects can be minimized statistically using a lot of detecting points and by varying the shot geometry and the frequencies observed. But roughness may account for the frequent difficulty in finding a “good” record for the purpose of this study.
Nye: Have you or any others present any comment on whether your phase-reversal technique could be applied in radio-echo sounding, as well as in acoustic echo-sounding;
Dewart: 1 would like to make a comparison of seismic and radio-echo records from the same localities. This seems to be the next logical step in this study.
W. H. Mathews: What minimum thickness of water-saturated or water layer is required to produce a reversal of phase?
Dewart: TO produce the reversed phase a mere film or water, if continuous, would suffice However, because of interference from the reflection from the substratum, the phase would probably be indistinguishable unless you had a water layer of thickness of at least hall a wave-length, or a minimum of several meters.


