


1 Introduction
In our information-overloaded society, the public benefits from the abundance of information, but also suffers from its redundancy (Reference Holton and ChyiHolton & Chyi, 2012). One of the main aspects of information redundancy is repetition (Reference bazzanellaBazzanella, 2011).
Social media have been a faster and more effective platform for risk communication than traditional media. Ian O’Neill and Morgan Hill noted a remarkable increase in earthquake-related tweets right after the two earthquakes at California in 2009 (Reference Earle, Guy, Buckmaster, Ostrum, Horvath and VaughanEarle et al., 2010). Recent research on social media suggests that reporting is dominated by few users, whereas most users just forward or retweet the existing messages (Poell & Borra, 2011). Therefore, repetition of breaking news may increases rapidly on social media.
Imagine that a schoolmate posted a status on Facebook about a suspected food poisoning in the campus café where you consume a lot. Most of your friends forwarded this message to you. Therefore, you read repeated food poisoning messages with highly similar content. How would you evaluate the risk of food poisoning in the campus café?
Psychological research provides a large volume of evidence that repetition shapes an individual’s emotions (Reference BornsteinBornstein, 1989; Reference ZajoncZajonc, 1968; Reference ZajoncZajonc, 2001), attitudes toward advertisements (Reference NordhielmNordhielm, 2002), and persuasive credibility (Reference Koch and ZerbackKoch & Zerback, 2013). But these studies focus mainly on the repetition of positive and/or neutral stimuli. How repetition of a crisis report affects perceived risk is not yet clear.
In this article, we explore how repetition of media report on technological risk event influences people’s risk perception. We hypothesize an inverted U-shaped relationship between repetition and perceived risk. We assume a direct increasing effect of repetition on perceived risk, which means people are inclined to rate higher risk on the event that they repeatedly encounter. In contrast, the second effect, a decreasing effect of repetition on perceived risk, occurs when repetition is taken too far. People over-exposed to the repetition tend to perceive the risk as less dangerous. To summarize, we assume two counteracting effects of repetition, an increasing effect and a decreasing effect, result in the inverted U-shaped curve.
1.1 Repetition and the inverted U-shaped model
Since Zajonc’s original research on mere-exposure effect (Reference ZajoncZajonc, 1968), the relationship between repetition and affective rating has been investigated across various domains from interpersonal attraction (Reference Saegert, Swap and ZajoncSaegert, Swap & Zajonc, 1973), advertising (Reference NordhielmNordhielm, 2002) and food preference (Reference Heath, Houston-Price and KennedyHeath, Houston-Price & Kennedy, 2011), to aesthetic judgements (Reference Meskin, Phelan, Moore and KieranMeskin, Phelan, Moore & Kieran, 2013). There are two patterns—the monotonic increasing relationship and the inverted U-shaped curve—reported in the literature (Dechêne, Stahl, Hansen & Wänke, 2010; Nordhielm, 2002; Zajonc, Shaven, Tavris & Van Kreveld, 1972; see Bornstein, 1989, and Zajonc, 2001, for reviews).
Nordhielm (2002) demonstrated that the level of processing moderated the effect of repetition on affective response. He found that, when respondents had ample opportunity to consciously process the stimuli being repeated (deeper processing), modified two-factor theory provided a robust explanation on the inverted U-shaped pattern; but when deeper processing of stimuli was impeded (when participants were able to engage only in shallow processing of the surface features of the stimuli), the perceptual fluency/misattribution model provided a better explanation. In his experiment, when participants were encouraged to process the ads in deeper manner (focus on the semantic content), their affective rating to the ads showed an inverted U-shaped pattern with the repeated exposure. In contrast, in the shallower condition (participants were manipulated to focus on the non-semantic content), no downturn on affective judgment was found.
In the present study, we are interested in how repetition of technological risk reports affects public perceived risk. We paraphrase real world media reports as the exposure source and provide sufficient time for participants to process the semantic meaning of the messages. Therefore, we predict that participants process stimuli in a deeper manner and that the repeated news reports will result in an inverted U-shaped curve for risk perception.
According to Nordhielm (2002), “the modified two-factor theory builds on Berlyne’s model by associating positive habituation and tedium with positively and negatively valenced thoughts, respectively.” The affective judgment on the stimuli is determined by the net of positive and negative thoughts. Initial repetitions generate mostly positive habituation. Therefore, the number of positive thoughts increases over these initial presentations, whereas later repetitions generate increasing tedium and more negative thoughts. Positive thoughts initially increase the affective evaluation but then decrease the counteracted effect of negative thoughts.
Given the differences between our design and previous studies, we believe it worthwhile to investigate whether the modified two-factor theory still works in this particular content. On one hand, the range of stimuli is extended. Typically, neutral stimuli (e.g., nonsense syllables) were used to avoiding influence of prior experiences and associations (see Bornstein, 1989 as a review). Compared to the colossal amount of research presenting neutral stimuli, few experiments have studied stimuli that cause negative affective and/or cognitive responses (see Reference Saegert, Swap and ZajoncSaegert, Swap & Zajonc, 1973, as an example). We used media reports about technological risks as negative stimuli, which may cause participants’ negative feeling such as threaten and worry. On the other hand, this study also broadens the outcomes of mere exposure. Past research mainly focused on the affective response to exposure (see Zajonc, 2001 as a review). We investigate the perceived risk, which is related to both affective feelings and cognitive judgment.
1.2 The inverted-U of perceived risk
Risk information, as a negative stimulus, is different from the neutral or positive stimuli used in prior research. How modified two-factor theory works in this new content need to be clarified.
We assume an increasing effect of repetition on perceived risk, because the initial repetition stresses the accessibility of risk (Reference Feldman and LynchFeldman & Lynch, 1988) and enhances the credibility of the statement (see Dechêne, Stahl, Hansen & Wänke, 2010 for a review). However, with the increase of repetition frequency, participants who are over-exposed to the risk reports tend to perceive the risk as less severe. The excessive repetition reduces individuals’ emotional response through habituation and thus weakens credibility.
1.2.1 Increasing effect
As mentioned above, the initial repetition highlights the salience of the risk message, the risk become more accessible to responders’ mind and the statement become more creditable.
First, a higher frequency of repetition increases the accessibility of the risk event, which refers to how easily a piece of encoded information can be recalled from memory (Reference Feldman and LynchFeldman & Lynch, 1988). The accessibility will increase people’s risk perception (Reference Raghubir and MenonRaghubir and Menon, 1998). For example, Agha (2003) found that consumers exposed to mass media campaign on AIDS prevention perceived AIDS more severely and believed that they had a higher rate of becoming infected with HIV.
Second, repetition increases statement credibility, which refers to a person’s subjective impression that the statement is true (see Dechêne, Stahl, Hansen & Wänke, 2010, for a review). Information credibility also has a positive influence on risk perception, in a study based on a survey data after an earthquake (Reference Zhu, Xie and GanZhu, Xie & Gan, 2011). Hence, risk perception could be positively related to the initial repetition.
1.2.2 Decreasing effect
In addition, we also hypothesize a decreasing effect of repetition on perceived risk, which counteracts the increasing effect just described.
Can negative information, which is disliked by individuals or brings negative emotions, leads to positive results in turn? Several studies show that negative stimuli enhance favorable attitude in arts (Reference Schellenberg, Peretz and VieillardSchellenberg, Peretz & Vieillard, 2008), food consumption (Reference Heath, Houston-Price and KennedyHeath, Houston-Price & Kennedy, 2011), and social interactions (Reference Zebrowitz, White and WienekeZebrowitz, White & Wieneke, 2008). These studies show repeated negative information that evokes positive outcomes, such as liking and preference. It is reasonable to deduce that repeated risk message might also help to facilitate positive thoughts and decrease perceived risk.
First, repetition helps to reduce the over-reaction to threatened objects (Reference Foa and KozakFoa & Kozak, 1986). The literature on exposure therapy also implies that exposure helps to reduce over-reactions, such as fear and anxiety, to the threatened stimuli (Reference AbramowitzAbramowitz, 2013). Similarly, repeated exposure of risk information could decrease the negative cognitive and emotional reactions through accumulation of familiarity. A large amount of risk research has shown that familiarity is an important factor to decrease risk perception (Reference SlovicSlovic, 1987; Reference Covello, Peters, Wojtecki and HydeCovello, Peters, Wojtecki & Hyde, 2001; Reference Slovic and VästfjällSlovic &Västfjäll, 2010; Reference Song and SchwarzSong & Schwarz, 2009). The high frequency of repetition facilitates individuals’ feeling of more familiarity with the risk to decease their risk perception.
Second, frequent repetition of a statement may trigger reactance, decreasing its credibility. Reference Koch and ZerbackKoch and Zerback (2013) found that the credibility of a statement increases when it is repeated, but it becomes weaker and even reverses when it is frequently repeated. Excessive repetition increases the recipient’s perceived intent to persuade and thus decreases statement credibility, which, in turn, can lead to decreased risk perception.
We have explained two contradictory effects, an increased effect and a decreased effect. Moreover, we hypothesize that these two effects have different time courses. Reference Koch and ZerbackKoch and Zerback (2013) pointed out that credibility increased in the beginning but then decreased when the information was over-exposed. They argued that the reactance effect occurred later, so that a higher level of repetition of semantic stimuli was needed to show the downturn pattern. Hence, we hypothesize an inverted U-shaped relationship between repetition and perceived risk is possible, given sufficient times of repetition. But we have no specific assumption about the peak point of the inverted U-shaped curve, because the exact time course when the decreased effect occurs has not been predicted by previous theory.
2 Experiment
We conducted an experiment to demonstrate the inverted U-shaped function for repetition on perceived risk using randomly spacing of a target message on food risk.
2.1 Participants and procedure
A total of 138 college students (37 males) from Peking University took part in the experiment. They were recruited through an online post. Their average age was 22.88 years (SD = 2.83).
The research assistant ushered the participants into the computer laboratory and instructed them to complete a study of media. They were told to read 3 pages of information driven from Sina Weibo (a micro-blog service likes Twitter) carefully at their regular reading speed. Each page contained 20 messages, and each message was below 140 Chinese characters.
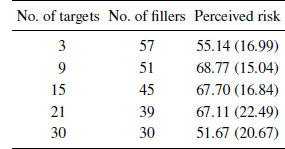
Participants were randomly assigned into 5 conditions with different levels of repetition frequency, that is 3, 9, 15, 21 and 30 repetitions (Table 1). The computer program randomly mixed up the target messages and fillers for each participant.
Table 1: Conditions design and mean (s.d.) of perceived risk.
The target message was a food risk report entitled “Illegal additives found in Brand R energy drinks.”Footnote 1 We paraphrased the report into three highly similar versions to make the reading materials more realistic and to reduce suspicion. The three versions have only trivial changes and no differences in their main information:
Version 1. The FDA of Harbin City finds that the component table on Brand R energy drink is different from its product license. Additives such as carmine, which is not allowed by national regulation, are found.
Version 2. Brand R energy drink don’t declare all the raw materials on its component table on the label as required by regulations. Some illegal additives in the drink (i.e. carmine) are found, according to the local FDA.
Version 3. The FDA of Harbin City states Brand R energy drink contains some illegal additives such as carmine. These additives are not declared on the component table of the energy drink.
The other messages were irrelevant fillers. We pre-tested the fillers in another sample of 30 college students. They read the fillers and answered the question “how positive or negative do you feel about this message (1=very negative, 4=neutral, 7=very positive).” We selected 30 fillers that were rated from 3.5 to 5.5 to make sure the fillers are neutral. There is an example of the fillers.
Filler.Three tips for drinking healthily: 1) Do not only drink water until you are thirsty. Try to drink at least 4–6 times per day. 2) Warm water is better than icy water to quench your thirst. 3) Swap out one soda per day for a bottle of water.
This filler was presented as one filler in the 30-targets/30-fillers condition; whereas it was divided into 3 fillers in other conditions with more fillers.
Filler 1a. Tip for drinking healthily: Do not only drink water until you are thirsty. Try to drink at least 4-6 times per day.
Filler 1b. Tip for drinking healthily: Warm water is better than icy water to quench your thirst.
Filler 1c. Tip for drinking healthily: Swap out one soda per day for a bottle of water.
With these splitable fillers, we made sure that the content of fillers was the same across five conditions, whereas the numbers of the fillers was varied.
After reading the three pages of information, participants answered the manipulation check question: “Is the message presented in the reading section? 1) Bank staff leaks clients’ private information, 2) Tips for choosing fresh vegetable, 3) Top 10 desserts, 4) Illegal additives of Brand R energy drink, 5) Kodak files for Bankruptcy Protection, 6) Auction of Sunken treasures discovered around Indonesia, 7) Plankton affects future climate, 8) Brain mechanism of stutter.” This question (allowing a yes/no answer for each item) allowed us to identify whether the participants noticed our target message. If they chose No. 4, they noticed the target information.
The participants rated their perceived risk from 0 to 100 on three items about likelihood of harm, seriousness, and anxiety of the Brand R energy drink. These psychometric dimensions are suitable for the food hazards and have been used in both English and Chinese Contexts (Reference Kirk, Greenwood, Cade and PearmanKirk, Greenwood, Cade & Pearman, 2002; Reference Xie, Li and YuXie, Li & Yu, 2008). The Cronbach’s alpha of these three items was 0.83. The items we used are as follows:
“How likely is it that your health will be damaged by drinking Brand R energy drink? (Not likely at all to extremely likely)”
“How seriously do you think the Brand R energy drink may harm your health? (Not serious at all to extremely serious)”
“How worried are you about potential risks associated with Brand R energy drink? (Not worried at all to extremely worried)”
Following the measure of risk perception, the participants rated “How much effort does it take to finish the reading materials?” on a 7-point scale (1 = extremely effortless, 7 = extremely effortful). We also used a website plus-in tool to record the reading time of each participant as a control variable.
After the participants finished all the tasks in the experiment, they were paid and debriefed on the purpose of the study.
2.2 Results
All the participants noticed the target information. The reading effort and time did not differ between five groups, so they were not included as covariates. We averaged the three items (likelihood of harm, seriousness, and anxiety) as the index of perceived risk.
The one-way ANOVA test showed that the repeating frequency had a significant influence on perceived risk. F(4,133) = 5.08, p < .001, η2 = 0.13. Figure 1 shows the effect of repeating frequency on perceived risk. We also conducted a curve fit test and found that the relation between repeat frequency and perceived risk fits the quadratic model, F (2,135) = 9.70, p = .000.
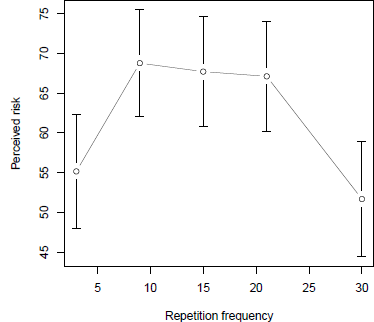
Figure 1: The effect of repetition frequency on perceived risk, with 95% confidence intervals.
The pairwise comparisons showed participants that read 3 repeated target messages rated the risk significantly lower than participants that read 9, 15, 21 repeated messages, p = .007, p = .014, p = .019, respectively. Similarly, participants that read 30 repeated messages rated significantly lower risk than participants that read 9, 15 and 21 repeated messages, p = .011, p = .002, p = .003, respectively. No significant difference was found in other pairs, ps > .50.
Using the randomly distributed target message about illegal additives in an energy drink, we found an inverted U-shaped relationship between repetition and perceived risk. The pairwise comparisons indicated that from a low repeating frequency (3-targets/57-fillers) to a moderate repeating frequency (9-targets/51-fillers, 15-targets/45-fillers and 21-targets/39-fillers), the risk perception of the energy drink increased. Conversely, from a moderate repeating frequency to an extremely high repeating frequency (30-targets/30-fillers), the risk perception steeply decreased.
3 General discussion
To the best of our knowledge, no researcher has ever directly demonstrated the turning point of perceived risk in repetition frequency. We found a U-shaped relationship between repetition frequency and perceived risk when the target message about food risk was randomly spaced.
3.1 Negative stimuli and the mere-exposure effect
Psychological research has accumulated a large literature on the mere exposure effect of neutral stimuli, its reasons, and its outcomes (see Bornstein, 1989; Zajonc, 2001 as reviews). However, for the negative or threatened stimuli, the literature is insufficient and controversial.
Reference Meskin, Phelan, Moore and KieranMeskin, Phelan, Moore and Kieran (2013) argue that the effect of exposure is sensitive to value because mere exposure to bad art tends to make people like it less. By contrast, evidence also shows that exposure to negative stimuli (e.g., out-group members, sad music, disliked vegetables, etc.) promotes positive outcomes, such as affective liking and behavioral preference (Reference Zebrowitz, White and WienekeZebrowitz et al., 2008; Reference Schellenberg, Peretz and VieillardSchellenberg et al., 2008; Reference Heath, Houston-Price and KennedyHeath et al., 2011).
This research complements that on the mere-exposure effect by introducing the relationship between risk information exposure and perceived risk. Perceived risk reached its peak at a moderate frequency of repetition and decreased at a high frequency. These findings suggest that moderate exposure to risk information maintains higher perceived risk, whereas over-exposure can surprisingly mitigate perceived risk in risk communication. Our finding is consistent with that of previous research on the mere-exposure effect for neutral stimuli, which also finds an inverted U relationship (Reference Koch and ZerbackKoch & Zerback, 2013).
Our findings support modified two-factor theory, which determines two counteracting effects of repetition (Reference BornsteinBornstein, 1989). We suggest that future research on negative mere exposure examine the positive and negative outcomes together as the net of these two kinds of thoughts determines attitude and preference.
3.2 Risk information exposure: Advantage or disadvantage
Media report volume is a generally recognized source of the public’s perceived risk. Previous research mostly hypothesize and report a linear relationship between media report volume and perceived risk; that is, the amount of media reports on risk events is positively correlated with the public’s risk perception (see Bakir, 2010 for a review).
We tested and verified the existence of the mere-exposure effect in the area of risk perception, going beyond other studies of cognition, advertising, and persuasion (Reference BornsteinBornstein, 1989; Reference NordhielmNordhielm, 2002; Reference Koch and ZerbackKoch & Zerback, 2013). By clarifying the two counteracting effects of repetition, this study complements the traditional view of media report volume. Our findings may also be relevant to research on the affect heuristic for risk perception (Reference Slovic and VästfjällSlovic & Västfjäll, 2010).
From a practical perspective, our findings indicate that the increasing exposure of media reports could be either advantageous or disadvantageous. Repetition can either strengthen or weaken an individual’s risk perception at different levels. The announcement frequency of risk regulators can influence the public’s perceived risk, which peaks at a moderate level of repetition.
Over-exposure to risk information is inevitable when dealing with a flood of information in a world full of risk and uncertainty. Previous research has focused on the negative outcomes of overload on risk information (Reference Jensen, Carcioppolo, King, Scherr, Jones and NiederdieppeJensen et al., 2014). Our findings indicate that exposure can be a double-edged sword that brings either increasing or decreasing perceived risk.
3.3 Limitation and future directions
The study has several limitations. First, we connected the repetition frequency and perceived risk through several possible mediators such as subjective familiarity, accessibility, and creditability in our hypothesis development, but we did not explore their mediating roles. The mechanism of the inverted U-shaped model and the mediators is not yet clear. In addition, the time courses of the two counteracting effect is unknown. Future work is needed to uncover the psychological process of risk information exposure and perceived risk.
Second, the external validity of the laboratory experiments might be questioned. The judgment of the participants might be different from their reactions when they freely skim through the Internet. For example, participants were instructed not to memorize the messages, but a few of they still committed them to memory unconsciously. Recent studies show that selective attention and memory affect the mere exposure effect (Reference Huang and HsiehHuang & Hsieh, 2013). Future studies may adopt field studies to obtain better external validity.
In summary, we provide an integrated view to comprehend the relationship between media volume and perceived risk on the base of an exposure effect in a lab experiment. Further investigation on mediators or real world data is needed to deepen our understanding of this area.


 Open access