


Introduction
Fluorescence microscopy has played an important role in the recent advancements in live cell imaging (LCI), helping to unravel the complex processes that control cellular function. Alongside various sophisticated light microscopes in the world's biomedical facilities, a toolbox of specific fluorescent probes, laser light sources, digital camera systems, image analysis software, and inexpensive computing power combine to make advances almost routine.
However, LCI still poses a number of challenges for the researcher. Fluorescence microscopy techniques require the use of labeling agents to obtain high-contrast molecular information, but these agents can interfere with normal molecular activities. Labeling is also a time-consuming procedure, and the phenomena of photobleaching and phototoxicity limit repeat measurements. Cells that need to be analyzed and then reinserted into the body for in vivo studies, such as stem cells or immune cells, pose an especially difficult challenge.
That same availability of laser-illuminated imaging systems, computing power, and sophisticated software has contributed to a new 3D imaging technology that relies on a fundamental property of light employed by Frits Zernike in 1934 [Reference Von Zernike1]. His phase-contrast microscope measured variations in light as it passed through transparent specimens, revealing details of cellular structures without fixing and staining. Now, quantitative phase imaging (QPI) technology, pioneered by Tomocube, is breaking new ground in LCI, providing a label-free, real-time means to image and measure live cells and tissues in three dimensions. The holotomography (HT) microscope delivers nanoscale, real-time, dynamic images without any sample preparation. The latest Tomocube HT microscope combines QPI technology with fluorescence for state-of-the-art spatiotemporal resolution as well as high molecular specificity. This article introduces the technology behind HT, examines its advantages for LCI, and reviews potential applications for 3D QPI combined with fluorescence techniques for correlative studies of cell pathophysiology.
Materials and Methods
How holotomography works.
Refractive index (RI) is a fundamental optical parameter describing the speed of light passing through an object. As light traverses the object, the specimen material scatters the light and changes the phase of the light. If a living cell is viewed, then the various constituents of the cell scatter the light differently according to their RI. Phase contrast microscopy, where light emerging from the specimen constructively interferes with a separate beam of light that did not pass through the specimen (reference beam), produces small but observable brightness differences caused by the degree of the phase shift. These brightness variations result in contrast that reveal the features of an object. In this way, the dynamics of biological processes may be observed and recorded in fine detail.
The Tomocube HT microscope expands the concept of phase contrast to reveal details of the sample in a 3D tomogram. The sample is held on a stage between the objective and condenser lens. A 532 nm laser beam is split into two optical paths: an imaging path to illuminate the sample and a reference path (Figure 1). Light in the imaging path is expanded to fill the reflector area of a Texas Instruments digital micro-mirror device (DMD), which consists of several hundred thousand micromirrors arranged in a rectangular array. Electronic control of the light path through the DMD eliminates moving parts for better stability and improved image resolution. Since each individual mirror can be rapidly tilted ± 12° electronically, the DMD can be directed to create a mirror pattern which can rotate the beam through 360° around the optic axis at an angle of 53°. As the beam rotates, the data required for reconstruction (48 images of 1k × 1k) is acquired in less than a second. Each data set from the sample is combined with the reference beam to create 2D interferograms from which the RI is calculated for each voxel in the image. When the resulting multiple 2D RI measurements are stitched together a 3D RI tomogram image is displayed. Image data are “super-resolved” with voxels of about 110 nm × 110 nm × 220 nm. Selected bands of RI can be pseudo-colored to highlight structures within the cell.

Figure 1: Schematic light path. The sample is located on the stage between the objective and a condenser lens. A laser beam is split into specimen and reference beams. The specimen and reference beams generate a 2D hologram, which is recorded by a digital camera. Under the control of the digital micromirror device (DMD), the laser illuminates the specimen by rotating the incident beam about the optic axis at an incident angle of 53°. A 3D RI tomogram of the sample is reconstructed from the measured multiple holograms acquired at various illumination angles.
Holotomography capabilities.
The HT microscopy method exploits the intrinsic optical properties of all materials. It directly measures the optical phase delay introduced by RI differences between the sample and its medium directly. In doing so, it eliminates the need for stains or other labeling agents to quantitatively and non-invasively investigate biological cells and thin tissues. Because the RI values are measured quantitatively, HT microscopy provides quantitative data about the sample, including morphological and chemical information. The reconstructed 3D RI distributions of biological material provide information about dry mass, cell volume, shapes of sub-cellular organelles, cytoplasmic density, surface area, and deformability. Furthermore, since the method requires only a low-power laser system, compared to laser scanning microscope systems, HT microscopy minimizes the potential for photobleaching and phototoxicity. Figure 2 shows an example of holotomographic capture of 3D images of live cells without exogenous labeling agents, imaging cell membranes and organelles at a resolution of 110 nm.

Figure 2: Label-free 3D image of C. elegans: (left) Single frame from a video shows the entire worm image of C. elegans, acquired without labeling using the Tomocube HT microscope equipped with motorized stage. (right) Representation of 3D image showing organelles in different colors. To download the image, please use this link: http://www.catalystforcontent.com/uploads/simplex/images/pr/images/Tomocube_C_elegans_stitch.jpg.
Large fields of view and long-term imaging.
Another aspect of HT offered by the HT microscope is the opportunity for safe, long-term study of live cells on a large scale. This is possible, in addition to minimal specimen damage, because of the instrument's motorized stage and custom-designed stitching software developed in cooperation with the renowned Korea Advanced Institute of Science and Technology (KAIST). After an image is acquired at one position, the specimen is moved along the X and Y axis at 70 μm per step via the computerized stage to acquire the next image. By stitching these images together, specimens up to 8 mm × 8 mm can be imaged in their entirety, with 2D and 3D image acquisition rates of 150 and 2.5 frames per second, respectively. Because the HT microscope only needs a low-power laser to image live cells and tissues in three dimensions without stains or fluorescent probes, these long-term studies can be conducted without the fear of photobleaching and phototoxicity impacting the results (Figure 2).
Fluorescence, then holotomography.
While the label-free and high-speed 3D imaging capabilities of holotomographic QPI are highly advantageous for long-term LCI, it would be useful to combine HT with standard fluorescence microscopy to obtain molecular specificity of the same specimen area. In such a multipurpose instrument, 3D QPI and fluorescence could be used in concert to create a correlative imaging partnership. This is the idea behind the design of the Tomocube HT-2 (Figure 3).

Figure 3: Tomocube HT-2 combined HT and fluorescence microscope.
The HT-2 microscope takes the existing HT setup and adds a 3D fluorescence imaging capability. The HT-2 is the first instrument of this type; it delivers HT and fluorescence correlative analysis in 2D, 3D, and 4D (including time). The microscope's 3D HT images and measurements enable the monitoring of cells and their structures with minimal stress, while highly detailed fluorescence images can be captured simultaneously to show the position of specific target organelles or molecules in the living cells.
For long-term studies especially, the combination of HT microscopy, fluorescence microscopy, computer-controlled motorized stage, and custom-designed stitching software is especially advantageous. For these studies conducted on the HT-2, potentially damaging fluorescence observations can be restricted to mapping molecular specificity, while the gentler holotomographic QPI can be employed for the longer-term observations of the same cells.
Results
Homotomography.
Figure 4 shows the power of quantitative studies using the Tomocube HT-1 microscope alone. The time-lapse 3D images here have provided important insights on the mechanism of Toxoplasma gondii infecting an ARPE-19 cell. The ARPE-19 cell is shown dying, following penetration.

Figure 4: Time-lapse 3D images of Toxoplasma gondii infecting an ARPE-19 cell, which undergoes death as it is penetrated. Time-lapse 3D images can provide insights into the mechanism of infection. Tomographs acquired with the Tomocube HT-1 HT microscope.
Addition of fluorescence.
The intriguing prospects for QPI with fluorescence correlative microscopy in LCI studies are indicated in a recent review published by Kim et al. [Reference Kim2]. The group examined published studies of cell pathophysiology where 3D QPI had been used in combination with various fluorescence microscopy techniques. Taken together, these studies confirm the demand for more detailed morphological imaging of biological samples.
In reviewing 2D work, Kim described how the axially averaged RI of cells was determined and used for the calculation of protein concentrations [Reference Lue3]. In another paper, the mitosis of a kidney cell was visualized through the quantitative phase image, fluorescence image, and their combined overlaid image [Reference Park4]. The review also highlighted the usefulness of simultaneous 3D QPI and 3D fluorescence imaging for cellular dynamics imaging, especially targeting the organelles, as phototoxicity and photobleaching can be minimized through QPI. For instance, Habaza et al. used 3D QPI and 3D confocal fluorescence imaging together for the study of yeast cells [Reference Habaza5]. Also, optical diffraction tomography (ODT) and 3D fluorescence correlative imaging have been used in RI and fluorescence tomography with optofluidic rotation (RAFTOR), which analyzed suspended cells quantitatively with molecular specificity [Reference Schürmann6]. HT combined with 3D fluorescence images also was used by Kim et al. [Reference Kim7] to image live cells for quantitative and precise spatial molecular specificity.
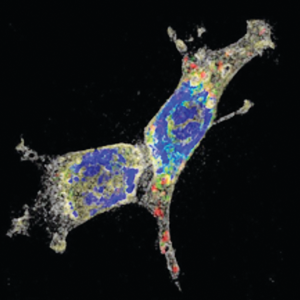
The power of QPI, and of combining this with fluorescence in a single instrument, is shown in Figure 5. This figure shows NIH-3T3 cells in both a QPI image, a 3D fluorescence (GFP-Mito and mCherry-Golgi) image, and an overlay of these two images.

Figure 5: Example of NIH-3T3 cell research showing (left) a quantitative phase image, (center) a 3D fluorescence (GFP-Mito and mCherry-Golgi) image, and (right) an overlay image. Images were obtained using a Tomocube HT-2 HT plus fluorescence microscope.
QPI, deep learning, and the fight against cancer.
Some of the latest work to be published using HT exploits the computing power that accompanies many high-end microscopy systems. Investigating the 4D interaction dynamics of T cells and their targets in the immunological synapse (IS), the joint team from Tomocube and the Korea Advanced Institute of Science and Technology (KAIST) used the reconstructed RI map from the HT-2 microscope (see Figure 6) as input for a machine-learning model to segment CD19-positive K562 cells and CD19-specific chimeric antigen receptor T cells (CAR-T19 cells), considered in some circles as the next-generation, personalized, anti-cancer treatment [Reference Moosung8]. Their results can be found at bioRxiv (https://doi.org/10.1101/539858). The study acquired 3D tomograms of the cells every 500 milliseconds to capture the RI and corresponding total protein density distributions (Figure 6). Then, the real-time, 3D analysis of the IS between the interacting cells was executed by the deep learning network. The result is automatic and quantitative spatiotemporal analyses of IS kinetics, together with morphological and biochemical parameters related to the total protein densities of immune cells. This is of special interest given that many research teams around the world are focused on the study of the IS as they try to understand at the nano-scale how immune cells recognize pathogens and malignant cancer cells.

Figure 6: Label-free immunological synapse (IS) reconstruction and quantification of the IS formation kinetics of CAR-T cells: (top) A reconstructed RI map is used as the input for the deep learning model, which segments CART19 and K562-CD19 cells and defines the immunological synapse. The color maps are based on the 2D ranges of RI and the RI gradient. (bottom) 2D projections of the 3D protein density distributions of the two cells. The immunological synapse was extracted at the cell-cell interface. The color scale provides the maximum projection of 3D protein density distributions (pg/fL) and the maximum projection of surface protein of the IS (pg/μm2).
Although it is a highly complex and potentially risky treatment, CAR-T is the first therapy specifically developed for each individual patient and involves reprogramming the patient's own immune system. The CAR-T treatment takes T-cells from patients and modifies them using advanced genetic engineering to create chimeric antigen receptors (CARs), which program the T-cells to find and destroy cancer cells when re-introduced.
Discussion
Without damaging cells or interfering with normal molecular activities, HT has begun to be successfully applied to single-cell analysis, cytology, haematology, cytopathology, and drug and toxicity reactions. This method is particularly useful when combined with fluorescence microscopy to provide the specificity of the organelles and molecules under study.
CAR-T cells.
The analysis of CAR-T cells and the study of the immunological synapse is an example of the power of this method. Although fluorescence-based techniques have proven useful in imaging the junction between immune cells and their targets, the problems of photo-bleaching, photo-toxicity, and slow imaging limit their ability to address single-cell dynamic imaging successfully. So the Tomocube and KAIST teams are now working with the HT-2 microscope's correlative fluorescence imaging to improve the precision and accuracy of the technique and provide the chemical specificities necessary to elucidate the remaining questions about IS formation mechanisms. The method could also be modified to study other areas in immunological research, ranging from T-cell receptor (TCR) signaling to cytotoxicity of innate immune cells.
Future outlook.
HT and other QPI techniques have much to offer researchers seeking to understand the complex interactions within living cells. Together with the molecular specificity of fluorescence as seen in the Tomocube's HT-2 microscope, the speed and quantitative approach of QPI are beginning to have an impact in correlative imaging. We now are witnessing the harnessing of raw computing power in the creation of large-format stitched images and the introduction of artificial intelligence and machine learning. Together, these approaches can play an important role in enhancing our understanding of the physiology and pathology of cells and tissues. Perhaps they will also make a critical contribution to the diagnosis and treatment of disease.
Conclusion
QPI and HT microscopy, enabled by today's sophisticated laser-illuminated imaging systems and computing power, are breaking new ground in LCI using the same fundamental property of light discovered in 1934. In the same way that Zernike's phase-contrast microscope detected variations in light passing through transparent specimens, the HT microscope pioneered by Tomocube delivers label-free, real-time images and measurements of cellular structures. When combined with fluorescence imaging, the Tomocube HT-2 microscope delivers HT and fluorescence correlative analysis in 2D, 3D and 4D, and recent work is harnessing artificial intelligence and machine learning to enhance our understanding of the physiology and pathology of cells and tissues and, possibly, critically contribute to the diagnosis and treatment of disease.
Acknowledgments
The author wishes to thank Dr. YongKeun (Paul) Park and his fellow scientists at the Biomedical Optics Laboratory at KAIST (Korea Advanced Institute of Science & Technology). Dr Park is the Principal Investigator of the Biomedical Optics Laboratory, and its work led directly to the founding of Tomocube where he serves as CTO.


