


Introduction
The Dutch reservoir geology for geothermal application is a mirror image of the hydrocarbon reservoir geology. The same dominant issue, productivity, is the main limiting factor in geothermal as it is in hydrocarbon exploration and production. Thus, a borehole is only a well if it produces well. The geothermal track record in the Netherlands is only a few decades old but shows a recent accelerated development. Geothermal energy is presently used for direct use purposes: heating greenhouses, spas (balneology), residential and office buildings and swimming pools. Direct use for industrial purposes and possibly conversion to power are expected to be future applications.
The Dutch geothermal plays comprise a large heat source holding 821,000 PJ, the geothermal source (Kramers et al., Reference Kramers, van Wees, Pluymaekers, Kronimus and Boxem2012). The size of the geothermal resource (Mijnlieff et al., Reference Mijnlieff, van Kempen, Tolsma, de Vries, Martins, Veldkamp, Struijk, Vrijlandt and van Wees2019) is more difficult to ascertain because project economics are included in the definition of geothermal resources (UNECE, 2016). The economy of a geothermal system relies on a lot of factors, the main ones being the difference between the production and injection temperature, the flow and the capital and operational expenditure (CAPEX and OPEX) of the geothermal project. All these factors are variable in time because drilling and extraction techniques and strategies develop, as well as external factors such as reference energy prices, policy and heat demand.
The aim of this paper is to give an overview of the Dutch geothermal plays through a general description of the geothermal development of these plays including a general description of the reservoir character.
Geothermal development in the Netherlands
Development of geothermal energy in the Netherlands only started in the late 1970s (Visser & Heederik, Reference Visser, Heederik, Visser, Zonneveld and van Loon1987). This era of geothermal exploration and development gave rise to five spa or balneology development wells, and one research/exploratory borehole, the well Asten-GT-2, for the purpose of assessing the suitability of the Lower Cenozoic sediments, first for direct heat application and secondly for high-temperature storage (Table 1). This exploration well failed to discover adequate transmissivity at that location for an economic venture of either heat production or high-temperature storage (Dufour & Heederik, Reference Dufour and Heederik2019). It was used as a groundwater-monitoring well in subsequent decades. Not only the disappointing results, but also high investment costs combined with the low energy price due to low hydrocarbon prices, halted the development of geothermal exploitation for three decades.
Table 1. Geothermal systems and wells in the Netherlands with their dominant use and system architecture (status date 1 January 2019). Note the balneological/spa wells are single well systems. The district heating and greenhouse heating installations are largely doublet systems. TES is thermal energy storage. A doublet consists of one production and one injection well. A triplet comprises three wells: at least one production and one injection well and then a third one, either a production or injection well.
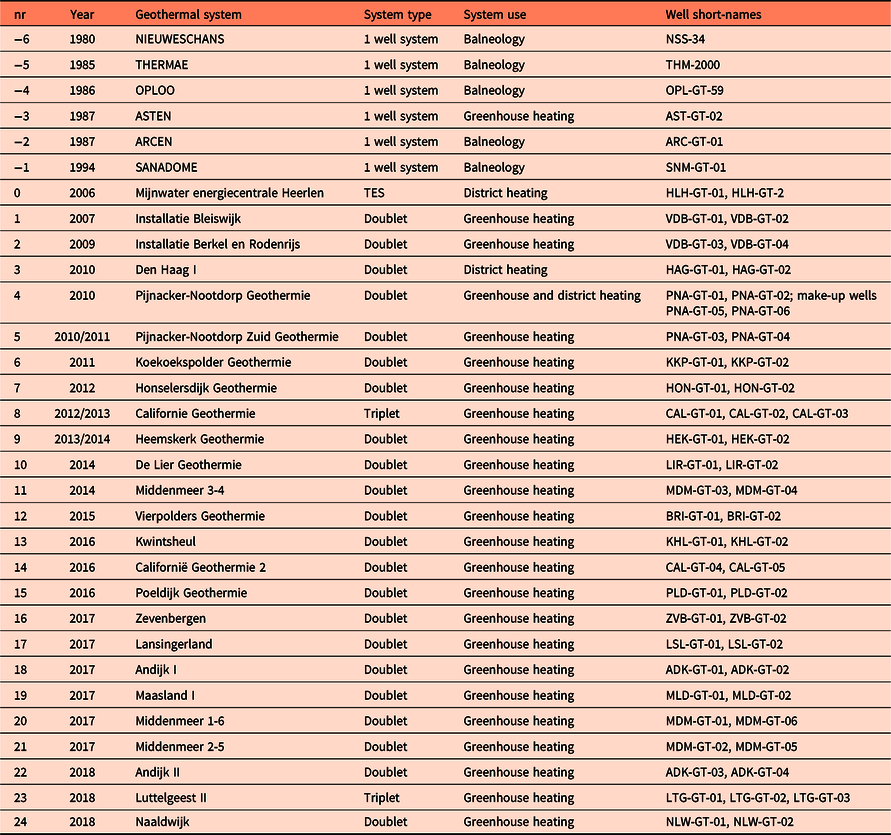
Single well systems were drilled for balneological use like Nieuweschans, Thermae-2000 and Arcen (see Table 1). For the balneological purpose, a single well system is adequate because the water is not re-injected. The target of these wells was invariable reservoirs at relatively shallow depths (c.1 km) in Lower Cenozoic sandstones, Dinantian Limestone or Zechstein carbonates.
In 2006 the Heerlen mine-water project was realised. It is regarded as a geothermal project, although it is better characterised as a thermal energy storage project (Verhoeven et al., Reference Verhoeven, Willems, Harcouët-Menou, De Boever, Hiddes, Veld and Demollin2013). Despite the fact that the thermal energy is stored within shafts and galleries of an abandoned mine dug in Upper Carboniferous strata, it is deemed a different type of ‘geothermal reservoir’, which will not be discussed in this article as a play.
In 2007, greenhouse entrepreneur Rik van den Bosch successfully realised a geothermal system, a doublet in the Upper Jurassic – Lower Cretaceous sandstones. This project, a prime example of the heat source transition from gas to geothermal, encouraged a group of greenhouse owners to pioneer the replacement of gas with geothermal as the energy source for their heat demand. The main strategy was to be independent of the, at that time, high and volatile gas price. More recently, the increasingly prominent role of CO2 reduction ambitions for addressing the Paris climate goals (UN, 2015) has provided another reason for the change to geothermal energy. To date (1 January 2019), 18 geothermal systems are in production; another 4 are realised and waiting to be commissioned, while two have been temporarily closed in. Fig. 1 shows the steadily increasing yearly production and the number of operational geothermal systems from the start in 2008 to the status date (1 January 2019) (MEA, 2018). As can be seen in Table 1 and Fig. 4c (further below), only one geothermal system, Den Haag-GT, was designed to deliver heat to a district heating project. The system was drilled and tested successfully in the middle of a densely populated and built-up area (Haagseaardwarmte, 2019), proving to be a valid heat supply. Because of the crisis in the housing market, the demand side of the project did not materialise, and the project was temporarily jeopardised.

Fig. 1. Yearly heat production in PJ a−1 and number of operating geothermal systems. (Source: MEA, 2018.)
The development of geothermal resource potential is also reflected in the licensing. On 1 January 2019, 51 geothermal exploration and 12 production licences were in place (Figs 2 and 3). For nine exploration licences, a production licence was applied for, and there were 31 applications for an exploration licence. Fig. 2 shows a steep rise in exploration licences from 2009 up to 2013 and then a slight decline and subsequent stabilisation at some 60 licences. In general, an exploration licence has a duration of four to five years. The decline in 2013 is partly explained by the release of expired licences. The number of exploration licences applied for in 2019 proves the appetite for developing geothermal in the foreseeable future.

Fig. 2. Geothermal licence position since 2004 in the Netherlands. For 2018 the number of licence applications is also presented. (Source: MEA, 2018.)

Fig. 3. Geothermal licence map with the location of the realised geothermal systems, the 3D seismic coverage and the presence of hydrocarbon fields and hydrocarbon exploration and production licences.

Fig. 4. Fingerprint of the realised Dutch geothermal systems: (A) stratigraphy of the productive interval, (B) depth to mid-aquifer, (C) uses of the heat produced (MEA, 2018).
As a consequence of over 60 years of hydrocarbon exploration and production, a wealth of subsurface data is available, including good seismic coverage and imaging of the subsurface to c.4 km depth. About half of the onshore area is covered with 3D-seismic surveys (Fig. 3) next to a large volume of 2D-seismic. Thousands of boreholes have penetrated the deep subsurface of the Netherlands, in which generally adequate data acquisition was done. All this data is in the public domain (www.nlog.nl, 2019a–e) and forms the basis for detailed reservoir quality evaluation, showing, for example, that the essential parameters in the evaluation of geothermal siliciclastic reservoirs, porosity and permeability, are strongly correlated with reservoir facies, depth and diagenesis (Van Kempen et al., Reference Van Kempen, Mijnlieff, van der Molen, Kilhams, Kukla, Mazur, McKie, Mijnlieff and van Ojik2018).
The seismic and borehole data is also used in regional subsurface mapping projects, such as the Digital Geological Model of the Dutch deep subsurface (DGM-deep v4.0, 2019). The Dutch geothermal resource toolkit ThermoGis-v2.1 (ThermoGis, 2019; Vrijlandt et al., Reference Vrijlandt, Struijk, Brunner, Veldkamp, Witmans, Maljers and van Wees2019) draws on these mapping results and calculates, amongst others, Heat In Place (HIP), geothermal power potential and resource potential given certain technical and economic cut-offs. As such, ThermoGis-v2.1 provides insight into the resource potential of the geothermal plays in the Dutch subsurface (Mijnlieff et al., Reference Mijnlieff, van Kempen, Tolsma, de Vries, Martins, Veldkamp, Struijk, Vrijlandt and van Wees2019).
As well as data availability, secured due to Dutch mining law policy, geothermal development has benefited from timely, fit-for-purpose, financial and risk mitigation schemes (Mijnlieff et al., Reference Mijnlieff, Ramsak, Lako, Groen, Smeets and Veldkamp2013). First geothermal projects could apply for Market introduction Energy Innovation (MEI) subsidy, an investment grant for energy innovation projects. Thereafter, in 2010 the Dutch geothermal exploration risk mitigation scheme was launched. It serves as an insurance on geological exploration risks of a geothermal project (RVO, 2019). In 2013, geothermal energy production was introduced in the Stimulation of Sustainable Energy Production scheme (SDE+), the Dutch feed-in premium scheme for renewable energy.
When the hydrocarbon licence map together with the maps showing 3D-seismic surveys and deep boreholes are overlain with the geothermal licence map (Fig. 3), it is apparent that the main geothermal activity has been concentrated in the high-data-density areas where the hydrocarbon industry has successfully explored for oil and gas. At present the SCAN project is an initiative to acquire 2D-seismic data specifically targeted for geothermal applications in low-data-density areas (EBN & TNO-AGE, 2018). The purpose is to reduce uncertainties in the subsurface reservoir characterisation, and consequently reduce the exploration risk, by data acquisition and as such stimulate geothermal development in those areas.
Target reservoirs of Dutch geothermal systems are the same as those for hydrocarbon exploration and production: porous and permeable sandstones and carbonates. Cenozoic, Upper Jurassic – Lower Cretaceous, Triassic, Rotliegend and even Lower Carboniferous reservoirs have proven to be prolific geothermal reservoirs (Fig. 4a) (MEA, 2018). Target depths of the production wells are between 500 and 3000 m (Fig. 4b). Combining the data in this graph with the average geothermal gradient of 31°C (Bonté et al., Reference Bonté, van Wees and Verweij2012), it can be concluded that production temperatures range from 25 to c. 100°C. From the production data delivered to date, it can be concluded that the average monthly flow in the primary loop is in the order of 200 m3 h−1 within a wide range of 50 to up to almost 400 m3 h−1 including both seasonal variations and differences between systems (www.nlog.nl, 2019a). The operating hours of these systems were almost year-round, as much as 8670 h a−1. When converting operating hours to full load hours the Dutch systems showed a full load hour range from 3800 to 6500 hours (Groen et al., Reference Groen, De Vries, Mijnlieff and Smekens2019).
Definitions and general play types
When discussing issues pertaining to the geothermal sector, it is essential to use a common language. Generally accepted definitions are an integral part of the common language. As the geothermal sector is relatively young and immature, there is still quite a large set of ill-defined jargon. Breede et al. (Reference Breede, Dzebisashvili and Falcone2015) illustrate the various geothermal play classification schemes. For basic definitions of geothermal resources the author adheres to the definitions presented in UNECE (2016). The Appendix to this article gives a selection of these definitions. In the SDE documentation (Groen et al., Reference Groen, De Vries, Mijnlieff and Smekens2019) an additional set of definitions is presented.
To describe the reservoir geology for geothermal application and reporting on the geothermal potential, the established method of describing it as a play is most efficient. In the hydrocarbon exploration, a play is defined as a unique combination of the occurrence of a reservoir, seal and source rock. In geothermal the presence and quality of the reservoir is of prime importance. Seal, or aquitard in hydrogeological terms, in the Dutch situation follows as a second important factor. The presence of a source rock, and subsequently the generation and possibly the trapping of hydrocarbons, is considered as a risk instead of one of the key play elements. As the reservoir is the prime important element in the description of a geothermal play, the stratigraphic name of the reservoir interval is used to name the play.
The purpose of classifying geothermal projects using geothermal plays is that it facilitates comparison of geothermal systems with common denominators. This is helpful for creating a reference framework for, for example, the most efficient exploration and production strategy or the evaluation of the seismic hazard of geothermal systems. To reach an efficient and unambiguous description of the geothermal play and geothermal potential of the Netherlands, it is important to elaborate on the terminology and definitions used in this paper.
Definitions
The geothermal system is the link between the geothermal source, the amount of heat in the ground, and the geothermal resource, the amount of heat which can be delivered to the user. In the Dutch context, most geothermal systems to date are doublets (Table 1). A doublet consists of a production and injection well, both completed in the same reservoir (the geothermal source) at a subsurface distance of up to 1.5 km (Fig. 5). At surface the two wells are linked via a heat exchanger, which captures the heat, the geothermal product, from the primary, salt-water loop and transfers it to the secondary, freshwater loop. The energy, heat produced in the future transferred at the heat exchanger, is defined as the geothermal resource of a doublet. If a third well, either a production or an injection well, is added to the system, it is called a triplet. Such systems ensure that the produced and then re-injected water remains in a closed loop and that no subsurface pressure depletion due to extraction of fluids occurs. A geothermal project comprises one or more geothermal systems.

Fig. 5. Schematic of a doublet geothermal system (from Mijnlieff et al. Reference Mijnlieff, Obdam, van Wees, Pluymaekers and Veldkamp2014). 1 and 11. the aquifer and geothermal source; 2. mid-aquifer in the production well; 3. inlet production pump; 4. outlet production pump; 5. top production well; 6. inlet heat exchanger; 7. outlet heat exchanger; 8. inlet injection pump; 9. outlet injection pump; 10. mid-aquifer in the injection well. Abbreviations: H, thickness; k, permeability; N/G, net to gross.
As both the source and the resource relate to quantities of energy (heat), they are typically reported in joules (J) or kilowatt-hours (kWh). This is in contrast to the ‘installed’ or ‘nameplate’ capacity of a geothermal system, also called the geothermal power. Power has the dimension of a watt (W) or joule per second (J s−1) and is generally reported in terms of megawatt (MW). This equals the amount of energy which, at maximum capacity, may be transferred per unit of time.
In contrast to the hydrocarbon sector, where the definition of a gas- or oilfield is straightforward, it is difficult to define a ‘geothermal field’. According to Gehringer & Loksha (Reference Gehringer and Loksha2012), a ‘Geothermal field refers to a geographical definition, usually indicating an area of geothermal activity at the earth’s surface. In cases without surface activity this term may be used to indicate the area at the surface corresponding to the geothermal reservoir below.’ This definition is not directly applicable to the Dutch situation. As far as we know, there are no significant thermal hot spots in the Dutch subsurface. Additionally, as will be described below, the different sedimentary aquifers are laterally extensive. For the Dutch situation a different definition for a geothermal field should be considered along the lines proposed hereafter:
A geothermal field in the ‘Hot Sedimentary Aquifer play’ (definition see next subsection) is defined as a distinct (mappable) subsurface area where a porous and permeable aquifer is present bounded at top and base by an impermeable interval (seal/aquitard) and is laterally bounded by impermeable zones like aquifer pinch-outs or faults with adequate offset. Essentially, it would be a subsurface domain in which there is sufficient pressure communication and if exploited with multiple geothermal systems these systems would interfere with each other in a positive or negative manner.
Geothermal play classification
All Dutch geothermal systems have sedimentary rocks as reservoir. In all but two, the flow relies on adequate matrix permeability and reservoir thickness. In the two exceptions a significant part of the flow is thought to be through fault and fracture permeability within the sedimentary rock.
Geothermal play definition is not straightforward as many fit-for-purpose systems or classifications are used worldwide (Breede et al., Reference Breede, Dzebisashvili and Falcone2015). Using five of these play classification systems, the Dutch geothermal systems can be classified as follows.
Firstly, classification based on a combination of geological reservoir characteristics and exploitation strategy distinguishes between play classes: hydrothermal and petrothermal systems (Moeck, Reference Moeck2014). Hydrothermal systems rely on a porous and permeable reservoir, either matrix or fracture or fault permeability, from which hot water can be produced. In contrast, petrothermal systems are characterised by a low permeable rock which needs to be artificially stimulated (fracked and/or acidised) to be able to produce or circulate water. Presently, all Dutch geothermal systems can be classified as ‘hydrothermal’ (Fig. 6).

Fig. 6. Sketch of the Dutch geothermal plays: (1) the deep, Hot Sedimentary Aquifer, hydrothermal, conductive, low-enthalpy/temperature play relying on matrix permeability; (2) the deep, Hot Sedimentary Aquifer, hydrothermal, conductive, low-enthalpy/temperature play relying on fault and fracture permeability; and (3) presently ‘not explored for’ or realised, the Enhanced Geothermal System (EGS) in non-porous, non-permeable rocks. The average geothermal gradient is in the order of 31°C km−1, with local deviations both at different locations as well as in the depth domain. Matrix porosity decreases with depth, with below 3.5–4 km depth generally below 5% with consequently very to extremely low permeability values.
Secondly, from a rock type perspective, the Dutch geothermal plays can be grouped within the ‘Hot Sedimentary Aquifer’ (HSA) (Huddlestone-Holmes, Reference Huddlestone-Holmes2014; Breede et al., Reference Breede, Dzebisashvili and Falcone2015) play which may be defined as a porous and permeable sedimentary rock (either matrix or fracture or fault permeability) containing water at elevated temperatures (Fig. 6); as opposed to Hot Dry Rock or Hot Wet Rock which as play type comprises tight rock generally of plutonic or metamorphic origin.
In both the hydrothermal and HSA, play permeability can be matrix, karst, fracture or fault permeability. For exploration and development strategy as well as for seismic risk evaluation it would be very beneficial to integrate the nature of the dominant permeability type into the play classification systematics.
Thirdly, the dominant heat transport mechanism in the Netherlands is supposed to be conduction of heat to surface, resulting in the above-mentioned thermal gradient. Therefore, the Dutch ‘Hot Sedimentary Aquifers’/hydrothermal geothermal systems can be classified within the ‘conductive play’ (CD) (Moeck, Reference Moeck2014). More specifically they may be classified as the conductive intra-cratonic basin geothermal play (CD1). This is crudely described as: ‘… (CD1) incorporates a reservoir within a sedimentary sequence laid down in an extensional graben or sag basin’ (Harvey et al., Reference Harvey, Beardsmore, Moeck and Reuter2016).
Fourthly, temperature-wise the Dutch geothermal plays are classified in the ‘low temperature’ or ‘low enthalpy’ class as summarised by Dickson & Fanelli (Reference Dickson, Fanelli, Dickson and Fanelli1990). The average geothermal gradient in the Netherlands is 31°C km−1 with an average surface temperature of 10°C (Bonté et al., Reference Bonté, van Wees and Verweij2012). Yet no significant local hot spots or temperature anomalies are recognised. However, at some locations the geothermal gradient deviates from the generally relatively straight geothermal gradient and shows a combination of gentler and steeper slopes with depth (Fig. 6). The current producing systems and exploration projects predominantly target the sedimentary aquifers from a depth of 500 m to 3000 m (Fig. 4b), resulting in production water temperatures to c.100°C. All geothermal systems produce water in the liquid phase; no steam production is realised yet.
Lastly, depending on the definition, depth-wise most Dutch geothermal plays would be classified as ‘deep geothermal’ (deep >400 m or >1500 m (www.ThermoGis.nl) and <4000 m).
One exception to the Dutch geothermal reservoirs being ‘deep geothermal’ is the Ultra Deep Dinantian Limestone target, an unproven geothermal play which is presently studied in the government-funded exploration programme (UDG, 2018). The target is tight but potentially fractured, faulted and possibly karstified Dinantian Carbonates at more than 4 km depth. Play-wise, it would still be classified as CD1 (Fig. 6). In case the expected karstified and fractured nature of the reservoir is not present and the rock is very tight, geothermal systems in this setting might be classified as a medium-temperature/enthalpy play with characteristics of a petrothermal or ‘hot dry rock’ play classified as Conductive-3 Basement type according to Harvey et al. (Reference Harvey, Beardsmore, Moeck and Reuter2016) or Moeck (Reference Moeck2014), requiring Enhanced Geothermal System (EGS) techniques to be developed (Fig. 6).
The current operational geothermal systems exploit reservoirs of Cenozoic, Upper Jurassic – Lower Cretaceous, Triassic, Rotliegend and Lower Carboniferous – Dinantian age (Fig. 4a). Table 2 lists the litho-chronostratigraphic intervals of the Netherlands which are explored and exploited for geothermal but also for hydrocarbons, and storage of energy carriers and energy residues. The Dutch HSA /low-enthalpy/CD1 play can be subdivided, on the basis of lithostratigraphy, into groups of aquifers with similar geological history and character.
Table 2. Listing of lithostratigraphic names used in this paper. The Dutch Hot Sedimentary Aquifer sub-plays use the period or lithostratigraphical name as their ‘play name’. A full reference of all lithostratigraphical intervals is given in Adrichem Bogaert & Kouwe (Reference Van Adrichem Boogaert and Kouwe1993). The groups, formations and members listed in this table are the ones which have or potentially have geothermal potential. The list of members is not exhaustive. (Mbr = Member, Fm = Formation, Sst = sandstone.)

One could state that geothermal plays with a producing geothermal system exploiting the geothermal reservoir are proven plays. Subsequently, it may be stated that, at least in the proven play areas where the geological architecture and history are similar, the geothermal-exploration related uncertainties are reduced to the geological reservoir uncertainties inherent to the specific reservoir.
Reservoirs with similar geology and geological history, which are not yet exploited for geothermal in subsurface domains, may be regarded as unproven geothermal plays, thus having a higher exploration risk related to higher geological uncertainties than the inherent geological reservoir risk. The unproven geothermal plays are Chalk, Zechstein, Upper Carboniferous and very deep Lower Carboniferous and possibly Devonian (UDG, 2018).
Depending on the type of play, a set of geophysical exploration techniques are most adequate (Harvey et al., Reference Harvey, Beardsmore, Moeck and Reuter2016). For the Dutch geothermal plays, whether they are classified as low-enthalpy, deep, Hot Sedimentary Aquifer or Conductive play-1, reflection seismic is the preferred geophysical technique. Regardless of the play type and the relative abundance of data, an exploration well is necessary to prove the geothermal source to be present and secondly to prove the source can be exploited by circulating water through the subsurface and geothermal installation.
The presence and quality of the geothermal reservoir are key. The essential reservoir parameters are: permeability, net thickness, porosity and depth. Presently, as a general rule of thumb, a transmissivity in the order of 10–15 Dm is the minimum threshold for a successful geothermal system. ThermoGis-v2.1 provides regional transmissivity maps which give a good indication for potential flow.
Additionally, a suite of other geologic parameters needs to be known to estimate the potential power or capacity of an envisaged geothermal system, such as: formation water salinity, geothermal gradient and reservoir anisotropy (see e.g. DoubletCalc, 2014; Mijnlieff et al., Reference Mijnlieff, Obdam, van Wees, Pluymaekers and Veldkamp2014).
The geology of the Dutch geothermal (sub-)plays
The bibliography of the Dutch reservoir sequences is extensive. An almost exhaustive listing is given via the nlog.nl webpage (www.nlog.nl, 2019b). The regional maps of the Dutch Geological Survey are the main source of information for the regional play description. These mapping products are subsequently integrated in ThermoGis-v2.1 (www.thermogis.nl), the tool for evaluating geothermal potential based on regional to sub-regional geological maps. Additionally, the book Geology of the Netherlands (Wong et al., Reference Wong, Batjes and De Jager2007) provides an elaborate geological description and review per period. The reservoirs in the Dutch subsurface are referred to by their lithostratigraphic annotation or name. Therefore, the Dutch lithostratigraphic nomenclature by Van Adrichem Boogaert & Kouwe (Reference Van Adrichem Boogaert and Kouwe1993–1997) is a key reference. Specific recent developments in geological knowledge are published in the conference paper collection Mesozoic resource potential in the Southern Permian Basin (Kilhams et al., Reference Kilhams, Kukla, Mazur, McKie, Mijnlieff and Van Ojik2018) and The Permian Rotliegend of the Netherlands (Gaupp & Grötsch, Reference Gaupp and Grötsch2011).
The structural development in the different geologic periods is well described by De Jager (Reference De Jager, Wong, Batjes and de Jager2007). It shows the structural element map of the Late Jurassic – Early Cretaceous (see also TNO, 2011). It should be noted that the sub-basin configurations of Late Carboniferous, Permian, Triassic to Early Jurassic and the late Cretaceous and Cenozoic are different. Consequently, the sediment distribution patterns of these periods are also different. The Geological atlas of the subsurface of the Netherlands – onshore (NITG-TNO, 2004) provides broad regional structural element maps for the different geological periods. A broader northwest European context is given in the Petroleum geological atlas of the Southern Permian Basin Area (Doornenbal & Stevenson, Reference Doornenbal and Stevenson2010) and its update by Doornenbal et al. (Reference Doornenbal, Kombrink, Bouroullec, Dalman, De Bruin, Geel, Houben, Jaarsma, Juez-Larré, Kortekaas, Mijnlieff, Nelskamp, Pharaoh, ten Veen, Ter Borgh, Van Ojik, Verreussel, Verweij, Vis, Patruno, Archer, Chiarella, Howell, Jackson and Kombrink2019).
Cenozoic play
The whole of the Netherlands, apart from two small areas (Limburg and Twente), has a Cenozoic cover. Lithostratigraphically, Cenozoic reservoirs are part of the North Sea Super Group (Van Adrichem Boogaert & Kouwe, Reference Van Adrichem Boogaert and Kouwe1993–1997). Even though all oil and gas wells drilled through this section, detailed reservoir knowledge in terms of productivity and injectivity is limited because data acquisition (logging and testing) in the North Sea Super Group was left to a bare minimum. Nonetheless, a permeability thickness (kH) or transmissivity map is compiled which has a significant degree of uncertainty (Fig. 7a). There appear a northern and a southern domain of relatively high transmissivity most likely related to the proximity of the shoreline and the input locations of the sandy sediment. The top of the Middle North Sea Group varies from surface to 1800 m in the Roer Valley Graben (www.nlog.nl, 2019c). The base of the Palaeogene section, base North Sea Super Group, varies from ground surface (Southern Limburg) down to just over 1800 m (www.nlog.nl, 2019d). The thickness distribution of the combined Lower and Middle North Sea Groups shows two thick domains separated by a NW–SE-oriented low-thickness zone running from Haarlem to Nijmegen. This thickness distribution is largely a function of erosional events at times before base Middle and subsequently base Upper North Sea Group sediment deposition. The temperature is expected to range from 10°C (close to surface) to generally 40–45°C (Fig. 7b).

Fig. 7. Cenozoic geothermal play maps. (A) The transmissivity map of the Middle and Lower North Sea Group reservoirs. (B) The average temperature of the combined Middle and Lower North Sea Group reservoirs. Note the relatively low temperatures because of low burial depth. (Source: ThermoGis-v2.1, last accessed 23 February 2019.)
In the play description, only the geothermal reservoirs of the Cenozoic comprising the Middle and Lower North Sea Groups (Van Adrichem Boogaert & Kouwe, Reference Van Adrichem Boogaert and Kouwe1993) are taken into account. ThermoGis-v2.1 lists the lithostratigraphic units with potential reservoirs, of which the Brussels Sand Member provides the best potential as its thickness, expected permeability and burial depth are most favourable compared to the other Cenozoic reservoir intervals. The sediments of the Lower and Middle North Sea Groups are marine sediments deposited at the southern edge of a large inland marine basin (Knox et al., Reference Knox, Bosch, Rasmussen, Heilmann-Clausen, Hiss, De Lugt, Kasińksi, King, Köthe, Słodkowska, Standke, Vandenberghe, Doornenbal and Stevenson2010). All these reservoirs are siliciclastic, comprising predominantly sandstones with varying clay content and of different grain size. The best reservoir facies are expected to be (very) shallow marine shoreface to beach facies.
Although reservoir delineation and characterisation are poorly defined over the largest part of the Netherlands onshore, its geothermal and (seasonal) heat buffer potential is thought to be present.
Based on the mapped depth of the reservoirs and the scarcely available reservoir data, ThermoGis-v2.1 gives an estimated Heat in Place (HIP) of 234,558 PJ in the combined Cenozoic reservoirs. To date, one geothermal doublet, Zevenbergen, is installed in the Brussels Sand Member. It is in the process of being commissioned (status date 1 January 2019).
Upper Jurassic–Lower Cretaceous play
Overall the Upper Jurassic and Lower Cretaceous sedimentary sequence can be regarded as part of a large-scale step-wise onlap sequence from the Central Graben in the north (Offshore Netherlands) to the London–Brabant Massif in the south, progressively drowning the formerly uplifted landmass during the Middle Jurassic doming (Graversen, Reference Graversen2005; Jeremiah et al., Reference Jeremiah, Duxbury and Rawson2010). Facies distribution and stacking of first the predominantly terrestrial Schieland and Niedersachsen Group sediments and secondly the marine Scruff and Rijnland Group sediments follow similar patterns in the subsequent basin fills from north to south: starting with floodplain claystones, coals and fluvial sandstones; followed by lagoonal claystones, marginal marine sandstones; shallow marine sandstones and finally deep marine claystones (Fig. 8; Table 2). In the Dutch onshore areas, four Lower Jurassic – Upper Cretaceous basins are present which were filled in the last stages of the overall transgression: Vlieland Basin (VLB), Lower Saxony Basin (LSB), Central Netherlands Basin (CNB) and the West Netherlands Basin (WNB) (Fig. 9) (NITG-TNO 2004).

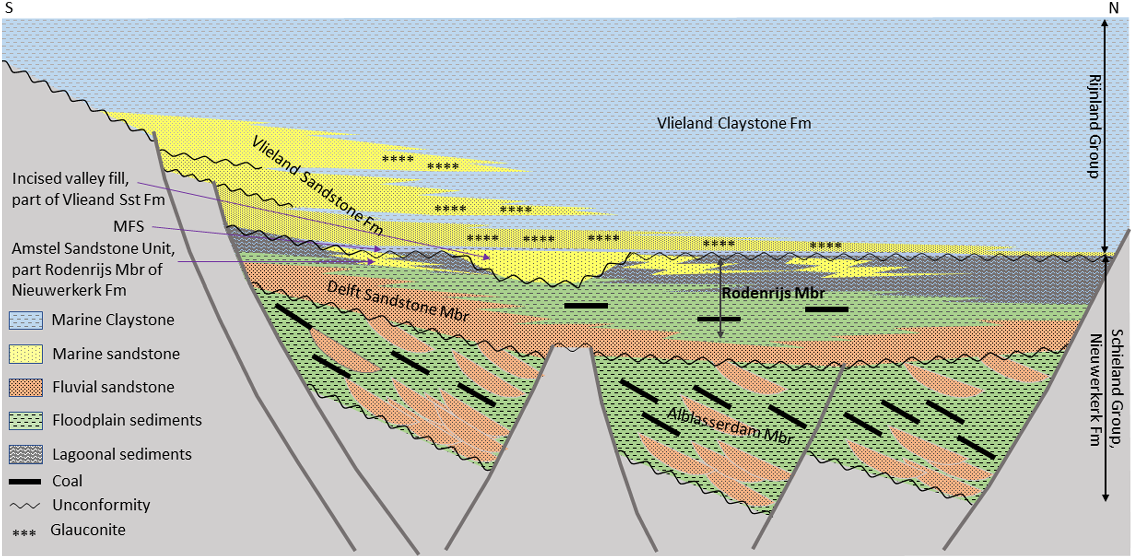
Fig. 8. Facies relations of the formations and members from the Rijnland and Schieland Group. This example relates to the West Netherlands Basin. Similar facies architecture and thus lithostratigraphic unit relations are seen in the other Dutch Upper Jurassic – Lower Cretaceous basins.

Fig. 9. Lower Cretaceous, Vlieland Sandstone geothermal play maps. (A) The transmissivity map of the Rijnland Group, Vlieland Sandstone Fm reservoirs. (B) The average temperature of the combined Vlieland Sandstone Fm reservoirs. (Source: ThermoGis-v2.1, last accessed on 23 February 2019.) Structural elements abbreviations: VLB, Vlieland Basin; TYH, Texel–Ysselmeer High; LSB, Lower Saxony Basin; CNB, Central Netherlands Basin; WNB, West Netherlands Basin; RVG, Roer Valley Graben. For the detailed structural elements map see TNO (2011).
At first, the Vlieland Sandstone Formation of the Rijnland Group was the primary geothermal target, and the Schieland Group secondary. It was the logical choice as the Vlieland Sandstone was explored more intensely by the oil and gas industry, yielding abundant data and knowledge, and showed favourable reservoir characteristics. Because heat is the commodity in geothermal exploration, the target locations of geothermal production wells are the structural low points (the grabens), in contrast to the traditional hydrocarbon target locations, the structural high points. It turned out that the Schieland Group sandstones found in the lows were thicker than expected and showed higher permeability than the pre-drill expectation (Willems, Reference Willems2017; Vondrak et al., Reference Vondrak, Donselaar, Munsterman, Kilhams, Kukla, Mazur, McKie, Mijnlieff and Van Ojik2018). The geothermal wells have largely proven the geological model by Den Hartog Jager (Reference Den Hartog Jager, Rondeel, Batjes and Nieuwenhuijs1996), who suggested that the graben settings were sand-prone and thicker than the horst locations. Presently, the Schieland Group sandstones, and specifically the Delft Sandstone Member, are the primary target in the WNB. They are a more prolific reservoir and are buried deeper, and are thus hotter, than the overlying Vlieland Sandstone Formation reservoirs.
Lower Cretaceous play
The reservoirs of Lower Cretaceous play are nested in the Rijnland Group. The Vlieland Sandstone Formation comprises the prime reservoirs, as with hydrocarbon exploration and production. The Vlieland Sandstone Formation is divided into various members or reservoir intervals. The overall configuration is a stepped transgression, as a result of the combined effects of tectonics and sea level rise (Bouroullec et al., Reference Bouroullec, Verreussel, Geel, De Bruin, Zijp, Kőrösi, Munsterman, Janssen, Kerstholt-Boegehold, Kilhams, Kukla, Mazur, McKie, Mijnlieff and Van Ojik2018; Verreussel et al., Reference Verreussel, Bouroullec, Munsterman, Dybkjær, Geel, Houben, Johannessen, Kerstholt-Boegehold, Kilhams, Kukla, Mazur, McKie, Mijnlieff and Van Ojik2018). The Vlieland Sandstone sediments may be genetically configured as an onlapping basal sand, an incised valley fill, with a clay-rich maximum flooding interval on top which subsequently builds out seaward thick packages of prograding marine sandstones. The onlap and stacking architecture, the preservation as well as the sediment character are dependent on the basin configuration, e.g. topographic relief, steepness of slopes, accommodation space and sediment supply (Fig. 8). Depending on the location of the basin fringe topography, either all or just one of the genetic units is deposited or preserved. The type or facies and thus reservoir quality varies a lot. The Vlieland Sandstone sediments are of excellent reservoir quality when deposited in a very shallow marine setting like the sediments of the IJsselmonde, Berkel and Rijswijk Sandstone Mbr in the WNB and the Bentheim Sandstone in the Lower Saxony Basin. In the northern part of the Netherlands the Vlieland Sandstone comprises predominantly thoroughly bioturbated glauconitic lower shoreface to upper offshore sandstones with poor permeability. This is expressed in the transmissivity map (Fig. 9a).
As can be seen from Fig. 9, the Vlieland Sandstone reservoir is only present in parts of the Netherlands. The main cause of the absence is the erosional events related to the Alpine tectonic events, of which the base North Sea Super Group unconformity has the largest impact on the preservation of the Vlieland Sandstone reservoir. One could roughly state that the Rijnland Group sediments and presumably Vlieland Sandstone sediments were deposited over almost all of the Netherlands apart from the southern part (NITG-TNO, 2004). Some of the smaller occurrences of presumed Vlieland Sandstone distribution have not been drilled yet.
Transmissivity exceeds the lower threshold for geothermal application on the fringes of the different sub-basins (Fig. 9a). When the depositional area was deeper marine, lower shoreface to offshore settings, the clay content of the sediment is much higher. Additionally, these deeper marine sediments tend to be enriched in glauconite, like most of the Friesland Sandstone Mbr sediments in the Vlieland basin and the different ‘Vlieland Sandstone Formation’ Members in the northern part of the WNB. Both clay and glauconite have a detrimental effect on the permeability, resulting in low transmissivity, making these reservoirs unfit for geothermal applications. The depth of the Vlieland Sandstone reservoirs is found, apart from a small area in eastern Netherlands, between 1500 and 3000 m, resulting in formation water temperatures between 40 and 100°C (Fig. 9b). The combination of these two key parameters, transmissivity and temperature, is best developed in the WNB and the LSB. Looking at the present development in the WNB, the Vlieland Sandstone reservoirs as a stand-alone target appear to be suboptimal compared to the prolific underlying Delft Sandstone reservoir. Based on the mapped Lower Cretaceous reservoirs and the available reservoir data, ThermoGis-v2.1 gives an estimated HIP of 61.012 PJ of source potential. Three geothermal systems have the Vlieland Sandstones as part of their productive interval.
Upper Jurassic play
The Schieland Group is aerially differentiated into the Delfland Subgroup and the Central Graben Subgroup, whereas it has its lateral equivalent in the Niedersachsen Group located in the Lower Saxony Basin realm (Van Adrichem Boogaert & Kouwe, Reference Van Adrichem Boogaert and Kouwe1993–1997).
The distribution of the Upper Jurassic Schieland Group sediments is dependent on primary depositional distribution and secondly erosional truncation of the sequence. As a rule of thumb, the Schieland Group sediments are only present in a limited number of areas, which coincide with Late Jurassic depositional basins. These basins can be regarded as rift (half) grabens (WNB, CNB) and extensional basins (LSB and VLB). As such, the Schieland Group sediments can be regarded as syn-rift sediments, whereas the overlying Rijnland Group sediments are the post-rift sequence. The base Cretaceous unconformity is picked in between the Schieland and Rijnland Groups. It locally cuts down into the Schieland Group sequence to various depths. Five domains of preserved Schieland and Niedersachsen Group sediments are present in the Dutch subsurface: WNB, Central Netherlands, Vlieland Basin, North Eastern Netherlands and eastern Netherlands, the latter two being part of the Lower Saxony Basin (www.nlog.nl, 2019e). The WNB is the most prolific in terms of geothermal potential (Fig. 10).

Fig. 10. Upper Jurassic, Nieuwerkerk Formation geothermal play maps. (A) The transmissivity map of the Nieuwerkerk Fm reservoirs. (B) The average temperature of the Nieuwerkerk Fm reservoirs. (Source: ThermoGis-v2.1, last accessed on 23 February 2019.) For structural elements abbreviations see Fig. 9. Note the Nieuwerkerk Fm is only present in the geological province West Netherlands Basin.
In the WNB the sediments of the Schieland Group predominantly comprise sandstone, claystone and coal. Depending on the relative abundance of sandstone and on the nature of the claystone, the Nieuwerkerk Formation of the Schieland Group in the WNB is divided into three members (Table 2; Fig. 8) (Van Adrichem Boogaert & Kouwe, Reference Van Adrichem Boogaert and Kouwe1993). The depositional environments of the lower two members, Alblasserdam and Delft Sandstone Members, are interpreted to be a lower delta plain with floodplains, marches, lakes and rivers (Den Hartog Jager, Reference Den Hartog Jager, Rondeel, Batjes and Nieuwenhuijs1996; Jeremiah, 2010). The third and upper, Rodenrijs Claystone Member represents the transition from lower delta plain to restricted marine/lagoonal clay facies and locally marginal marine sandstone facies.
The primary target of most geothermal projects is the Delft Sandstone Member, and the secondary target is the stacked sandstone sequences in the Alblasserdam Member (see Willems et al., Reference Willems, Vondrak, Mijnlieff, Donselaar and Van Kempen2019, this volume). The Delft Sandstone Member consists of stacked channel sandstone beds displaying high net-to-gross values, which are replaced upward by progressively more claystones ultimately assigned to the Rodenrijs Claystone Member: first, claystones of terrestrial origin, but progressively more of transitional to lagoonal nature. Locally, towards the top of the Rodenrijs Claystone Member, more sandstone beds are intercalated as seen in the offshore block Q13, informally called the Amstel Sandstone Unit, which laterally extends to the onshore. These sandstones are of marginal marine origin and have been interpreted as wash-over sands and/or barrier sands. The thickness of the Schieland Group is laterally highly variable, often in a half graben fill configuration. Within the Schieland Group, locally intraformational angular unconformities are interpreted on seismic supporting the syn-rift deposition, with the different fault blocks moving and tilting at different speeds and in different directions. The most prominent one appears to be at the base of the Delft Sandstone Member (Fig. 8).
The Delft Sandstone Mbr channel sandstone sediments have excellent permeability. Together with the stacked nature of some of these channel intervals, transmissivity values (Fig. 10a) and the structural graben setting, this play is very favourable for geothermal development (Willems et al., Reference Willems, Vondrak, Mijnlieff, Donselaar and Van Kempen2019, this volume).
Based on the mapped Upper Jurassic reservoirs and the available reservoir data, ThermoGis-v2.1 gives an estimated HIP of 74,841 PJ of source potential. The geothermal source potential is currently only estimated for the WNB. The other domains of preserved Schieland or Niedersachsen Group sediments have not been the target for geothermal exploration yet, because the potential reservoir sequences are seen to have unfavourable quality in terms of transmissivity and connectivity.
To date (22 February 2019), nine geothermal doublets are installed in this play. They are all situated in the proven petroleum geological province the ‘West Netherlands Basin’. Therefore, the Nieuwerkerk Fm sediments can be a reservoir or part of the migration path. All these geothermal systems deal with solution gas. Traces of oil are present, and even oil accumulations may be found in the ‘dead ends’ of the labyrinth type reservoirs of the Schieland Group. Oil was produced from one geothermal system, and all geothermal systems produce solution gas (MEA, 2018) with a gas/water ratio of c.1 m3 m−3.
Triassic play
Currently, the Lower Germanic Trias Group, especially the Main Buntsandstein Subgroup, is seen as the only Triassic interval containing potential geothermal reservoirs. The presence of the Main Buntsandstein reservoirs in the onshore Netherlands is largely the result of erosional truncation either by the Hardegsen/base Solling unconformity (Geluk Reference Geluk2005, his fig. 2.6, p. 45) or the base Cretaceous Unconformity (NITG-TNO, 2004, pp. 53 and 61) and/or the base North Sea Super Group Unconformity (NITG-TNO, 2004, p. 75). A comprehensive overview of the Triassic geology is given in Geluk (Reference Geluk2005).
The various sandstone members of the Main Buntsandstein Subgroup, which are the target in hydrocarbon exploration and production, are also of interest for geothermal development (Table 2). In the south of the Netherlands the different members of the Main Buntsandstein Subgroup are stacked into one sandstone interval reaching over 200 m thickness in the Roer Valley Graben (RVG). Towards the north this stacked sandstone splits into the well-known Triassic Lower Volpriehausen Sandstone, Lower Detfurth Sandstone and the Hardegsen Sandstone, while the intermediate Upper Volpriehausen and the Upper Detfurth Sandstone are shaling out northward away from the basin fringe into the Volpriehausen Clay–Siltstone and Detfurth Claystone Members (Van Adrichem Boogaert & Kouwe, Reference Van Adrichem Boogaert and Kouwe1993). The sandstone of the Basal Solling Sandstone Member unconformably overlies the Main Buntsandstein sediments, potentially adding to the net reservoir thickness but at the same time, due to the erosional character of the basal contact, potentially reducing the thickness of the underlying reservoir sequence. In the Roer Valley Graben, a thick sandstone interval is present at the base of the Triassic Lower Buntsandstein, the Nederweert Sandstone (Geluk, Reference Geluk, Plomp, van Doorn, Rondeel, Batjes and Nieuwenhuijs1996). It appears an interesting geothermal target, yet more research and exploration has to be done to de-risk, primarily, the reservoir quality. On the southern fringe of the Triassic basin, a number of clay-rich and evaporitic intervals of the Rot Formation have a lateral equivalent in a sandstone facies: the Röt Fringe Sandstone Member. These Röt and Lower Buntsandstein sandstones might add to the overall Triassic reservoir thickness and geothermal potential.
The Triassic sandstones are invariably terrestrial sediments deposited in a very low-relief, major inland basin of similar dimensions to the Southern Permian Basin (Geluk, Reference Geluk2005). They are sourced from the south to southeast from the sediment-shedding Variscan orogenic terrain. The sandstones are composed of different percentages of water- and wind-lain sediments, the former varying from conglomeratic to coarse- to medium-grained braided channel deposits, with confined and unconfined sheet floods to fine-grained distal sheet flood deposits in the more distal clay-flat area. The latter, the sandy aeolian sediments, are either dune or sandflat deposits. Reservoir quality, porosity and permeability, is primarily related to the facies and depositional mechanism/environment of the sediment. Next to the dependence of the reservoir quality on depositional facies, the reservoir quality is subsequently significantly modified due to secondary, diagenetic processes like compaction, cementation and dissolution. After early cementation of the sediment in the desert environment by e.g. gypsum and carbonate, it is well known that with burial depth, compaction increases and the porosity of the buried rock decreases. The precise porosity–depth decline curve varies per lithology type (Van Kempen et al., Reference Van Kempen, Mijnlieff, van der Molen, Kilhams, Kukla, Mazur, McKie, Mijnlieff and van Ojik2018). Including maximum burial (Japsen, Reference Japsen2000; W. Van Dalfsen et al., unpublished information, 2005) in the reservoir-quality evaluation is essential. With burial, the pressure and temperature of the formation water increases. Minerals will either precipitate from the formation fluid and clog the pores as ‘cement’ and/or some cements and detrital grains will become unstable under the elevated temperature and dissolve. Additionally, in the general area of the Triassic sub-crop beneath the base Cretaceous unconformity, cement and grains of the Main Buntsandstein reservoirs were leached, enhancing the porosity and permeability. The good Triassic reservoir quality encountered in the well Hellevoetsluis-1 (HVS-1) can be attributed to leaching by meteoric water influx at the base Cretaceous unconformity. The wells of the nearby Vierpolders geothermal project (BRI-GT-1&2) are progressively further away from the truncation area of the Main BuntSandstein and, as such, the difference in reservoir quality between the two Vierpolders geothermal wells themselves and the Hellevoetsluis-1 well can be explained as a result of the decreasing effect of the leaching agent and process away from the truncation area.
The transmissivity of the Triassic reservoirs is generally low, smaller than 2 Dm (Fig. 11a) (ThermoGis-v2.1, 2018), due to very low permeability as a consequence of deep maximum burial, especially in the southern half of the Netherlands. In general, only on the basin fringes, especially the southern fringe, of the Main Buntsandstein distributional area is the transmissivity higher than the minimum threshold of 10 Dm. As such, the potential appears relatively low. However, more in-depth evaluation combining all available well data and seismic data and additionally alternative development strategies, such as EGS or very long horizontal drains, might unlock the Triassic potential. In the northern half of the Netherlands the transmissivity is reduced primarily because the thickness of the Main Buntsandstein reservoirs is significantly reduced as a result of the above-mentioned shaling-out.

Fig. 11. Triassic geothermal play maps. (A) The transmissivity map of the combined Triassic reservoirs. (B) The average temperature of the combined Triassic reservoirs. (Source: ThermoGis-v2.1, last accessed on 23 February 2019). For structural elements abbreviations see Fig. 9.
To date, one geothermal doublet targeting the Triassic sandstones is operational in the Netherlands: Vierpolders (BRI-GT-1&2) just south of Rotterdam. Its producing reservoir comprises the Main Buntsandstein Formations. The relatively low maximum burial depth (<3500 m) and its structural configuration, close to the truncation of the reservoir under the base Cretaceous Unconformity, favour a productive Triassic reservoir interval. The deep Triassic exploration target (c.3900 m) of the Naaldwijk-GT-1 well (ref www.nlog.nl, well NLW-GT-01), where an extremely low transmissivity was encountered, has proven that deeply buried, and originally deeply buried but later inverted, Triassic siliciclastic reservoirs are a high-risk venture.
Based on the mapped Triassic reservoirs and the available reservoir data, ThermoGis-v2.1 gives an estimated HIP of 334,930 PJ of source potential.
Rotliegend play
The Slochteren Formation of the Rotliegend Group is the main gas reservoir in the Netherlands. Roughly, north of the pinch-out line of the Zechstein salt, gas is caught in the Rotliegend Slochteren Sandstone reservoir under the excellent Zechtein seal. To the south of that line, the seal of the Rotliegend petroleum play is absent, therefore that area is not part of the Rotliegend hydrocarbon play. Nonetheless, the Slochteren Sandstone extends southward to the southern boundary of the WNB and Roer Valley Graben (RVG) and therefore can be included in the geothermal play area, and as such the geothermal Rotliegend play area covers almost the whole of the Dutch onshore.
The publication The Permian Rotliegend of the Netherlands provides a comprehensive overview of the geological knowledge of this reservoir (Gaupp & Grötsch, Reference Gaupp and Grötsch2011). The Slochteren Sandstone sediments were deposited in a desert environment including perennial lake, fluvial and alluvial domains incorporating wadis, sandflats with dune fields, mudflats and saline lakes (Fryberger et al., Reference Fryberger, Knight, Hern, Moscariello, Kabel, Grötsch and Gaupp2011). Within the Rotliegend play, two domains can be recognised:
1) a northern domain in which the Rotliegend section comprises two claystone members, the Ten Boer and Ameland Members and two sandstone members, the Upper and Lower Slochteren Members. The Ten Boer Member is the uppermost (youngest) lithostratigrapic unit effectively separating the Upper Slochteren Member from the Zechstein (Table 2). The Ameland Member separates the Upper and the Lower Slochteren Members. Where the Ameland Member pinches out to the south, a line approximately W–E from Texel to Ter Apel (Van Ojik et al., Reference Van Ojik, Mijnlieff, Nortier, Gaupp, Grötsch, Grotsch and Gaupp2011), the southern domain starts (Fig. 12a).
2) a southern domain in which the Slochteren Sandstone occurs as one single sandstone interval of up to 200 m thick. To the south and east the Slochteren Sandstone pinches out at its depositional fringe. Within this southern domain, isolated areas occur where the Slochteren Sandstone is absent. These are either non-depositional areas as a result of basin topographic highs (Mijnlieff & Geluk, Reference Mijnlieff, Geluk, Grötsch and Gaupp2011) or due to erosion below the Kimmerian and or Alpine unconformities, as e.g. on the Texel–IJsselmeer High (TYH) (NITG-TNO, 2004). Seismic and prospect evaluation proves the presence of pods/structural grabens on the TYH in which the Slochteren Sandstone was sheltered from erosion and preserved similar to the situation drilled by the Wieringerwerf-1 well (WGF-1) (NITG-TNO, 2004). In the southern one-third of the Dutch onshore, the transmissivity of the Slochteren is very poor. This is primarily due to reservoir deterioration related to deep burial like the Triassic reservoirs in that area, and partly due to relatively low gross thickness.

Fig. 12. Rotliegend geothermal play maps. (A) The transmissivity of the Rotliegend Slochteren Sandstone reservoirs. (B) The average temperature of the combined Rotliegend Slochteren reservoirs. (Source: ThermoGis-v2.1, last accessed on 23 February 2019.) For structural elements abbreviations see Fig. 9.
Eight geothermal systems have Slochteren Sandstone as reservoir (MEA, 2018). Target depths are between 1.5 and 3 km. They are all situated around the structural geological domain, the TYH. Around the TYH, aeolian sediments dominate the Slochteren Sandstone interval (Fryberger et al., Reference Fryberger, Knight, Hern, Moscariello, Kabel, Grötsch and Gaupp2011; Van Ojik et al., Reference Van Ojik, Mijnlieff, Nortier, Gaupp, Grötsch, Grotsch and Gaupp2011) thus these eight geothermal systems are thought to have predominantly aeolian origin reservoir facies. Enhanced porosity and permeability may occur close to unconformities as a result of leaching of grains and cement due to influx of meteoric water at the unconformity. The average reported permeability of the reservoir is in the order of 50–350 mD and thickness values of 100–250 m. These result in transmissivity values of up to 50 Dm (Fig. 12a), which together with the well design cater for a flow of 150–350 m3 h−1 and possible installed power of up to more than 30 MWth.
The presence and gross thickness of the Rotliegend is well mapped (DGM-v4). The assessment of the net thickness is more complex, as the presence of e.g. anhydrite cemented beds in the Koekoekspolder doublet (KKP-GT-1&2) significantly reduces the effective reservoir thickness (Henares et al., Reference Henares, Bloemsma, Donselaar, Mijnlieff, Redjosentono, Veldkamp and Weltje2014). Additionally, deep burial has a detrimental effect on the reservoir quality, as for example in the WNB where the relatively high temperatures, as shown in Fig. 12b, give an indication of the burial depth. In the northern domain the Lower Slochteren Member in the northern half of Friesland is very clay rich, resulting in low geothermal potential whereas the Upper Slochteren Member provides reasonable reservoir quality (ThermoGis-v2.1.nl).
The Slochteren reservoir is the most prolific Dutch gas reservoir. A large number of Rotliegend gas fields are distributed over the northern provinces (Breunese et al., Reference Breunese, Andersen, Brinkman, Jagosiak, Karnin, Karnkowski, Kombrink, Messner, Mijnlieff, Olsen, Peryt, Piske, Poprawa, Roelofsen, Stoker, Smith, Swann, Waksmundzka, Veldkamp, Doornenbal and Stevenson2010). Therefore, the effective exploration area for geothermal is reduced as developing geothermal systems in, and in the vicinity of, depleted gasfields, for example the giant Groningen gas field, is generally regarded as unfavourable. However, in some cases interference between geothermal and gas production activities in the direct vicinity of a gas field can be beneficial (Van der Molen et al., Reference Van der Molen, Peters, Jedari-Eyvazi and van Gessel2019, this volume). The Carboniferous gas source rock (Breunese et al., Reference Breunese, Andersen, Brinkman, Jagosiak, Karnin, Karnkowski, Kombrink, Messner, Mijnlieff, Olsen, Peryt, Piske, Poprawa, Roelofsen, Stoker, Smith, Swann, Waksmundzka, Veldkamp, Doornenbal and Stevenson2010) underlies most of the geothermal Rotliegend play area. The occurrence of gas is proven, as well as the presence of solution gas in the formation water.
Based on the mapped Rotliegend reservoirs and the available reservoir data, ThermoGis-v2.1 gives an estimated HIP of 571,021 PJ of source potential.
Lower Carboniferous geothermal play
Two geothermal systems have been realised targeting the Lower Carboniferous Dinantian Limestones. These systems, in geothermal licences Califonië IV and V, are situated in the southeast of the Netherlands (Fig. 3). As the matrix permeability is very low, these systems rely on the presence of fractured, faulted and/or karstified limestones. The Dinantian Limestones are found in a large-scale anticlinal structure, situated in a horst block bounded by two major faults, the southwestern being the Tegelen fault. Within this horst block, the top of the Dinantian is partly eroded as a result of successive erosional events of which the significant ones are the Base Permian Unconformity and unconformities at the base Cretaceous and base North Sea Supergroup (Cenozoic) (Fig. 13). The horstblock bounding faults, including the Tegelen fault, are part of the active Roer Valley Graben system providing fault permeability (Reith, Reference Reith2018). The faulted and fractured nature of the Dinantian Limestone may have provided pathways for hydrothermal fluids capable of creating fault-related karstification. Additionally, the infiltration of meteoric water into the limestone sequence caused karstification, when in the larger area the Dinantian Limestone was sub-cropping as a result of the erosional events. For both geothermal systems, the production well is in a faulted/fractured Dinantian limestone sequence in or close to the Tegelen fault. The positions of the injection locations are away from the fault, perpendicular to the fault trace, into karstified fractured and possibly faulted limestone. Production data shows that the wells are in a hydraulic connection trough, a complex permeability framework of fault, karst and fracture permeability.

Fig. 13. Sketch of the subsurface architecture of the two geothermal systems on the northern flank of the Roer Valley Graben targeting the fractured Dinantian limestones and Devonian sandstones. The sketch is modified after figures in Californië Lipzig Gielen & VITO (2013).
In general, the unique subsurface architecture seen in the southeast of the Netherlands is limited to the relatively shallow occurrences of the Dinantian Limestone bordering the London Brabant Massif, parts of the Roer Valley Graben and West Netherlands Basin system (Fig. 13). In the larger part of the Netherlands, the Dinantian Limestone sequence is buried over 4 km. This would be ideal for producing heat in excess of 120°C for application in industrial processes. In that situation, the Dinantian Limestone reservoir is covered with a thick sequence of Namurian shales which prevented subsequent post-Namurian meteoric karstification from ever occurring. The challenge is to find locations which would suit a geothermal system capable of producing from a faulted, fractured and hydrothermally karstified carbonate sequence and simultaneously capable of injecting volumes of water into these carbonates away from faults to minimise the risk of induced seismicity. An alternative challenge is to look for situations where a permeable fault, which is not critically stressed nor will become critically stressed under the geothermal operating conditions, might be a candidate for utilisation for both injection and production.
A higher than expected reservoir temperature was encountered in the hydrocarbon exploration well Luttelgeest-01, reaching a 500 m thick Dinantian Limestone sequence at 5115 m true vertical depth (TVD). A possible explanation of this phenomenon is the occurrence of convection cells (Fig. 6). The Dinantian Limestone interval has a suitable thickness to initiate and sustain such a convection cell (Lipsey et al., Reference Lipsey, Pluymaekers, Goldberg, van Oversteeg, Ghazaryan, Cloetingh and van Wees2016). Alternatively, a combination of thermal blanketing and highly conductive strata may result in a composite temperature gradient deviating from the average linear gradient (Bonté et al., Reference Bonté, van Wees and Verweij2012).
As this ‘Ultra Deep’ section of the Lower Carboniferous is yet under-explored and the geothermal potential not proven, it is best to call this specific Ultra Deep geothermal play (UDG, 2018) a yet unproven play.
Devonian geothermal play
Devonian strata are only drilled in a few places in the Netherlands: predominantly in the south, moving towards the London–Brabant Massif, where they lie at relatively shallow depths (<3 km). Towards the north, the wells Uithuizermeeden-2, Luttelgeest-1 and Winterwijk-1 (www.nlog.nl) encountered the Devonian at depths >4 km. All penetrated Devonian intervals are characterised by tight sandstones and claystones of the Bosscheveld Formation. As Dutch lithostratigraphy for this interval lacks detail, the Belgian and German nomenclature is adopted in order to describe the stratigraphy encountered in the Californië geothermal wells (CAL-GT-1 to -5). In these wells, below the Dinantian Limestones (Zeeland Formation), the Devonian, tight arkosic sandstones of the Condroz Formation are recognised below a claystone interval which can be interpreted as the Pont d’Arcole Formation and the transitional beds from the Hastière Formation (Tournasian). No Devonian Carbonates have been encountered yet. Because the Devonian sandstones are very tight, this potential Devonian geothermal play relies on fracture and/or fault permeability as proven by the geothermal wells CAL-GT-4 and -5.
Unproven geothermal plays
Unproven geothermal plays are areas where the reservoirs have yet not proven to deliver suitable or economic flow for geothermal use. The now unfavourable plays may become more interesting in the future.
Zechstein play
Zechstein Carbonates, especially of the Zechstein 2 cycle, have high enough porosity and permeability for gas and oil exploration and production. The subsurface occurrence of the Zechstein Carbonate facies is well known (Geluk, Reference Geluk2005). A lot of reservoir data is available from the oil and gas wells targeting the Zechstein and deeper reservoirs. In places the Zechstein reservoir is excellent, as for example in the Alkmaar Underground Gas Storage facility. Additionally, enhanced reservoir properties occur when the carbonates are partially leached below the base Cretaceous unconformity.
Upper Carboniferous play
The Upper Carboniferous, Westphalian C, Tubbergen Sandstone is the reservoir in eastern Netherlands gas fields (Breunese et al., Reference Breunese, Andersen, Brinkman, Jagosiak, Karnin, Karnkowski, Kombrink, Messner, Mijnlieff, Olsen, Peryt, Piske, Poprawa, Roelofsen, Stoker, Smith, Swann, Waksmundzka, Veldkamp, Doornenbal and Stevenson2010). Because geothermal application also requires porous, permeable and high connective reservoirs, the Tubbergen sandstones are the most likely Upper Carboniferous geothermal target (Table 2). They are only present in a small part of the Netherlands because they are (if deposited) eroded at the Base Permian Unconformity in a large part of the Netherlands (Mijnlieff, 2003). Mapping results provided through ThermoGis-v2.1 show very low transmissivity values over most of the preserved Tubbergen reservoir subcrop (Fig. 14). Only the parts where the Upper Carboniferous gas fields are situated approach the transmissivity lower threshold.

Fig. 14. Upper Carboniferous geothermal play maps. (A) The transmissivity map of the Upper Carboniferous reservoirs. (B) The average temperature of the combined Upper Carboniferous reservoirs. (Source: ThermoGis-v2.1, last accessed on 23 February 2019.) For structural elements abbreviations see Fig. 9.
Based on the mapped Upper Carboniferous reservoirs and the available reservoir data, ThermoGis-v2.1 gives an estimated HIP of 222,889 PJ of source potential.
Conclusions
The Dutch subsurface provides ample geothermal potential for direct use purposes. The geothermal plays are characterised by descriptive terms: Low Enthalpy, Hydrothermal, Conductive, Hot Sedimentary Aquifers. Additional, essential descriptive terms for the Dutch situation address the predominant permeability type, matrix permeability and, to a lesser extent, fracture, karst or fault permeability.
Reasonable to excellent sandstone matrix permeability in combination with relatively high net thickness provides favourable transmissivity/permeability thickness for geothermal applications. In particular, the Upper Jurassic – Lower Cretaceous reservoirs in the West Netherlands Basin and Rotliegend reservoirs around the Texel–IJsselmeer High have proven to be well suited for geothermal development. These reservoirs have favourable facies, clean thick stacked sandstone beds of braided river type sediments and aeolian sediments respectively. Other plays are somewhat less attractive because, on the one hand, of facies-related low thickness and/or low permeability resulting in low transmissivity and, on the other hand, low permeability due to porosity and permeability deterioration during deep burial. Geothermal systems relying on fault and related fracture permeability in further tight rock would be a special sub-play within the Low Enthalpy, Hydrothermal, Conductive, Hot Sedimentary Aquifers, requiring additional exploration and development strategies to address seismicity hazard.
Within the Dutch onshore, there are numerous gas- and oilfields. They are concentrated in specific petroleum geological provinces such as the West Netherlands Basin and Rotliegend play area in the northern part of the Netherlands. Therefore, firstly the exploration and thus the play area for purely geothermal is reduced as developing geothermal systems in, and in the vicinity of, depleted gas fields is unfavourable. Secondly, there is the potential risk of encountering a gas- or oil accumulation. On the other hand, the occurrence of solution gas in the formation water or oil is, for large parts of the Netherlands, a fact which can be seen as a subsurface energy bonus to the geothermal heat.
Acknowledgements
I especially thank Andrea Vondrak for her remarks on the first draft and patience to receive the second draft. The second draft improved thanks to the constructive remarks of Jeroen van der Molen and of both reviewers Henk van Lochem and Robert Schöner, for which I am very grateful. Furthermore, thanks to numerous discussions with colleagues and stakeholders in the geothermal sector, I was able to present this overview. Without them it would not have been possible.
Appendix: definition list
Geothermal source: In the geothermal energy context, the Renewable Energy Source is the thermal energy contained in a body of rock, sediment and/or soil, including any contained fluids, which is available for extraction and conversion into energy products. This source is termed the Geothermal Energy Source and is equivalent to the terms ‘deposit’ or ‘accumulation’ used for solid minerals and fossil fuels. The Geothermal Energy Source results from any influx to outflux from internal generation of energy within the system over a specified period of time (UNECE, 2016) (in Dutch the ‘aardwarmtebron’). The energy contained within the geothermal source can be expressed as a quantity of heat in joules (TJ) (informally, it may be called Heat In Place abbreviated to HIP).
Geothermal resource: Geothermal Energy Resources are the cumulative quantities of Geothermal Energy Products (heat or electricity) that will be extracted from the Geothermal Energy Source, from the effective date of the evaluation till the end of the Project Lifetime/Limit (in Dutch the ‘aardwarmtehulpbron’). It is the energy delivered, measured and evaluated at the reference point. It has the dimension of joule (J) or kWh.
‘Geothermal Energy Product’: A Geothermal Energy Product is an energy commodity that is saleable in an established market.


 Open access