


Introduction
Biodiversity conservation across large landscapes has become a significant global challenge as human activities continue to affect and fragment natural systems (Haddad et al., Reference Haddad, Brudvig, Clobert, Davies, Gonzalez and Holt2015). Although conventional protected areas such as national parks are critical in this regard, their limited geographical scope suggests the need for human–wildlife coexistence beyond their boundaries (Naughton-Treves et al., Reference Naughton-Treves, Holland and Brandon2005). Transfrontier initiatives are a promising approach for addressing large-scale conservation challenges by transcending political boundaries and matching the level of governance to the scale of the problem (Schoon, Reference Schoon2013). Transfrontier conservation areas integrate protected areas, wildlife corridors and buffer zones into a unified management framework, with the overarching goal of creating viable habitat for wildlife. In addition, they promote sustainable livelihoods and social cohesion amongst neighbouring communities, facilitating long-term coexistence with wildlife (Andersson et al., Reference Andersson, de Garine-Wichatitsky, Cumming, Dzingirai and Giller2013).
The Kavango–Zambezi Transfrontier Conservation Area (KAZA TCA) is a landscape conservation initiative established in 2006 and gradually expanded to an area of c. 520,000 km2 spanning five countries in southern Africa (Angola, Botswana, Namibia, Zambia and Zimbabwe; Cumming, Reference Cumming2008). It is one of the largest conservation landscapes globally and may be one of the most intact conservation areas in Africa (Fynn & Bonyongo, Reference Fynn and Bonyongo2011). However, with the increasing scale of conservation landscapes there may be a lack of resources to protect such vast areas, leading to conservation overstretch (Scholte et al., Reference Scholte, Pays, Adam, Chardonnet, Fritz and Mamang2022). The KAZA TCA emerged as an institutional solution backed by international support, yet the countries involved differ substantially in their capacity to implement and enforce conservation (Linell et al., Reference Linell, Sjöstedt and Sundström2019). Engagement of local communities in natural resource management is variable and rural livelihoods remain threatened by interactions with wildlife, resulting in low tolerance towards certain species, particularly large carnivores (Andersson et al., Reference Andersson, de Garine-Wichatitsky, Cumming, Dzingirai and Giller2013; Stoldt et al., Reference Stoldt, Göttert, Mann and Zeller2020).
Understanding wildlife distributions can help identify potential human–wildlife conflict areas and could inform land-use planning. In the KAZA TCA, food availability and protection status have been found to strongly influence mammal occurrence (Searle et al., Reference Searle, Kaszta, Bauer, Kesch, Hunt and Mandisodza-Chikerema2022), whereas fence lines, high-use roads and areas of anthropogenic activity in general act as movement barriers within the landscape (Brennan et al., Reference Brennan, Beytell, Aschenborn, du Preez, Funston and Hanssen2020). Maintaining long-term connectivity is critical, with several research efforts having identified movement corridors and key areas within this landscape (Elliot et al., Reference Elliot, Cushman, Macdonald and Loveridge2014; Cushman et al., Reference Cushman, Elliot, Macdonald and Loveridge2016, Reference Cushman, Elliot, Bauer, Kesch, Bahaa-el-din and Bothwell2018; Brennan et al., Reference Brennan, Beytell, Aschenborn, du Preez, Funston and Hanssen2020; Hofmann et al., Reference Hofmann, Behr, McNutt, Ozgul and Cozzi2021). However, much of the KAZA TCA remains understudied, in particular its peripheral areas. Hence, there is a need to better understand the potential contributions of remote and local sections of the KAZA TCA to the larger conservation context.
Mammalian carnivores play a vital role in ecosystem functioning by regulating trophic levels from the top down (Ripple et al., Reference Ripple, Estes, Beschta, Wilmers, Ritchie and Hebblewhite2014), and the loss of carnivore species at the local level can destabilize ecosystems (Prugh et al., Reference Prugh, Stoner, Epps, Bean, Ripple, Laliberte and Brashares2009). Here we assess the distribution of the carnivore community in an understudied region of the KAZA TCA in Namibia and identify drivers of their occurrence at the local human–wildlife interface. We expect carnivore occurrence is determined by resource availability and anthropogenic activities (Woodroffe, Reference Woodroffe2000; Carbone & Gittleman, Reference Carbone and Gittleman2002). More specifically, prey availability is critical for ensuring the long-term viability of the carnivore community (Wolf & Ripple, Reference Wolf and Ripple2016), and source–sink dynamics with neighbouring conservation areas may support carnivore persistence in human-impacted landscapes (Mouquet & Loreau, Reference Mouquet and Loreau2003). As many carnivore species are potential sources of conflict, facilitating human–carnivore coexistence is particularly complex, but is critical for safeguarding biodiversity and securing sustainable livelihoods for local people (Treves & Karanth, Reference Treves and Karanth2003; Dickman, Reference Dickman2010).
Study area
The Ondjou communal conservancy lies in the Otjozondjupa region of north-eastern Namibia (Fig. 1). Namibian communal conservancies are community-based institutions that have obtained conditional rights to utilize wildlife occurring in the area (MEFT/NACSO, 2018). Ondjou Conservancy was established in 2006 and covers an area of 8,729 km2. The human population is estimated to be c. 3,000 people, mostly belonging to the Herero ethnic group. The main settlement is the town of Gam in the east of our study area, and most people reside in the eastern part of the Conservancy. The main livelihood is cattle and small stock farming in free-range conditions, but trophy hunting and devil's claw Harpagophytum sp. harvesting (the latter for medicinal purposes) provide significant additional revenue sources for these communities (NACSO, 2023). The Conservancy borders Botswana in the east and has represented the south-western extent of the KAZA TCA since 2011.
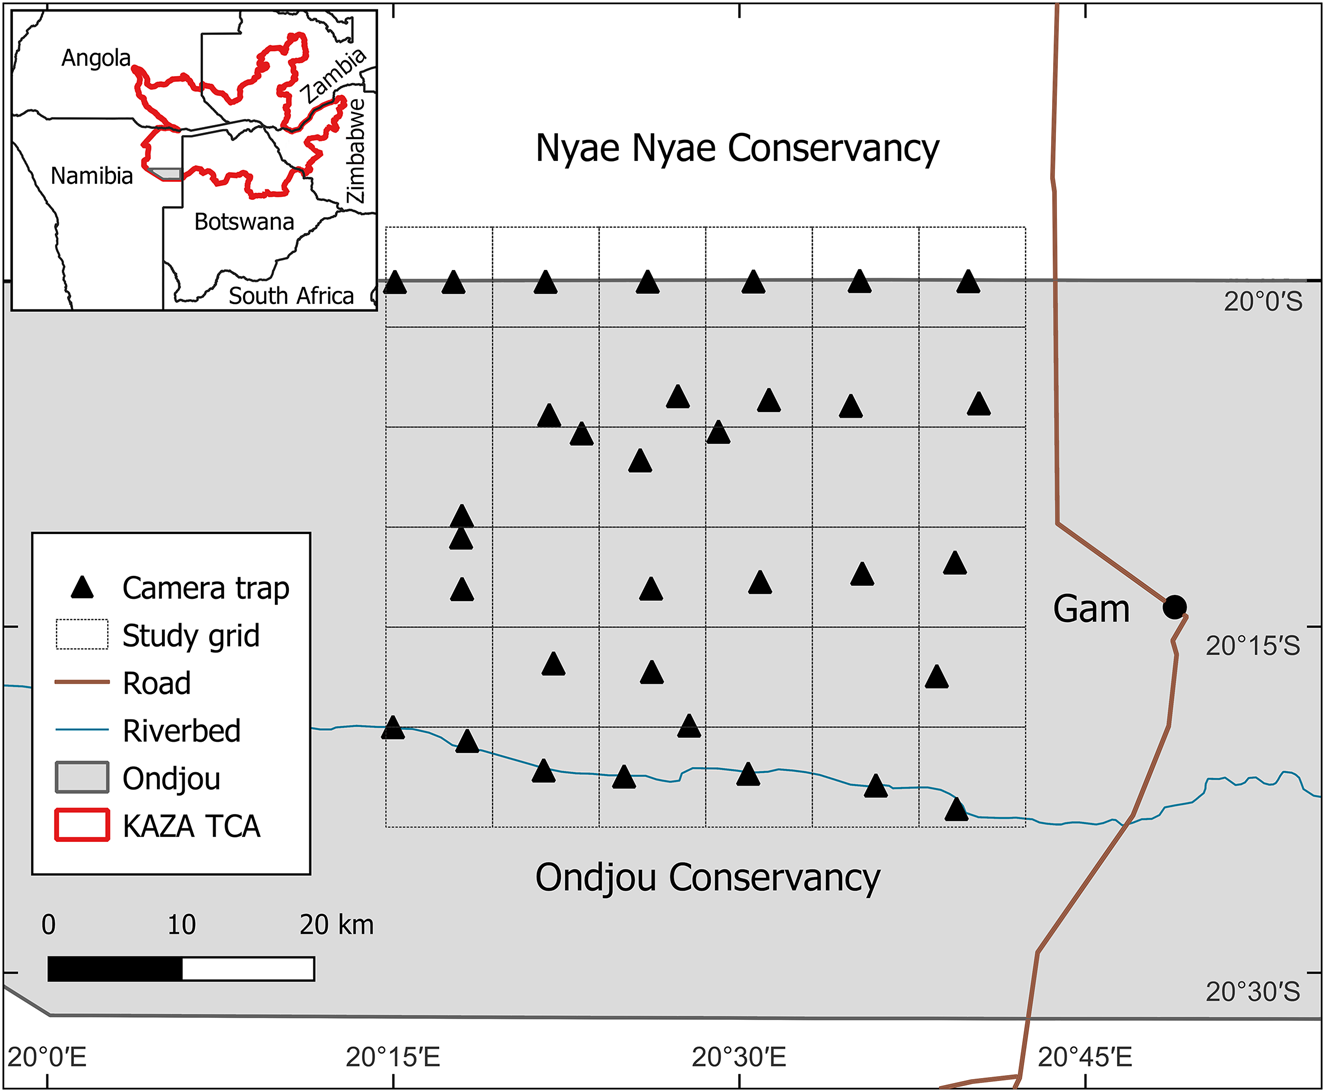
Fig. 1 The study area in the Ondjou Conservancy within the Kavango–Zambezi Transfrontier Conservation Area (KAZA TCA), with the 8 × 8 km grid used for the positioning of camera traps and the location of the main settlement, Gam.
The vegetation in the area is characterized as broad-leaved tree-and-shrub savannah and is typical for the Northern Kalahari region. The area is dominated by woody plants, including trees and shrubs, and it is interspersed with grasses and herbs typically found in ancient riverbeds that are carved through the landscape. The soil is predominantly composed of Arenosols, which are sandy with low organic matter content, making them unsuitable for crop cultivation. The climate is hot and semi-arid, with a mean annual temperature of 22–24 °C and annual rainfall of 350–400 mm, concentrated in the wet season during November–March (Atlas of Namibia Team, 2022).
Methods
Data collection
During July–September 2022 we deployed unbaited camera traps (Browning Strike Force Pro XD, Browning, USA) at 35 locations facing unpaved roads (Fig. 1). We overlaid an 8 × 8 km grid (2,304 km2) over the study area, capturing a gradient of increasing human activity from west to east. We targeted camera-trap placement near the centroid of each grid cell to ensure independence at sampling locations and to minimize spatial autocorrelation. This was not always possible because of the inaccessibility of the area, resulting in four unsampled cells and four cells with two camera-trap locations. Two additional cells were unsampled because of missing camera traps, reducing the total number of camera-trap locations to 33. Mean camera trap spacing was 6.1 km and met the assumptions of spatial independence for most species (Rich et al., Reference Rich, Miller, Muñoz, Robinson, McNutt and Kelly2019). To increase detection, we placed two camera traps per location, facing each other at a slight angle and mounted c. 75 cm above the ground and 5 m apart. We programmed the camera traps to take pictures with a 5 min delay between triggers, to save battery life. Each trigger produced a burst of five images taken within 1 s. The camera traps were active for 2 months. We classified animals in images to species using TrapTagger, an open-source web application that uses artificial intelligence (AI) in combination with a manual annotation interface to process camera-trap data (WildEye, 2023). We relied on MegaDetector (part of TrapTagger) for the detection of animals and the removal of empty images. We manually annotated all detections using the TrapTagger interface and subsequently verified these with AI-generated annotations based on a southern African species classifier. Camera-trap detections were considered independent if they were separated by at least a 30 min interval (O'Brien et al., Reference O'Brien, Kinnaird and Wibisono2003).
Data analysis
We used rarefaction analysis to evaluate species richness from the results of sampling. We created the rarefaction curve by randomly resampling the pool of survey locations and plotting the cumulative number of species records at each additional location (Gotelli & Colwell, Reference Gotelli and Colwell2001). We performed this analysis for both carnivore and prey species using the package Rarefy (Thouverai et al., Reference Thouverai, Pavoine, Tordoni, Rocchini, Ricotta, Chiarucci and Bacaro2021) in R 4.2.2 (R Core Team, 2022).
To examine patterns of carnivore occurrence, we analysed detection/non-detection data from camera traps in a multi-species occupancy framework using the R package spOccupancy (Doser et al., Reference Doser, Finley, Kéry and Zipkin2022). This approach treats species-specific regression coefficients for occupancy and detection as random effects arising from community-level normal distributions. This leads to greater precision of species-specific effects, in particular for rare species. It also presents a community-level estimate for occurrence and detection and facilitates estimation of biodiversity metrics (Dorazio & Royle, Reference Dorazio and Royle2005; Devarajan et al., Reference Devarajan, Morelli and Tenan2020). We performed a posterior predictive check of all model objects as a goodness-of-fit assessment to validate whether the generated data aligned with the observed data. Reported Bayesian P-values close to 0.5 indicate adequate model fit, whereas values < 0.1 or > 0.9 suggest that the model did not fit the data well (Hobbs & Hooten, Reference Hobbs and Hooten2015).
We ran one model for the dry season only and considered four sampling occasions of 14 days each to meet the closure assumption. Carnivore distributions across Namibian rangelands appear to be influenced by the availability of key resources during the dry season, yet there could be contrasting covariate associations between seasons (Verschueren et al., Reference Verschueren, Briers-Louw, Monterroso and Marker2021). We included three site covariates related to anthropogenic disturbance and resource availability that could explain carnivore probability of occurrence. (1) We included the Euclidean distance to Gam as a measure of human activity in the area. Gam is east of the study area and additional, smaller human settlements were more common with decreasing distance to Gam. We expected carnivores to be more common farther away from Gam. (2) We included the Euclidean distance to the neighbouring Nyae Nyae Conservancy (also in the KAZA TCA) as a surrogate of safety for carnivores. Nyae Nyae Conservancy has a strong history of conservation success, and human tolerance towards wildlife in the Conservancy is high (Lendelvo et al., Reference Lendelvo, Kazembe and Mfune2019). Source–sink dynamics could support the carnivore guild in Ondjou Conservancy, and we expected carnivores to be more common close to Nyae Nyae Conservancy, as a source. (3) We included local prey richness (i.e. number of mammalian species with body mass > 1 kg recorded per camera-trap location, excluding Carnivora and elephants Loxodonta africana) as a measure of resource availability for carnivores. Although this measure may not represent the suite of prey species available for smaller carnivores, local prey richness from camera-trap data is a measure of resource availability for large carnivores and mesocarnivores and therefore potentially for small carnivores that often scavenge on kills made by larger predators (Pereira et al., Reference Pereira, Owen-Smith and Moleón2014; Sivy et al., Reference Sivy, Pozzanghera, Grace and Prugh2017). We expected carnivores to be more common with high local prey richness.
Although the multi-species occupancy accounted for imperfect detection, we assumed a constant detection probability across camera-trap sites as we deployed all camera-trap stations similarly, with cameras facing open areas (unpaved road surface) and with little variation in habitat. We recognize the potential for unaccounted variation in detection probability; however, because of limitations in deriving meaningful detection covariates and the risk of overparameterization we considered assuming constant detection to be the most pragmatic approach. We standardized all occupancy covariates and checked them for collinearity using Spearman correlation tests, to ensure there were no strong correlations (ρ < 0.7). We interpreted the occupancy estimator as the probability of site use, to minimize potential assumption violations regarding the grid cell size not being reflective of the home range sizes of the various carnivore species.
To understand species-specific variations in site use intensity, detection probability and the three covariate responses, we classified carnivore species based on their feeding strategies, distinguishing between carnivores relying primarily on one dietary category (vertebrates or invertebrates) and omnivores that depend on multiple dietary categories (vertebrates, invertebrates, fruits and/or plants). We also categorized them by family and assigned each species a mean body mass (Jones et al., Reference Jones, Bielby, Cardillo, Fritz, O'Dell and Orme2009). We represented the offset with the community estimate for each species within these defined categories. To understand the effects of these classifications on carnivore occurrence, detection and covariate associations, we applied five generalized additive models with body mass as a smoothing term and feeding strategy as a categorical factor. This is a flexible approach to modelling non-linear relationships and could provide insights into species-specific differences. We used the R package voxel to run the generalized additive models (Garcia de la Garza et al., Reference Garcia de la Garza, Vandekar, Roalf, Ruparel, Gur and Gur2018).
Results
We collected 317,758 images over 1,963 camera-trap nights. We detected animal and human activity in 58,654 images and identified 29 mammalian wildlife species, of which 18 belonged to the order Carnivora (Table 1). Domestic animals and people were detected most frequently, followed by brown hyaena Parahyaena brunnea and black-backed jackal Canis mesomelas. Only eight species were identified as prey species (bushpig Potamochoerus larvatus, common duiker Sylvicapra grimmia, greater kudu Tragelaphus strepsiceros, gemsbok Oryx gazella, scrub hare Lepus saxatilis, South African springhare Pedetes capensis, steenbok Raphicerus campestris and waterbuck Kobus ellipsiprymnus). Collectively, the ratio of independent camera-trap detections of livestock : carnivore : wild prey was 6.18 : 1.83 : 1.00. The rarefaction analysis suggests that probably most carnivore and wild prey species present in the study area were detected and that the carnivore community was more diverse than the community of prey species (Fig. 2).
Table 1 Summary of body mass, number of independent camera-trap detections, probability of site use (ψ), probability of detection (p), covariate associations (β) for the influence of Euclidean distances to Gam and Nyae Nyae Conservancy and number of prey species with body mass > 1 kg, and Bayesian P-values for goodness-of-fit tests for carnivorous and omnivorous species (order Carnivora) detected in Ondjou Conservancy, Namibia (Fig. 4); 95% confidence intervals are given in Supplementary Table 1.
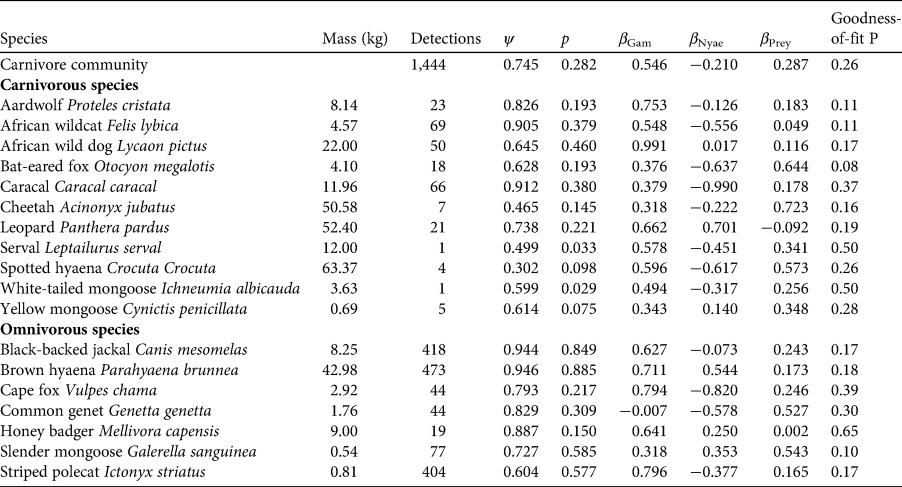
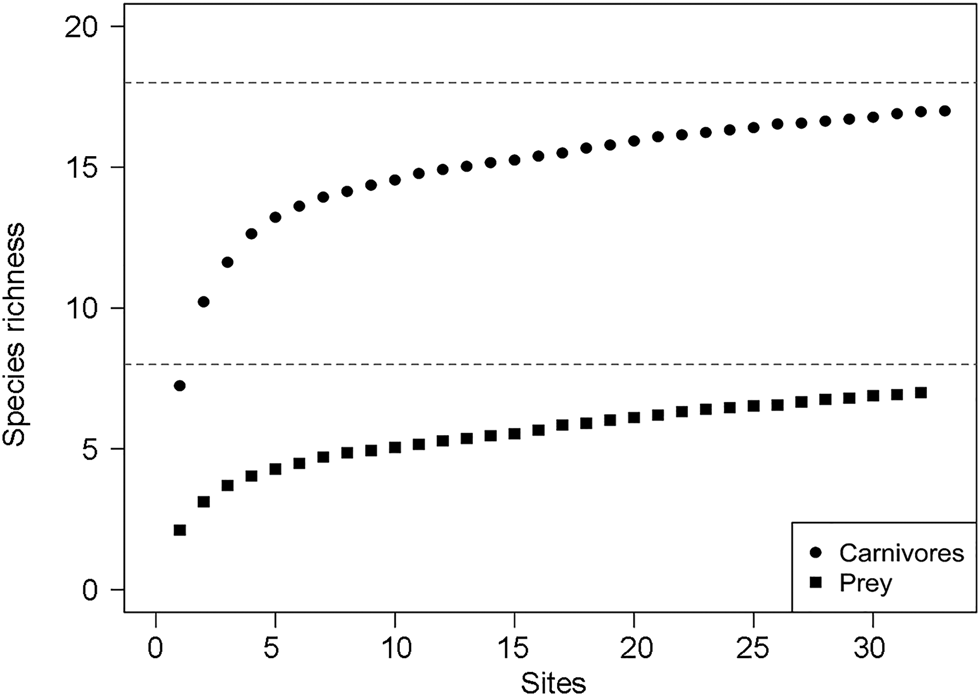
Fig. 2 Rarefaction curves to estimate species richness from camera-trap survey intensity for carnivore and wild prey species in Ondjou Conservancy in the Namibian part of the Kavango–Zambezi Transfrontier Conservation Area (Fig. 1). Dashed horizontal lines denote the observed species richness values.
Carnivores appear to be widespread in the landscape, with a community-level probability of occurrence of 0.745 and probability of detection of 0.282 (Table 1). Carnivores were more likely to utilize areas far from the main village and close to Nyae Nyae Conservancy, as well as areas where local prey richness was high (Table 1, Fig. 3). There were differences amongst species (Fig. 4) that varied with body mass and feeding strategy (Fig. 5). Omnivorous species tended to be more common across the study area and had a higher probability of detection compared to exclusively carnivorous species. We did not detect any differences for the covariate responses (Table 2). We found no significant effects of body mass on site use intensity, detection probability or any of the three covariate associations, although large-sized species appeared to be less common across the study area than small-sized species. Large-sized species, in particular the brown hyaena, leopard Panthera pardus and, to a lesser extent, African wild dog Lycaon pictus, were more common with increasing distance from Nyae Nyae Conservancy.
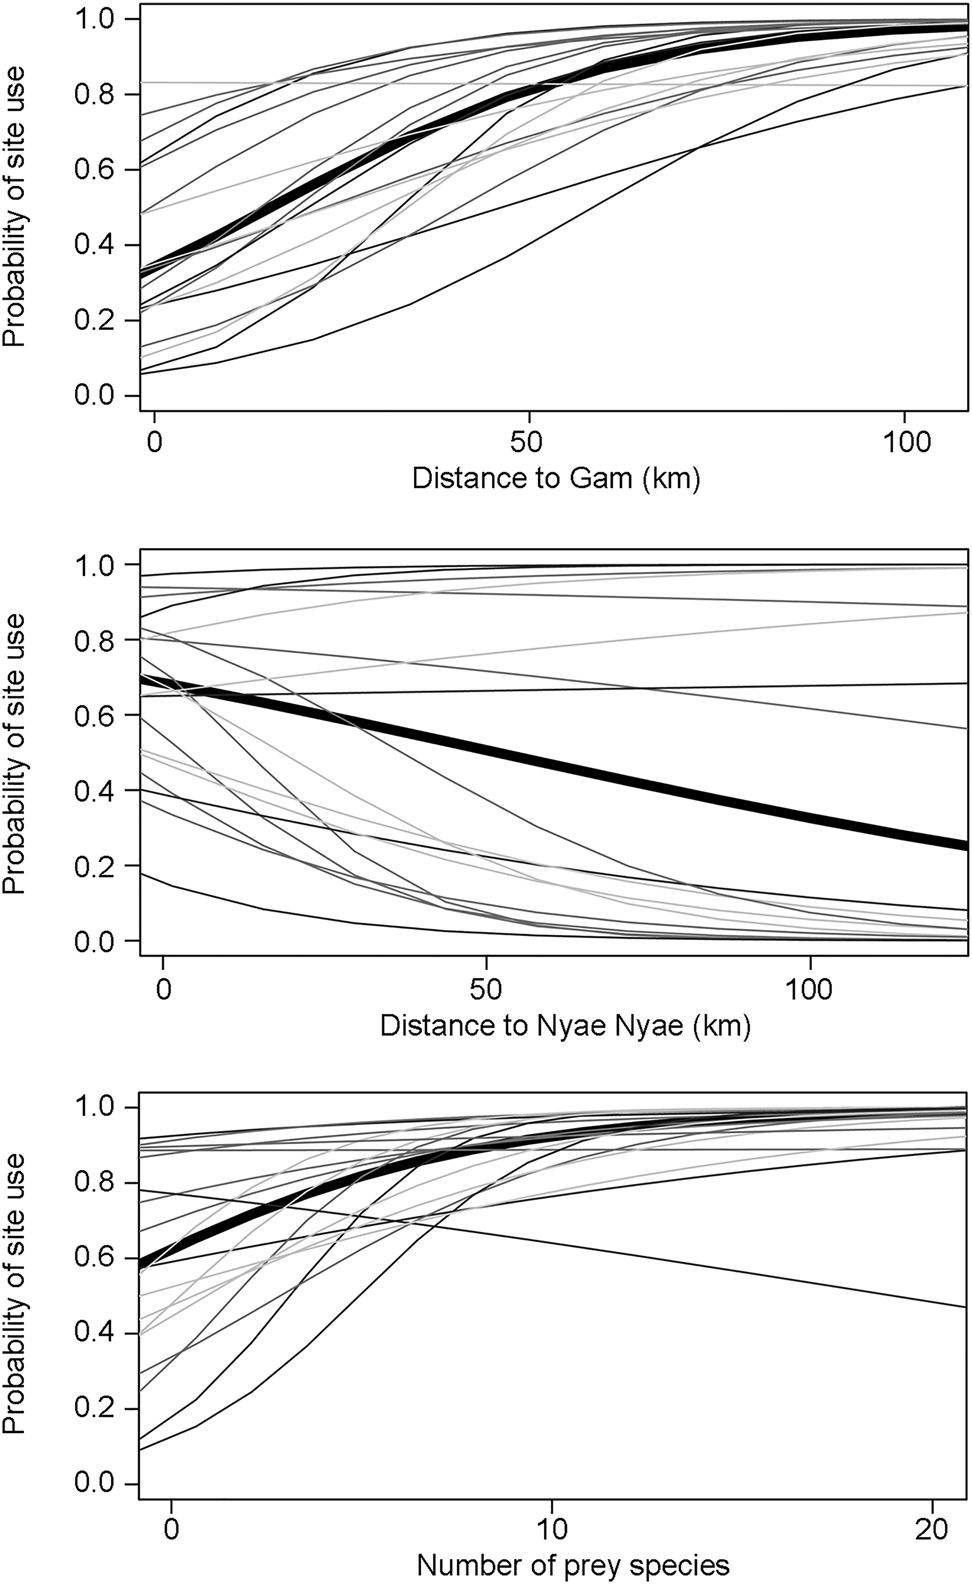
Fig. 3 Carnivore community (thick line) and species (thin lines, with lighter shading indicating lower body mass) responses to covariates (distances to Gam and Nyae Nyae Conservancy and number of prey species with body mass > 1 kg) explaining probability of site use in Ondjou Conservancy.
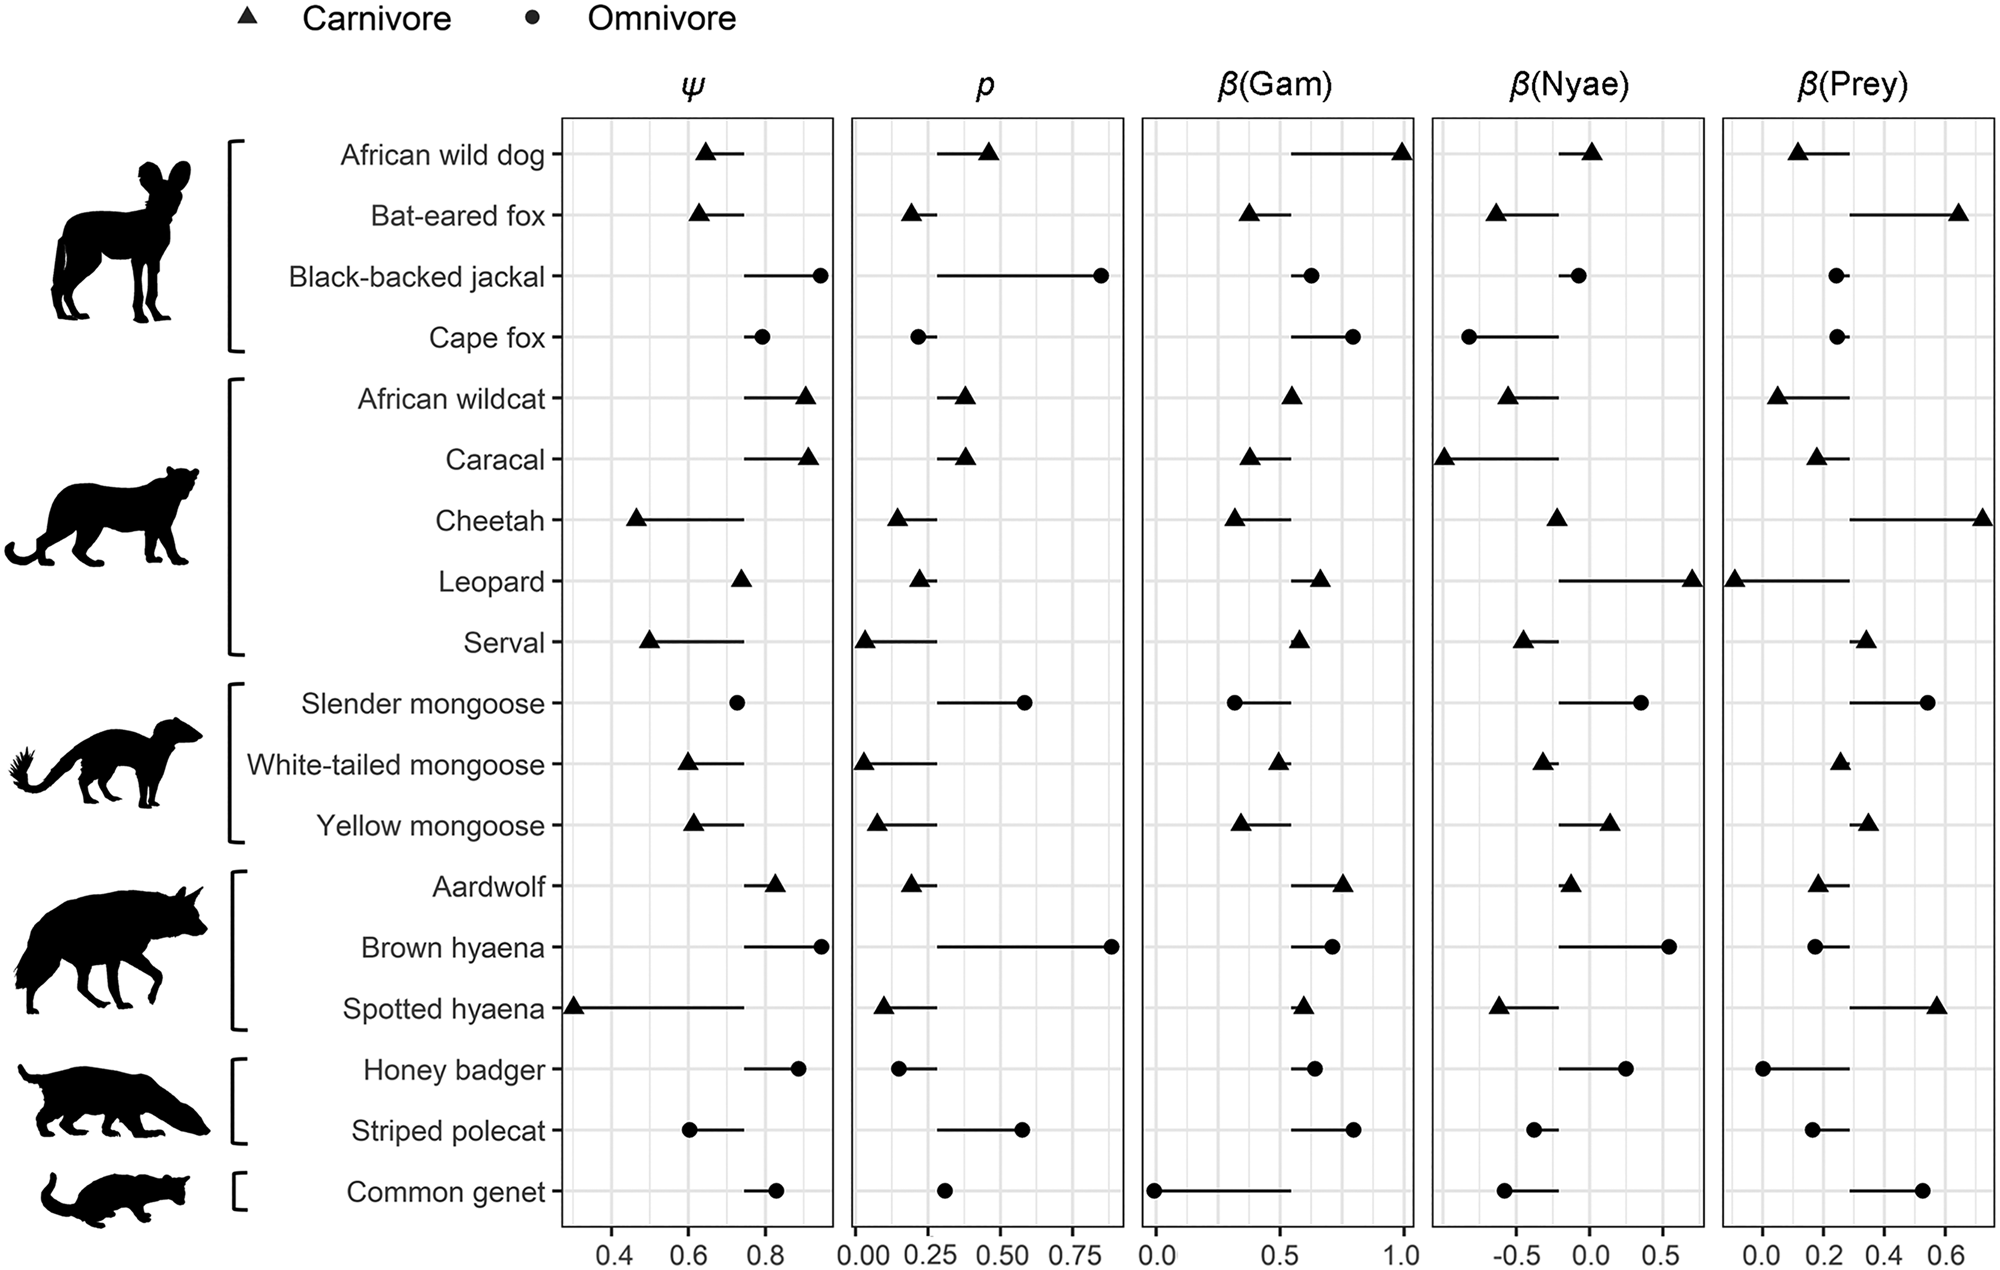
Fig. 4 Species-specific estimates of site use (ψ), probability of detection (p) and covariate associations (β) for the influence of Euclidean distances to Gam and Nyae Nyae Conservancy and number of prey species with body mass > 1 kg. The symbols show the species-specific values, with the black horizontal lines showing the difference from the community estimate. Species are categorized by family (Canidae, Felidae, Herpestidae, Hyaenidae, Mustelidae, Viverridae) and feeding strategy (carnivore, omnivore; Table 1).
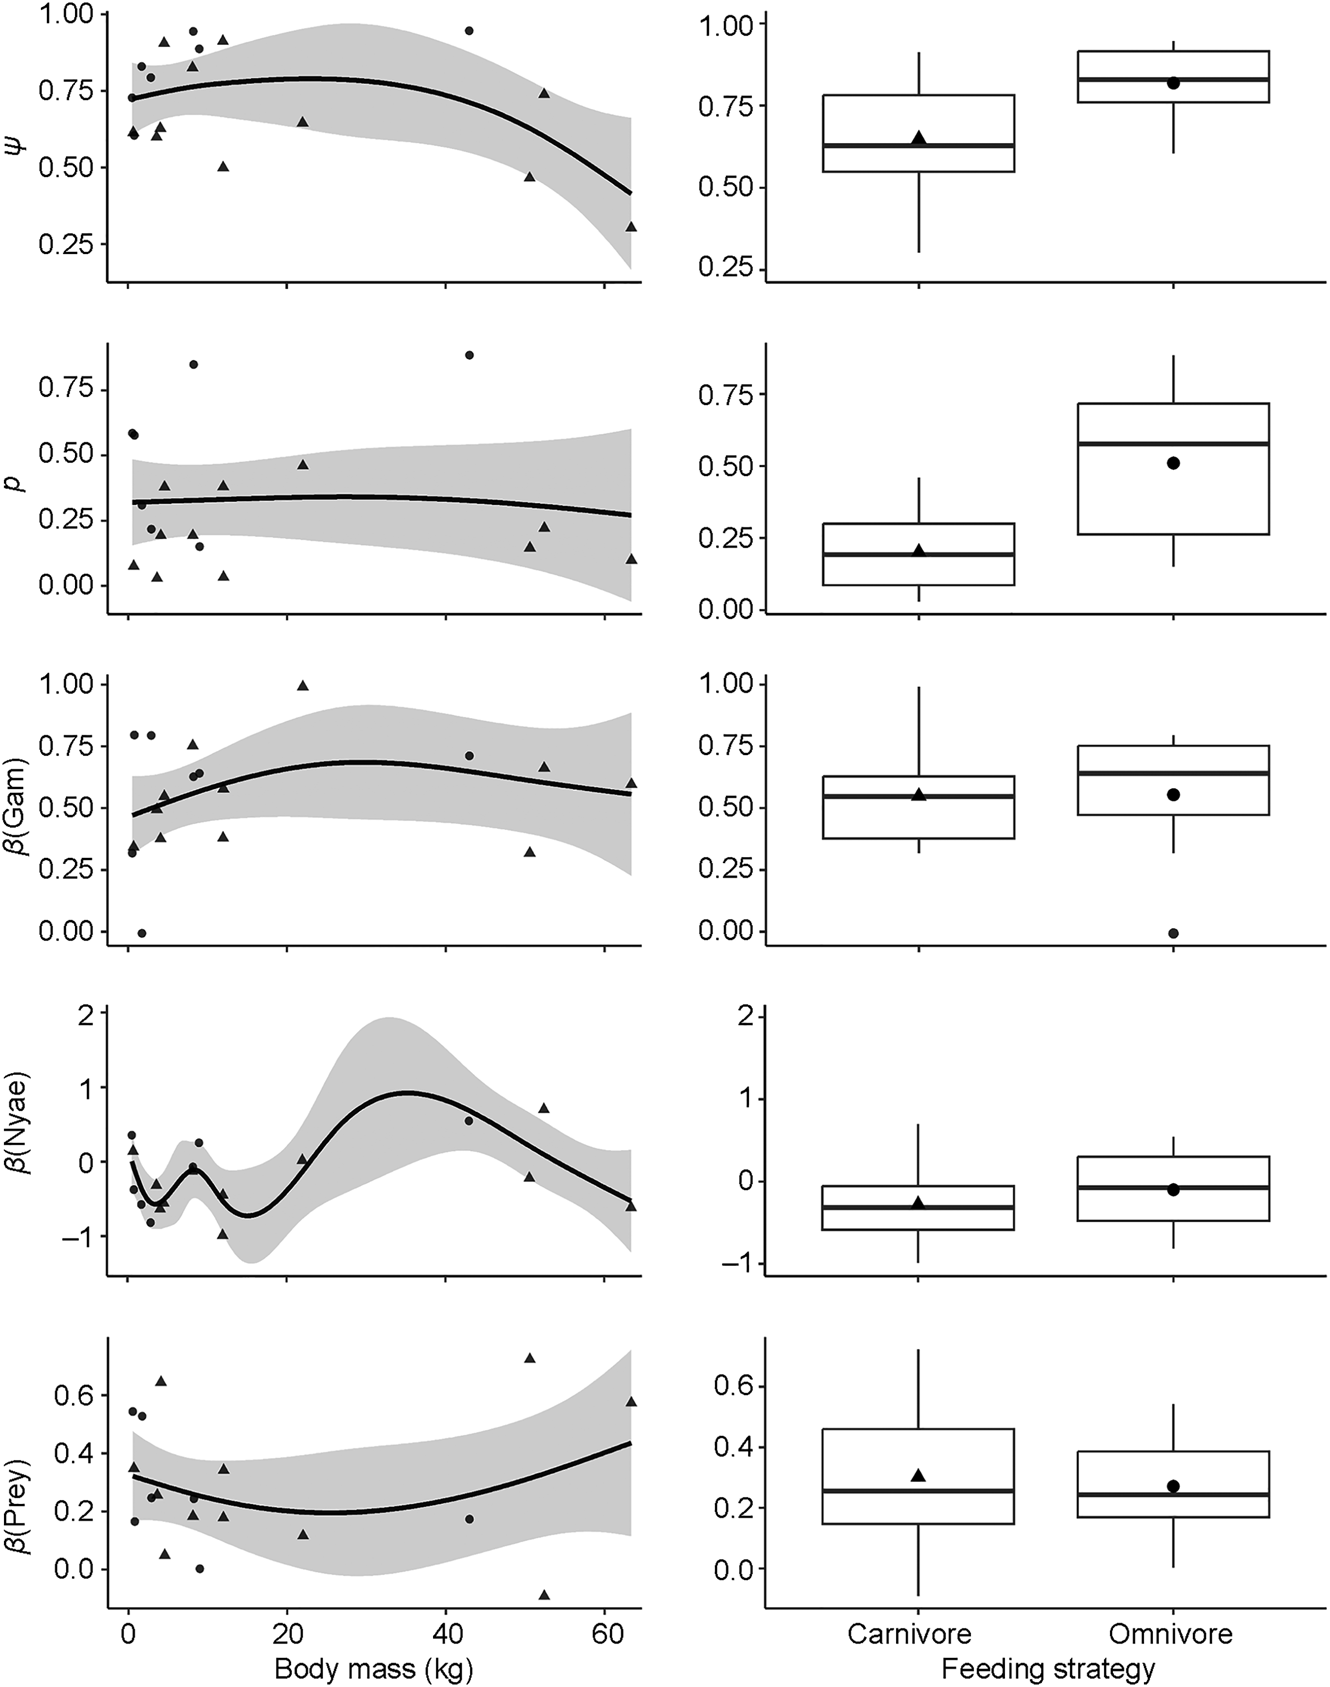
Fig. 5 Responses of site use intensity (ψ), detection probability (p) and covariate associations (β) for the influence of Euclidean distances to Gam and Nyae Nyae Conservancy and number of prey species with body mass > 1 kg to species variation in body mass (left) and feeding strategy (right) (Table 2).
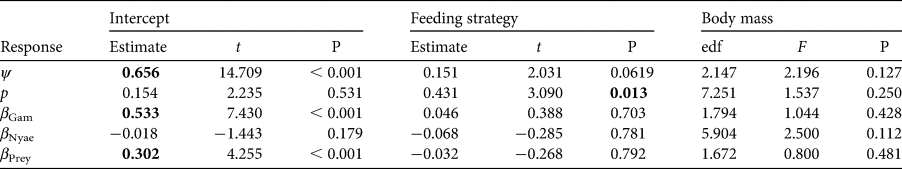
Table 2 Summary statistics for the generalized additive models used for probability of site use (ψ), probability of detection (p) and covariate associations (β). t-values are given for the intercept and categorical factor. The effective degrees of freedom (edf) and F-value are given for the smoothing term. Significant values (P < 0.05) are highlighted in bold.
Discussion
The carnivore community in Ondjou Conservancy has a high species richness, demonstrating various feeding strategies, body sizes and ecological requirements. Carnivore richness was comparatively higher than several other assemblages of free-ranging carnivores across semi-arid rangelands in southern Africa (Edwards et al., Reference Edwards, Gange and Wiesel2015; Curveira-Santos et al., Reference Curveira-Santos, Sutherland, Santos-Reis and Swanepoel2021; Verschueren et al., Reference Verschueren, Briers-Louw, Monterroso and Marker2021; Reasoner, Reference Reasoner2023). This indicates there is sufficient natural habitat, yet wild prey availability and distance to Gam had strong and uniform effects on carnivore occurrence in the study area. Consequently, the carnivore guild may be threatened by prey depletion and human disturbance, and action is required to achieve the conservation potential of Ondjou Conservancy, an overlooked region that could function as an important conservation area.
Local prey richness was an important driver of carnivore site use, yet the overall number of prey species and detections, particularly of medium- to large-sized antelopes, was low. This discrepancy could be attributed to the pervasive issue of poaching, which reduces competition for livestock grazing resources and supplements the protein sources of local communities. This imbalance between predator and prey diversity raises the question of whether carnivore diversity accurately reflects ecosystem health, and warrants consideration at a broader scale. Carnivores in Ondjou Conservancy could be supported through source–sink dynamics with the neighbouring Nyae Nyae Conservancy, which harbours abundant wild prey populations and human communities with high tolerance of wildlife (Mouquet & Loreau, Reference Mouquet and Loreau2003; Lendelvo et al., Reference Lendelvo, Kazembe and Mfune2019). Nyae Nyae Conservancy may be critical for carnivores to reproduce, access prey and establish permanent populations, and carnivores in adjacent areas such as Ondjou Conservancy presumably have lower survival because of anthropogenic threats. On the other hand, omnivorous species, such as the black-backed jackal, may be better suited to persist in human-impacted landscapes because of their opportunistic and generalist foraging strategy (Kaunda & Skinner, Reference Kaunda and Skinner2003). It is also possible that Ondjou Conservancy could act as an ecological trap, particularly for larger carnivores that may be more vulnerable to anthropogenic threats (van der Meer et al., Reference van der Meer, Rasmussen and Fritz2015). During our field surveys we learned of several cases of human–wildlife conflict resulting from livestock depredation and predator persecution. The African wild dog, brown hyaena, cheetah Acinonyx jubatus and leopard are competitively inferior to the lion Panthera leo and spotted hyaena Crocuta crocuta, which occur widely in Nyae Nyae Conservancy. Consequently, these subordinate species could be drawn to areas that appear suitable for survival and reproduction but could be harmful because of human persecution. This hypothesis aligned with our observations of two resident packs of African wild dogs in the western part of the study grid. In contrast, our observations closer to Nyae Nyae Conservancy indicated sightings of single African wild dog individuals, possibly dispersers.
Anthropogenic activity had a strong influence on carnivore occurrence, with the majority of species avoiding the eastern part of the study near Gam. This area was characterized by abundant livestock and multiple homesteads and there were frequent camera-trap detections of people and vehicles, although free-range livestock farming, hunting of wild meat and predator persecution were probably widespread across the entire study area. Carnivores generally avoid areas of intense human use, although several species may display fine-scale behavioural adaptions to optimize resource use in human-impacted landscapes (Oriol-Cotterill et al., Reference Oriol-Cotterill, Valeix, Frank, Riginos and Macdonald2015). Unprotected livestock is often readily available and easy to catch (Puls et al., Reference Puls, Teichman, Jansen, O'Riain and Cristescu2021), and carnivores may occasionally supplement their diets with livestock, particularly when wild prey populations are low (Khorozyan et al., Reference Khorozyan, Ghoddousi, Soo and Waltert2015). Improving livestock husbandry practices will be a critical first step for promoting human–wildlife coexistence (Ogada et al., Reference Ogada, Woodroffe, Oguge and Frank2003), and restoring viable prey populations will be vital in the long term (Wolf & Ripple, Reference Wolf and Ripple2016).
Biodiversity is the cornerstone of healthy and productive ecosystems (Hooper et al., Reference Hooper, Adair, Cardinale, Byrnes, Hungate and Matulich2012). Mammalian carnivores play a vital role in this by providing important ecological services such as prey regulation, trophic cascades, food provisioning and disease control (Ripple et al., Reference Ripple, Estes, Beschta, Wilmers, Ritchie and Hebblewhite2014). Conservancies and transfrontier conservation areas can play a pivotal role in facilitating and implementing evidence-based conservation measures (Andersson et al., Reference Andersson, de Garine-Wichatitsky, Cumming, Dzingirai and Giller2013). Delineating wildlife zones could secure source populations, and developing and diversifying alternative livelihoods can build resilience amongst local communities (Cochrane & Cafer, Reference Cochrane and Cafer2018; Holland et al., Reference Holland, Larson, Powell, Holland, Allen and Nabaala2022). A fundamental aspect of this approach is community engagement and the equitable distribution of benefits (Schoon, Reference Schoon2013). Therefore, it is essential to integrate local context into conservation planning across large landscapes. Our research has contributed to this by providing baseline information on carnivore diversity and occurrence at the local human–wildlife interface.
Our study showed that a diverse carnivore guild persists in a human-impacted landscape at the periphery of the KAZA TCA, where species of global conservation concern, such as the African wild dog and cheetah, were detected and where we also recorded species beyond their known range, as documented on the IUCN Red List (the bushpig and white-tailed mongoose Ichneumia albicauda; Supplementary Material 1). Ondjou Conservancy could serve as an important buffer for the larger conservation network, facilitating wildlife movement because it provides suitable habitat over a broader landscape. However, reducing the adverse effects of external threats such as human encroachment and wildlife persecution will be key to the area functioning as a buffer and not as an ecological trap (Stoldt et al., Reference Stoldt, Göttert, Mann and Zeller2020). In addition, efforts should focus on securing and improving connectivity with existing functional core areas of the KAZA TCA. For highly mobile species (e.g. African wild dogs) landscape permeability is relatively high and populations may be well-connected (Creel et al., Reference Creel, Spong, Becker, Simukonda, Norman, Schiffthaler and Chifunte2019; Hofmann et al., Reference Hofmann, Behr, McNutt, Ozgul and Cozzi2021). However, for most large mammal species, Ondjou Conservancy appears to be isolated (Cushman et al., Reference Cushman, Elliot, Bauer, Kesch, Bahaa-el-din and Bothwell2018; Brennan et al., Reference Brennan, Beytell, Aschenborn, du Preez, Funston and Hanssen2020) or could function as a sink, and consequently its contribution to the larger conservation context could be limited. We recommend further exploration of and focus on peripheral and understudied regions of the KAZA TCA, to maximize the conservation potential of this landscape-level conservation initiative. This will be key for implementing conservation measures and ensuring functional connectivity and wildlife dispersal across one of the largest conservation landscapes.
Author contributions
Conceptualization: SV, TH, BC; data collection: SV, TH, MK; data analysis: SV; writing: SV; revision: all authors; supervision: BC, LM; funding acquisition: SV, BC, LM.
Acknowledgements
We thank the conservancy chair, community game guards and the people of Ondjou Conservancy for access to the study area and their assistance during fieldwork. Funding was provided by Leopold III-Fonds voor Natuuronderzoek en Natuurbehoud and Cheetah Conservation Fund donors.
Conflicts of interest
None.
Ethical standards
This research abided by the Oryx guidelines on ethical standards and was authorized by the Namibian National Commission on Research Science & Technology under Section 21 of the Research Science and Technology Act No. 23 of 2004. No formal ethical review was conducted as camera trapping is a minimally invasive technique for wildlife monitoring and no concerns for animal welfare arose. We followed the ethical code of conduct for the use of camera traps in wildlife research (Sharma et al., Reference Sharma, Fiechter, George, Young, Alexander and Bijoor2020). Fieldwork took place with consent of the conservancy committee and community members, and images containing people have not and will not be shared.
Data availability
The data and code supporting the findings of this study will be made available by the corresponding author upon reasonable request. Images containing people will not be shared.


 Open access