

Epidemiological data suggest a positive relationship between increased Ca intake and decreased fat and total body mass in healthy individuals(Reference Davies, Heaney, Recker, Lappe, Barger-Lux, Rafferty and Hinders1, Reference Parikh and Yanovski2). An in vitro model suggesting the role of cAMP and phosphodiesterase 3B has been implicated in the relationship between Ca and lipolysis(Reference Xue, Greenberg, Kraemer and Zemel3, Reference Zemel, Shi, Greer, DiRienzo and Zemel4). The objective of the current research was to investigate the effect of Ca supplementation on fat metabolism during moderate-intensity submaximal exercise.
Nine healthy moderately-trained subjects (n=5 males, 4 females) were tested using a randomised double-blind placebo-controlled cross-over trial design. All subjects gave informed written consent.
Table 1. Mean subject characteristics
Subjects were assigned to either a placebo or Ca intervention group at the start of the study, with a subsequent cross-over following a 1-month ‘wash-out’ period. The Ca supplementation consisted of 1000 mg of elemental calcium in the form of calcium citrate/d ingested in capsule form for 4 weeks. At baseline and at the end of each intervention period each subject undertook a 1 h bicycle ergometer test at 50% of their VO2max. Gas exchange was measured continuously using an online breath-by-breath Spirometer (Metalyzer II; Cortex, Leipzig, Germany). RER was calculated at the start and at 20, 40 and 60 min (t0, t20, t40 and t60 respectively) of each exercise trial. Body composition was measured using Harpenden skinfold callipers(Reference Jackson and Pollock5).
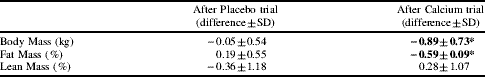
Following Ca supplementation, RER showed a downward trend throughout the 60 min exercise test. RER at t40 and t60 were significantly lower at the end of Ca supplementation than at baseline. (t40: baseline 1.12 (sd 0.08), after treatment 1.04 (sd 0.12; P<0.05); t60: baseline 1.09 (sd 0.08), after treatment 1.03 (sd 0.12; P<0.05)). This trend was not observed in the placebo trial. In addition, energy expenditure during the 60 min exercise test increased significantly following Ca supplementation (placebo 2444 (sd 887) kJ; Ca 2666 (sd 1063) kJ; P<0.05) with a commensurate trend towards a decrease in total body mass of 0.89 (sd 0.73) kg (P=0.20) and fatness of 0.59 (sd 0.09) % (P=0.29).
Table 2. Difference in body composition changes at the end of each intervention
* Denotes statistical significance.
These data suggest that Ca supplementation alters substrate metabolism during exercise, with a drop in RER that indicates an increase in fat oxidation. Ca supplementation may have a longer-term effect on body composition towards a fall in fat mass along with total body mass. Further research is now required to investigate the potential mechanism of the action of Ca on substrate metabolism in vivo, especially its ergogenic properties in improving fat oxidation during submaximal exercise.


