


Soup is a common food that may be a useful source of vegetables in the diet. Since many commercial soups are relatively high in salt, it may be better to educate the population to produce their own at home. When nutrient analyses are calculated for recipes, it is necessary to know how much water is lost by evaporation and inflate the amounts present accordingly. The classic reference work on foods does not contain soups( Footnote 1 ) and the only UK source of such data, the 5th edition of the food tables( Footnote 2 ), provides data only for lentil soup. In the latter it is claimed that weight loss is 49%, but the recipe takes>2 h to cook. Many modern recipes are much quicker to make, because busy modern life provides little time for cooking, which is beneficial in relation to vitamin losses. In order to provide information on weight loss, four soups were chosen, carrot and coriander, lentil, mushroom and vegetable, which had cooking times from 20 min to 130 min. Soups were cooked in duplicate on a Zanussi electric hob (Zanussi, Luton, Beds., UK) following published recipes for three, six and twelve portions. For the two smaller portion sizes the soups were also cooked in different pan sizes (16 and 18 cm for three portions; 18 and 20 cm for six portions), but the largest portion size was cooked in a 31 cm pan. In total forty soups were produced. Since the percentage weight loss increased with time and decreased with the amount of soup, regression analysis was used to predict weight loss from the ratio time:raw starting weight of ingredients. This equation accounted for 85% of the variability and was used to construct the Figure.
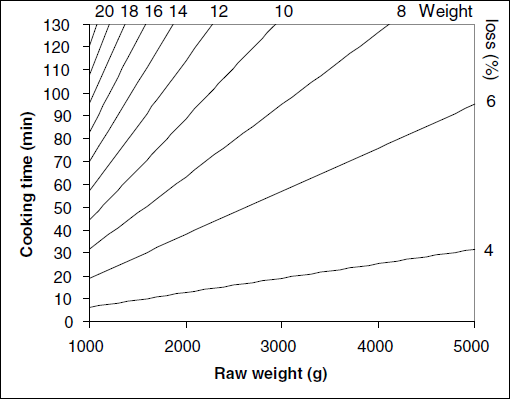
None of the soups showed a loss close to that previously published for lentil soup and a possible explanation may be that a ham bone was included in the recipe but removed after cooking; if this ingredient had been removed before final weighing the ham bone might have been included in the weight loss. The Figure could be used to predict weight loss and hence nutrient analysis from soups with a range of different starting weights and cooking times. Further research is needed to investigate vitamin losses.
