Richard Price is an interesting guy. Spike Lee made one of his books into a movie. He cowrote the fifth season of HBO’s TV series, “The Wire.” He lives in Harlem and he is married to a successful journalist. The guy has been around and has lived a full life.
When he was 65 years old, the New York Times Book Review asked him to name a book that made him furious. (This should be good.) Maybe he will remind us of some epic takedown of killer corporations polluting the land. Or maybe he will open a door to personal insecurities, identifying a book that pushed him to jealous fury.
No, he chose his college stats book, saying it made him “so bored and befuddled every time I opened it that I felt like running into a wall.” This from a man who is 65 years old.
Those who teach stats may be less surprised than others. Statistics sucks—or so students say. Sometimes loudly, and repeatedly. For some, like Richard Price, it may leave a mark still visible decades later.
For those of us who would like to avoid traumatizing the next generations of Richard Prices, we first must recognize three stark facts about students taking statistics classes in social science departments. First, they are scared by math. There is a clip of a Howard Stern show on which Stern asks Donald Trump and hangers-on what 6 times 17 is. Five minutes and much debate later, the answer proved elusive. (Trump’s answer of 112 was, alas, one of the better answers.) Somehow, math freezes brains. Students, not unreasonably, fear the prospect.
Second, students in statistics classes expect to be bored by statistics. It is like being audited. There is a rule for everything and the professor sure seems to get bent out of shape about whether N or N-1 is in the denominator. What kind of person cares about things like that? Probably the same person who knows how to calculate your alternative minimum tax.
Third, students do not always appreciate the usefulness of statistics. While some inhale 538.com, Vox.com, and other statistically minded resources, many are in our classrooms because they did not particularly care for math in high school. It is a virtual certainty that few students, if any, are there because of an abiding love of asymptotic theory. They are in our classrooms because they want to make sense of electoral politics or the economy or discrimination or war and other facets of the world in which we live.
Given these facts, our challenge is to design our courses to make stats less scary, more interesting, and clearly useful. Here are some ideas on how to do this.
APPROACHES TO MAKING STATISTICS INTERESTING AND USEFUL
1. Declutter!
Statistics is actually not that difficult. We worry about randomness, endogeneity, and functional form. There is nuance and complexity in these concepts, but the essence of each is not difficult.
Unfortunately, many statistics classes make things difficult by trying to do too much. Here is a typical (and abridged) table of contents from typical introductory statistics books: joint and conditional probability, binomial distribution, Poisson distribution, discrete and continuous random variables, normal distributions, how to assess normality, confidence intervals, p-values, Wilcoxon signed rank tests, Mann-Whitney tests, paired Wilcoxon signed rank tests, tests for one population and two populations, hypothesis tests, chi-squared distribution, ANOVA (two-way versus block designs), and Kruskal-Wallis tests. This list makes my head spin. Now, imagine if you are new to the material. I think anyone would be forgiven for wanting to crawl into bed and pull up the covers.
A key principle of super-organizer Marie Kondo (Reference Kondo2014) is that we should keep only those things that spark joy. The rest is clutter that is dragging us down. We should have a similar approach to teaching statistics: keep only the things that spark insight. Most research these days is OLS or OLS-based causal inference (i.e., fixed effects, instrumental variables, and regression discontinuity). That is what we should teach.
We should have a similar approach to teaching statistics: keep only the things that spark insight. Most research these days is OLS or OLS-based causal inference (i.e., fixed effects, instrumental variables, and regression discontinuity). That is what we should teach.
Rust (Reference Rust2016) is a wonderful polemic against complacency about the state of empirical work in economics. In particular, he decried the fact that econometricians continue to crank out new estimators without necessarily showing their usefulness.
Our standard should be the same for both teaching and developing statistical tools: show us how a technique helps us to better understand the world. If we cannot come up with an example in which the technique in question helps us see something differently than we would without, we should get a better example or move on.
This is pretty easy when doing OLS—we simply need to find a model in which including an omitted variable flips the coefficient on a variable that was in the model from the beginning. Bailey (Reference Bailey2015) provided examples of real datasets in which this happens. They range from a somewhat contrived but pedagogically useful example of the effect of temperature on sales (we need to control for holiday shopping season!) to examples from academic papers on topics including the effects of ethnic divides on civil war, education on economic growth, and judicial independence and democracy on economic growth.
Showing how results change with time-series tools is fairly easy as well because the correlation of errors often is strong enough that accounting for it can make statistical significance disappear.
For some topics, the payoff is less clear. Accounting for heteroscedasticity does not address bias and, in most applications, does not do much to the standard errors. If we cannot show that heteroscedasticity (or any other statistical technique we are considering teaching) affects our conclusions, then we should spend the time on other topics. As the great statistician George Box (1976, 792) said, we should not “worry about mice when there are tigers about.”
While we all recognize that there are opportunity costs to teaching any tool and that we therefore should focus on tools that have “the most bang for the (tuition) buck,” we all have probably had the experience (as a faculty member or student) of finding barely useful introductory material sticking like a barnacle to an undergraduate statistics syllabus.
In fact, the futility of many statistical examples can be almost sublime. One generally strong textbook (which I decline to name) provides a case study on the number of times that former convicts were rearrested as a function of a series of variables including employment data. The first statistical concept is omitted-variable bias. It turns out that adding a variable to control for the average sentence of the ex-con causes the coefficient on the employment variable to go from (I’m not kidding) 0.104 to 0.103.
Did you hear that thumping sound? It is the sound of dozens of students’ foreheads slamming into their books. Picture a student picking herself back up, rubbing her head, and saying, “OK, that was (literally) painfully dull, but if I work hard, I’ll see the good stuff.” Well, there is more: the R2 goes from 0.0413 to 0.0422. That’s right! All our hard work with the total sum of squared, error sum of squares (or was it estimation sum of squares?), and residual sum of square (or was it regression sum of squares?), and now we see a 0.009 change in R2.
In addition, even if the difference in R2s between the two models was significant, we would sheepishly have to admit to students that R2 does not really tell us much because good models (like many experiments) can have low R2 and bad models (e.g., many time-series models with lagged-dependent variables) can have high R2. Again with the heads thumping on the books.
2. Get to real data…really quickly.
Do something interesting with real data right away. Connecting statistical techniques to real examples has been shown repeatedly to be highly effective (Bernstein and Allen Reference Bernstein and Allen2013; Fisher and Justwan Reference Fisher and Justwan2018; Oldmixon Reference Oldmixon2018).
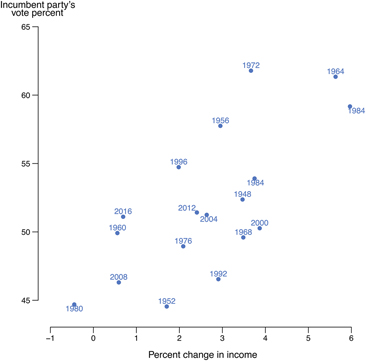
Consider, for example, showing students figure 1 on the first day. It shows the relationship between economic growth and the success of the incumbent party in US presidential elections. The topic is familiar and the data are clear enough that students fairly easily can articulate a basis for characterizing the relationship with something like an OLS line.

Figure 1 Income Growth and the Vote for the Incumbent President’s Party, 1948–2016
Students also can talk about whether this line reflects a “real” relationship or something else (e.g., randomness or spuriousness). If the conversation proceeds in commonsense terms and avoids statistical jargon, it will be accessible to all students, providing a foundation for statistical reasoning. This is an excellent way to introduce the critical concept of controlling for confounding factors.
What constitutes an ideal dataset for any given class depends on instructor and student interests. There is much from which to choose. Bailey (Reference Bailey2015), for example, provides access to dozens of datasets that allow students to explore relationships between crime and poverty, alliances and trade, employment discrimination, support for the Iraq war, the effect of universal pre-kindergarten, the effect of education on economic growth, and home-field advantage in Premier League soccer.
3. Teach theory on a just-in-time basis.
One challenge in teaching statistics is figuring out how to get students to understand foundational theory. An all-too-common approach is to treat the teaching of statistical theory like a warehouse in which we go floor to floor, studying each concept. After we have covered all of the racks of information, we consider students to be prepared to venture outside to take on real data. The problem with warehouses is that they are boring. Things also rot in them. Perhaps most pernicious, it is tempting to fill a big warehouse with junk—stuff that we keep around “just in case.”
Business has moved to just-in-time delivery and perhaps we should as well. Imagine learning the central-limit theorem and then boxing it up for storage. It is an amazing result but, in isolation, it may have trouble competing with the 10 billion things we could be doing on the Internet. The central-limit theorem is more interesting if it is a tool that we need to solve a specific problem, such as trying to characterize whether we are seeing a real effect or simply randomness.
It is an exciting time to be teaching statistics for social scientists. We have more data, better computers, and improved methods. We also have seen stats go mainstream in everything from journalism to policy to campaigns to international development and more.
Again, this is not to say that a full-theory course is not useful. It is only that we should deliver it in the appropriate place: for students directly interested in statistics or for advanced students who understand the logic and utility of statistics and need to deepen their understanding.
Is this dumbing down the class? No, it is teaching material that is appropriate to the task at hand. In social science programs, that task is analyzing data to answer interesting questions. We cannot do this without understanding endogeneity and the ways in which experiments, OLS, panel, instrumental variables, and regression-discontinuity designs help us overcome or, at least, attenuate endogeneity. We do not need to cover the full spectrum of conditional probability or the Lyapunov versus the Lindeberg versions of the Central Limit Theorem—or, heaven forbid, the Peano Axioms.
4. Get to OLS…quickly.
Many conventional first-semester statistics classes careen around a broad descriptive-statistics landscape for most of the term, only to half-heartedly introduce OLS in the last weeks. We should think carefully about whether that approach best serves our students.
On the one hand, there is little doubt that our students should know descriptive statistics. They are foundational for OLS and other statistical tools and are widely used in the press, policy making, business, and beyond. It also is quite natural to teach data visualization and communication skills using descriptive statistics (Rom Reference Rom2015).
On the other hand, we should be careful not to overdo the teaching of descriptive statistics. First, they are particularly prone to clutter, as described previously. Second, students may already know the material. It is common for students to have covered mean, median, and basic plotting multiple times since elementary school.Footnote 1 Sadly, some student populations will have been poorly served by their preparation and they may need to spend more time on descriptive statistics. However, for these students, decluttering is all the more vital to ensure that we provide the skills in a clean, coherent, and useful manner.
Teaching OLS early also provides a good start on more advanced techniques. After all, panel models are OLS models with boatloads of dummy variables. Instrumental-variable models are OLS models, baked twice. Regression-discontinuity models are OLS with clever dummy variables.
Many topics in traditional stats classes can be subsumed into an OLS-based curriculum. For example, difference-of-means tests can be fully incorporated by the OLS model with dummy independent variables. Doing so not only minimizes curriculum clutter and its potential for confusion, it also immediately allows the discussion to be more sophisticated. It is common when assessing the means of two populations to be concerned about omitted variables, balance, or experimental non-compliance—all topics that naturally flow within an OLS framework but which are difficult to incorporate in traditional difference-of-means discussions.
FINAL WORDS
It is an exciting time to be teaching statistics for social scientists. We have more data, better computers, and improved methods. We also have seen stats go mainstream in everything from journalism to policy to campaigns to international development and more.
These trends have led students to increasingly understand that they should learn statistics. They continue to think, however, that statistics are scary and boring, making it difficult for them to learn the skills needed.
This is unfortunate because statistics should be fun. As instructors of statistics, it is our job to make the subject less intimidating, more interesting, and more useful. This always will be an ongoing task, but there are at least four steps that we can take that have too often been missing from traditional approaches to teaching statistics. We can declutter our syllabi to streamline and simplify the material. We can get to data quickly to highlight the relevance and power of the tools we teach. We can prioritize analytical tools over abstract theory to focus on producing insight. And, when appropriate, we can move as quickly as possible to OLS to give students access to a framework that is itself useful and that provides a launching point for many of the statistical tools we use in our research.
SUPPLEMENTARY MATERIAL
To view supplementary material for this article, please visit https://doi.org/10.1017/S1049096518002044