


Research has consistently demonstrated the efficacy of electroconvulsive therapy (ECT) for a variety of psychiatric conditions, ranging from mood disorders such as depression and bipolar disorder, to psychotic disorders such as schizophrenia.Reference Tharyan and Adams1–Reference van Diermen, van den Ameele, Kamperman, Sabbe, Vermeulen and Schrijvers3 Although the benefits of ECT have been demonstrated in multiple studies, understanding the risk associated with ECT has been more elusive. Considerable controversy exists regarding the mortality associated with ECT. Historically, estimates of the mortality rate associated with ECT were derived from a review of the literature that reflected ECT treatment during the 1980s and 1990s.Reference Abrams4–Reference Philibert, Richards, Lynch and Winokur6 However, substantial improvements in ECT practice have occurred since that time, including enhanced anaesthesia practice and the advent of brief-pulse ECT.Reference Watts7,Reference Weiner and Reti8
ECT association with mortality
There have been few contemporary examinations of mortality associated with ECT. Two studies used adverse event reports collected as part of patient safety programmes in hospital systems or patient safety organisations. Watts et al examined adverse event reports associated with ECT in USA Department of Veterans Affairs medical centres between 2000 and 2010, and estimated a mortality rate of 1.4 deaths per 100 000 treatments.Reference Watts, Groft, Bagian and Mills9 Dennis et al examined adverse event reports associated with ECT in Texas, USA, between 1998 and 2013, and estimated a 14-day mortality rate of 2.4 deaths per 100 000 treatments.Reference Dennis, Dennis, Shafer, Weiner and Husain10 A limitation of both of these studies is that they relied on reports of death rather than a systematic collection of mortality data, and did not include a control group. Two record linkage studies used comprehensive national or regional healthcare and mortality data. Østergaard et al found that in Denmark, between 2000 and 2007, six deaths occurred within 1 day of approximately 100 000 ECT treatments.Reference Østergaard, Bolwig and Petrides11 However, a detailed review of these cases found no likely association between the ECT treatments and the deaths. Blumberger et al found that in Ontario, Canada, between 2003 and 2011, there was a mortality rate of 2.4 per 10 000 treatments within 7 days of ECT and 4.8 deaths per 10 000 treatments within 30 days of ECT.Reference Blumberger, Seitz, Herrmann, Kirkham, Ng and Reimer12 That study suggests that mortality risk increased with more treatments in a sequence, in contrast to prior work suggesting that initial ECT treatments carried increased mortality risk.Reference McCall, Reid and Ford13,Reference Mizen, Morton and Scott14 Both record linkage studies used systematically collected mortality data, but neither included a control group. Therefore, it is difficult to fully assess the contribution of ECT to the risk of death with data from these studies. Jørgensen et al found a decreased all-cause mortality over a 1-year period when comparing patients who received ECT with patients with depression who did not receive ECT.Reference Jørgensen, Rozing, Kellner and Osler15 That study, conducted in Denmark, questioned whether the decrease was a result of healthier patients receiving ECT. Finally, two studies compared a pooled or population-level risk with a comparison group. Tørring et al conducted a systematic review of 15 studies involving 766 180 treatments, and found a mortality rate of 2.1 deaths per 100 000 treatments.Reference Tørring, Sanghani, Petrides, Kellner and Østergaard16 They noted that their estimated mortality associated with ECT is lower than the reported mortality associated with general anaesthesia. Most studies included in that review relied on clinicians’ reports of deaths related to ECT. Liang et al examined mortality associated with 828 899 ECT treatments provided in Taiwan between 1998 and 2013.Reference Liang, Chung, Tsai and Chien17 They found that the mortality rate for psychiatric in-patients receiving ECT (1.27%) was lower than that for psychiatric in-patients who did not receive ECT (1.94%). However, that result must be interpreted cautiously, as younger and healthier patients received ECT, and there were no efforts to control for differences in the medical and psychiatric illness between the groups.
Given inconsistencies in the literature, our objective was to use the best methods possible to estimate the mortality associated with ECT, both for all-cause mortality and all-cause mortality excluding suicide deaths. Assessing these categories of mortality helps disaggregate questions of ECT's safety from questions of its efficacy in suicide prevention. Limitations of prior work inform the design of our current study. First, the mortality rate associated with ECT has not been consistently reported over a standard time frame. We believe the most relevant time frames are those closest to ECT treatment. As such, we examine mortality within 7 days, 30 days and 1 year of ECT. Second, there are few recent studies of ECT-related mortality, and older estimates may reflect a period of practice that was less safe. Thus, we estimate mortality associated with ECT from a contemporary sample. Third, many studies relied on adverse event reports, which may result in a systematic undercounting of death. Thus, we rely on centrally collected death records. Fourth, most studies have not included a relevant comparison group and may confuse death from ECT with death naturally occurring as a result of other causes in this high-risk population. Thus, we include a relevant comparison group. Fifth, prior research has not adequately explored mortality associated with ECT early in the index course (first or second treatments) compared with other ECT treatments later in the index course. With these considerations in mind, we explored the relationship between ECT sequence and mortality. Our hope is that a large, well-conducted study will provide improved estimates for shared decision-making about the risks and benefits of ECT.
Method
The authors assert that all procedures contributing to this work comply with the ethical standards of the relevant national and institutional committees on human experimentation and with the Helsinki Declaration of 1975, as revised in 2008. All procedures involving human patients were approved by Veterans Intuitional Review Board of Northern New England (VINNE) in White River Junction, Vermont, USA (approval number 1506188-5). We were granted a waiver of informed consent to conduct a large retrospective study.
Study population
The USA Department of Veterans Affairs provides comprehensive medical services, including mental health services to USA military veterans through a national network of hospitals and clinics operated by the Department. The Department of Veterans Affairs operates more than 1200 sites of care and clinics nationwide, including 170 hospitals, that provide care to approximately 9 million patients per year.
We identified Department of Veterans Affairs patients who received ECT during 2000–2017 from electronic medical records (EMR), using current procedural terminology (CPT) codes. Because of the risk of miscoding, a prior study that used Department of Veterans Affairs data excluded all patients receiving only one ECT procedural code.Reference Pfeiffer, Valenstein, Hoggatt, Ganoczy, Maixner and Miller18 Therefore, when individuals in our sample had only one ECT procedure documented in their EMR history, we sought confirmation for the purported procedure through a review of clinical notes in the EMR. We applied the following confirmatory words to screen for true instances of ECT: ʻECT', ʻ(ECT)' and ʻelectroconvulsive'. Our text search strategy had a high level of agreement with the psychiatrist's review of the medical record. The procedure most commonly miscoded as a single ECT treatment was electrocardioversion. Of 125 549 unique ECT procedures identified between 1 January 2000 and 1 January 2017, 3316 were the only ECT procedure for that patient during that time period. Of these, 2029 were removed because of a lack of clinical notes (there was a single billing code for ECT but no clinical notes indicating that ECT occurred). An additional 41 ECT procedures were dropped from the analysis because their dates were after a purported date of death; this left an analysis sample of 123 479 ECT treatments (see Supplementary Appendix 1 available at https://doi.org/10.1192/bjp.2021.63).
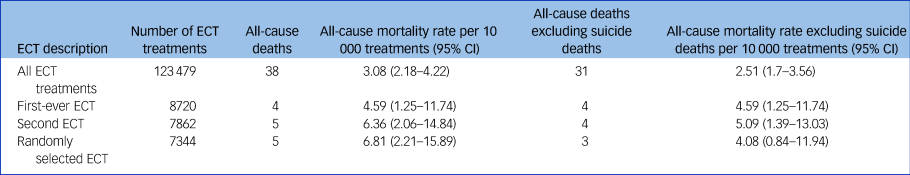
Our overall sample for analysis was 123 479 ECT treatments. These treatments were provided to 8720 unique patients. We considered 7-day mortality after ECT treatment in multiple ways (Table 1). The broadest measure included all valid ECT procedures across all years (123 479 ECT procedures). In this measure, each ECT was considered a unique risk event, and thus patients contributed to the rate denominator each time they received ECT. We also considered the 7-day mortality after a patient's first-ever ECT. For this assessment, patients contributed to the denominator only once, at the time of their first ECT. This measure included 8720 patients. Given that patients who receive a first ECT may be different from those who tolerate more than one procedure or seek additional ECT treatment, we also assessed 7-day mortality after a second-ever ECT and a randomly selected ECT. In both of these measures, patients contributed to the denominator only once. The denominator of patients receiving a second-ever ECT (n = 7862) is lower than that of patients who received at least one ECT, because some patients did not seek additional treatment after their first ECT. The same is true of the patients with a randomly selected ECT (n = 7344), as a random ECT was selected among those with three or more ECT procedures. For each measure, risk of mortality was assessed starting on the day of the ECT procedure and over the subsequent 7 days. For this analysis, deaths could be associated with a single ECT or several treatments occurring in the 7 days before a death. In this way, deaths were overcounted for this analysis.
Table 1 Mortality in the 7 days after electroconvulsive therapy treatment
In addition to considering ECT as an individual event, we also grouped ECT treatments into index courses. This allowed us to assess the risk of specific treatments as well as a course of ECT, which is the typical use of ECT. As EMR did not contain complete information about whether an ECT treatment was part of an index, continuation or maintenance ECT, we operationally defined an index course as receipt of at least five ECT treatments within 15 consecutive days. We considered additional ECT treatments part of the index course until there was a gap of 8 or more days between treatments.Reference Gill and Kellner19 Applying this definition yielded 5157 unique initial index courses of ECT across all patients and study years in our data. We elected not to consider subsequent course of ECT to avoid issues with survivor bias, and to avoid the issue of separating ECT courses. We assessed mortality after these initial index courses (n = 5157). In this group, 7-day mortality assessment began on the day of first ECT treatment in the index course, and continued for 7 days after the final treatment in the course.
In addition to unadjusted assessment of mortality after ECT, we also sought to assess adjusted post-procedure mortality among the population of patients who received a first-ever index course of ECT, compared with a risk-matched population of other mental health patients. For the purpose of a risk-matched analysis, we identified a control population from all acute mental health in-patient discharges who did not receive an ECT during 2000–2017. We selected in-patient mental health stays as a control population because, like ECT, it allowed for a specific event, mental health discharge, to begin the observation period. Although controls were obtained from the in-patient setting only, to allow for an adequate pool of cases, individuals with first-ever index ECT courses were included regardless of clinical setting. We identified acute in-patient controls from EMR treatment specialty data, and excluded individuals whose acute stay occurred for a primary substance use disorder diagnosis. If an individual had more than one in-patient stay in the time period, we only retained their first discharge for matched analysis. Our selection criteria yielded a pool of potential controls of 486 214 individuals with first-ever acute in-patient discharges, and no evidence of ECT receipt before or after in-patient discharge. Mortality assessment began on the day of in-patient discharge for the control population, and on day of the first ECT treatment of an index course among the ECT population. Unlike the crude mortality assessment (Table 1), this analysis assessed mortality at 30 days and 1 year. These time periods were selected because they represented short-term risk periods, but were long enough to allow for capture of a sufficient number of mortality events on which to perform adjusted logistic analysis. In general, adjusted logistic regression requires more than ten events for each covariate included in the model.Reference Vittinghoff and McCulloch20 Thus, 7-day mortality analysis was prohibitive for adjusted assessment. The longer observation periods also lessened the effect of counting deaths both during and after the ECT course, but only after in-patient discharge.
Measures
We obtained demographic, clinical, pharmacy and health service use data from the EMR, and mortality data from the Department of Veterans Affairs Mortality Data Repository, a comprehensive database that includes death and cause of death information for all Department of Veterans Affairs patients.Reference Katz, McCarthy, Ignacio and Kemp21
For all matched individuals (ECT and controls), we extracted demographic, clinical, pharmacological and service use variables from the EMR. We assessed time-varying demographic factors, such as region of residence and age, from the start of each calendar year. We assessed gender and race based on the most common values observed for each person across all years. We assessed all diagnostic and pharmacological variables for the 1 year before the final day of an index ECT course or, in the case of the control population, the date of in-patient discharge. In addition to binary indicators identifying the presence of a diagnosis, we calculated a Charlson comorbidity index score to summarise severity of medical diagnoses in the year before ECT course or in-patient discharge. Reference Quan, Li, Couris, Fushimi, Graham and Hider22 For all patients, we assessed the number of medical in-patient discharges and the number of emergency use visits for the 1 year before ECT index course or in-patient discharge. For each type of service use, individuals were characterised as having any use or high use (two or more visits).
Analysis
To provide a baseline assessment of ECT safety, we calculated all-cause mortality and all-cause mortality excluding suicide deaths for the 7 days after a first-ever ECT, a second ECT in a course, a random ECT selected from a course and any ECT treatment regardless of sequence order. Assessment of mortality started on the day of the ECT procedure and continued for the next 7 days. Because ECT is typically delivered in a series or index course, we also calculated the mortality associated with an entire index course of ECT. Among individuals with an index course, mortality assessment began on the first day of ECT receipt during the course, and ended 7 days after the last treatment in the course. All rates were expressed per 10 000 population.
After assessment of all-cause mortality rates and all-cause mortality rates excluding suicide deaths, we compared those mortality rates among individuals with an index course of ECT with those of a risk-matched population of individuals who did not receive ECT. We calculated descriptive statistics to assess the baseline differences between the case and control populations. We supplemented counts with percentages and means with s.d., with measures of relative risk and Cohen's d statistics to demonstrate the magnitude of differences between cases and controls. To statistically compare between-group differences, we conducted bivariate analyses, using a χ 2-test for categorical measures and a Student's t-test for continuous measures.
To account for between-group differences that would otherwise confound assessment of mortality risk, we used propensity score matching, a technique used to select a control population.Reference Duhamel, Labreuche, Gronnier and Mariette23 For this analysis, we matched cases and controls based on characteristics that predicted that they would receive an index course of ECT. We specified variables identified as the strongest predictors in both the logistic and bivariate analysis as requiring an exact match in the propensity score model. Other variables identified as predictive of receipt of an ECT course also contributed to the overall propensity score. The result of this model was then used to match each case with up to two controls based on the nearest neighbour technique. Once matched, controls were not replaced (only one permitted match was allowed per control). The maximum permitted propensity score difference between matched individuals was specified as 0.25. Of 5157 possible cases and 486 214 possible controls, 5097 cases and 10 097 controls were able to match based on the specifications of our model; 98.1% of matched cases resulted in two control matches.
After propensity score matching, we used bivariate analyses and assessment of standardised differences of means to test for balance between the characteristics of the treatment and control groups. Additionally, we used the Student's t-test for difference in means, and a Kolmogorov–Smirnov two-sample test for difference in distribution, to compare propensity scores between the ECT and control groups in the final matched sample (see Supplementary Appendix 1 for details).
In the final matched population, we used a logistic regression to assess the crude and adjusted odds of 30-day and 1-year all-cause mortality and all-cause mortality excluding suicide deaths among individuals who received an index ECT course, compared with the matched sample of individuals. Adjusted analysis considered all diagnostic, pharmacological, service use and demographic variables provided in Table 2, except for the outcome variables (mortality) and variables on which the cohort had been matched with the exact method. We selected a final adjusted model with stepwise selection. In crude and adjusted models, we exponentiated beta-estimates for the ECT variable to produce odds ratios and corresponding 95% confidence intervals of mortality risk among those who received an ECT course, relative to the control group. We performed data management and statistical analyses with SAS Enterprise Guide version 7.1 for Windows (SAS Institute, North Carolina, USA).
Table 2 Demographic, clinical, prescription and service use characteristics among individuals with an index ECT course and mental health controls during 2000–2017, before and after propensity score matching
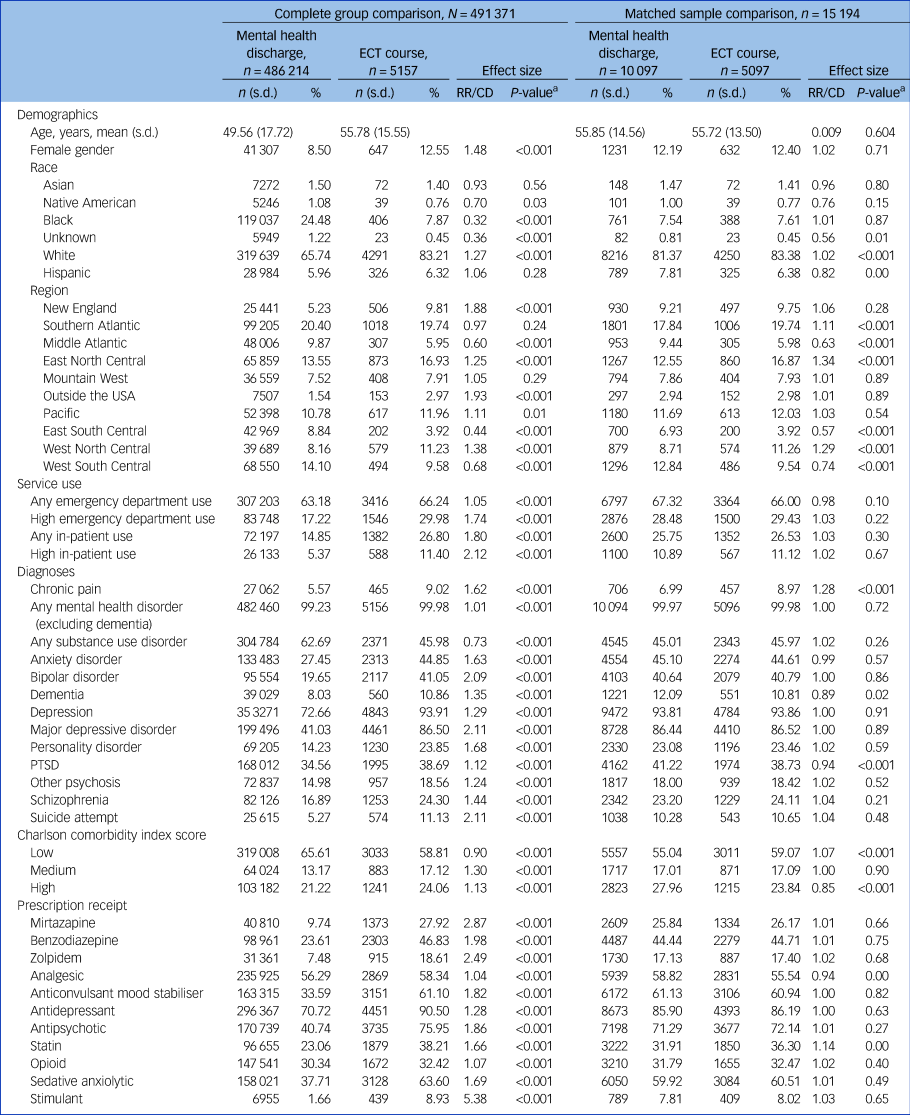
High in-patient or emergency department use is defined as two or more visits in a calendar year. A Charlson comorbidity index score of ≤2 is low, 3 or 4 is moderate and ≥5 is high. ECT, electroconvulsive therapy; RR/CD, Relative Risk/Cohen's D; PTSD, post-traumatic stress disorder.
a. P-values are derived from χ 2-test for categorical variables, and Student's t-test for continuous variables.
Results
Our sample included 123 479 individual ECT treatments provided to 8720 patients (including 5157 initial index courses of ECT) delivered by the Department of Veterans Affairs health services between 2000 and 2017. During the same time period, there were 486 214 in-patient mental health discharges, which served as potential controls. The sample characteristics are described in Table 2. Overall, the sample for both groups was predominantly middle-aged White men with significant mental health comorbidities.
We first sought to determine the crude mortality rate after ECT treatment. For this analysis, we considered the possibility that particular ECT treatments in a sequence could be associated with a differing risk of mortality. We considered mortality after the first treatment, second treatment and randomly selected treatment in a sequence, and all treatments pooled.
Overall, the variation in rate of death for various ECTs in a course was minimal (Table 1), and was estimated at 3.08 deaths per 10 000 ECT treatments. We saw no indication that a particular ECT in a sequence or course carried an increased risk of death. We also calculated a raw mortality rate for deaths associated with each index course of ECT. For this analysis, only the patient's first index course was included and as such, each death was only associated with one index course. For the 5157 index ECT courses, there were ten deaths from any cause, including six deaths from any cause excluding suicide within 7 days of completing an ECT course. No deaths occurred on the day of ECT.
To control for the base rate of death in a population, we compared patients who received a course of ECT with patients who were discharged from a mental health unit and did not receive ECT (Table 2, Complete group comparison). Before matching, the two populations differed significantly in virtually every characteristic that we examined. This is consistent with prior research that demonstrates that Department of Veterans Affairs patients receiving ECT are quite different than other patients receiving mental health treatment.Reference Peltzman, Gottlieb, Shiner, Riblet and Watts24,Reference Wilkinson and Rosenheck25 After matching based on propensity to receive ECT, the two samples were much more comparable (Table 2, Matched sample comparison). Although we hoped to evaluate 7-day mortality, the number of deaths within 7 days of an ECT course was too low, and so we examined 30-day and 1-year mortality.
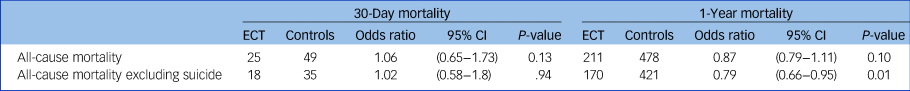
As our primary goal was to understand the medical risk associated with ECT, we considered both all-cause and non-suicide mortality. In the regression model, there were no difference in all-cause mortality at 30 days or 1 year. The ECT group had a lower risk of non-suicide mortality at 1 year (odds ratio 0.79, 95% CI 0.66–0.95), but not at 30 days (Table 3). For the ECT group, the most common causes of death were cardiovascular (31%), cancer or malignancy (29%), suicide (19%), infection (12%), accident (6%) and other causes (4%).
Table 3 Results of logistics regression of odd ratios of mortality, comparing index electroconvulsive therapy (ECT) courses and a matched group of patients discharged from mental health units
Discussion
We evaluated the risk of death in the period after ECT treatment. Our estimates suggest a 7-day all-cause mortality of about 3.08 per 10 000 treatments, which is consistent with widely cited rates in the literature. We found no evidence that particular treatments in a sequence were at greater risk for death. Rather than attempting to link specific deaths with an ECT treatment, we included all deaths, including those that were not plausibly linked to ECT. Instead, we attempted to understand the possible contribution of ECT to the mortality through comparing the mortality in a matched group of mental health patients who never received ECT with a group who received an index ECT course. In this comparison, patients who received ECT tended to have a lower risk of all-cause mortality and, when considering non-suicide deaths, the difference was relatively large and statistically significant, with a 20% decrease in relative risk of death. This suggests that patients receiving ECT face no greater risk of death than if they had elected not to have ECT, and the risk of death from causes other than suicide may be reduced by as much as 20%.
Our findings involving the all-cause mortality rate shortly after ECT of 3.08 deaths per 10 000 treatments was similar to the rate found by Blumberger et al, who employed similar methods in a Canadian sample.Reference Blumberger, Seitz, Herrmann, Kirkham, Ng and Reimer12 The estimates from both our study and the Canadian sample are approximately ten times higher than most other published rates. It is important to put these estimates in context. The all-cause mortality method reported in our study, using national death index data, results in the highest estimate of deaths as it associates all deaths indirectly with ECT. The reality is that none of these deaths may have been related to ECT. Most other methods attempt to link specific deaths with the ECT treatment. These methods undoubtably underreport deaths. Therefore, it is likely that the true rate falls somewhere in between these two methods of estimating ECT-related mortality. The critical question, however, is how does the risk of death after ECT compare with the risk of death in similar patients who do not receive ECT? We think that our study yields an important and somewhat surprising finding: namely, that fewer patients who received ECT died when compared with similar patients who did not receive ECT. This suggests that ECT may decrease the risk of death, especially from medical causes, in the year after treatment. This is consistent with a similar finding by Liang et al,Reference Liang, Chung, Tsai and Chien17 who hypothesised that the decreased mortality was a result of ECT being used in medically healthier patients. In our study, we matched patients on medical and psychiatric severity, and therefore it is unlikely that the result occurred as a result of ECT being used only in medically healthy patients. This is also consistent with two prior studies in Denmark that examined ECT treatments delivered in Denmark between 1976 and 2000, and between 2005 and 2015.Reference Munk-Olsen, Laursen, Videbech, Mortensen and Rosenberg5,Reference Jørgensen, Rozing, Kellner and Osler15 Those studies found a 20% reduction in deaths from medical causes, as we found in our study. These studies combined suggest that patients considering ECT may have a substantially lower risk of death in the year after ECT than if they elect not to receive ECT.
The mechanism of the decreased risk of death is largely beyond the scope of this study. The most obvious link is the strong effect of ECT on depression, and the well-established relationship between depression and death. Reference Shi, Liu, Liang, Hu and Yang26–Reference Zivin, Yosef, Miller, Valenstein, Duffy and Kales28 Although the relationship between depression and increased mortality is strongly supported by the literature, there has been little clear evidence that treatment of depression decreases that risk.Reference Glassman, O'Connor, Califf, Swedberg, Schwartz and Bigger29 Notably, research has long suggested that ECT can decrease the mortality associated with depression even when other depression treatments have not.Reference Philibert, Richards, Lynch and Winokur6,Reference Avery and Winokur30 Emerging research has found potential effects of ECT on endothelial growth factors that could also plausibly explain the decrease in mortality.Reference Kranaster, Blennow, Zetterberg and Sartorius31
Our work comes with limitations. The population was largely male and was exclusively military veterans. This limitation reflects the broader issues regarding whether the population is representative of other populations who receive ECT. We also lacked detailed information regarding the specific of the ECT treatments. It is possible these factors could change our interpretation. We also cannot rule out the possibility that our matching process was not fully effective. Although our propensity score matching process was robust, it is challenging to match patients, especially when considering short-term risk. Furthermore, we did not match geographically, and so patients receiving ECT and their control patient matches may not have received treatment at the same hospitals. It is therefore possible that ECT was a marker of better hospitals, rather than a cause of decreased mortality.
This study supports the idea that ECT is a safe procedure overall. Our results suggest that patients who receive ECT may have a lower risk of death from causes other than suicide than if they choose not to receive ECT.
Supplementary material
To view supplementary material for this article, please visit https://doi.org/10.1192/bjp.2021.63
Data availability
All data used for this manuscript are maintained within the VA Informatics and Computing Infrastructure (VINCI). As the data-set includes protected health information, direct access to the data is not allowed, except through the Department of Veterans Affairs data policy. Contact the corresponding author, B.V.W., to access this data through the Department of Veterans Affairs data-use agreements.
Author contributions
Each author made a substantial contribution to the manuscript and approved the final submitted version. B.V.W. played a lead role in conceptualising project and study design, assisted with data interpretation and took a lead role in drafting and revising the manuscript. T.P. assisted with data acquisition, took a leading role in all analysis and data management, and assisted in drafting the manuscript, with a focus on the Method section. B.S. assisted with conceptualisation of the project, led the data acquisition and interpretation of analytic output, and assisted drafting and editing the manuscript.
Funding
This project received funding from the VA National Center for Patient Safety, Patient Safety Center of Inquiry grant number: PSCI-WRJ-SHINER (Principal Investigator B.S.).
Declaration of interest
None.


eLetters
No eLetters have been published for this article.