

Introduction
The scale and population impact of Family Planning Policies (FPP) in China have been widely documented in the demographic and social science literature ever since family planning was introduced (Tien, Reference Tien1980, Reference Tien1984; Bongaarts & Greenhalgh, Reference Bongaarts and Greenhalgh1985; Greenhalgh, Reference Greenhalgh1986, Reference Greenhalgh2003; Hardee & Banister, Reference Hardee and Banister1988; Liang & Lee, Reference Liang and Lee2006; Zeng, Reference Zeng2007; NPFPC, 2007; Zhai & Li, Reference Zhai and Li2014). Although typically referred to as the One-Child policy elsewhere, in reality family planning policies in China have been implemented in various phases differentially across various sub-populations based on socioeconomic, geographic and population criteria. There has been little demographic analysis that has systematically disentangled how FPP, implemented over time and differentially across sub-populations, have contributed to sustained fertility reduction in China. The analysis of sub-populations characterized by very different socioeconomic conditions is critically important to ascertaining the impact of FPP on fertility behaviours, and in particular to understanding how the recent structural changes – reflected in rapid social and economic development – have mediated the influence of FPP in triggering fertility change over time and place.
This study integrated cross-sectional birth history data from successive rounds of nationally representative population and family planning surveys, from the early 1970s until mid-2000s, to evaluate the underlying influence of FPP on fertility change in China, including the post-transitional period. The study further sought to decompose the contribution of Parity Progression Ratios (PPRs) to total fertility change among different sub-populations subject to differential FPP over time and characterized by different socioeconomic attributes. Two inter-related research questions were addressed. First, how did FPP evolve across different sub-populations and over time in China? Second, how did the differential FPP, implemented across different sub-populations, contribute to overall fertility reduction in China? The study aimed to provide a more in-depth understanding of how FPP have contributed towards the triggering of fertility transition among different sub-populations in China, and to unpack the role of the FPP in the face of rapid economic and social development.
Three phases of Family Planning Policies and fertility transition in China
In the early 1950s the attitude of the Chinese government was actively pro-natalist, encouraging births. The results of the first census in 1953 delivered a surprise, showing the population to be larger than anticipated, and stimulating the government to re-think its attitude to population issues. During the late 1950s and 1960s, efforts were increasingly focused on disseminating the ideal of a small family size and reinforcing availability of contraceptive supplies, with efforts being primarily concentrated in urban areas. From the 1970s onwards, a range of intensive FPP were formulated to reduce population growth (Wang, Reference Wang2012). These policies varied in their nature and mode of implementation across time and social context, and can broadly be divided into three key phases.
The first phase was the Later, Longer, Fewer policy (1973–1979), also known as wan, xi, shao policy, which emphasized delayed marriage, long intervals between births and fewer births overall. Age at first marriage was encouraged to be at least 23 years for females and 25 years for males. Women were encouraged to give birth at age 24 or older. An interval of at least 3 years between births was recommended and the total number of children recommended per couple was no more than two. This was followed by the One-Child policy (1979–1984). In 1979, recognizing rapid population growth was putting considerable strain on socioeconomic development and considering birth control to be an essential prerequisite for sustainable development, China began to promote the ‘one couple, one-child’ policy, which became the most controversial family planning programme in the entire human history (Greenhalgh, Reference Greenhalgh2003). Four years of strict implementation of the draconian policy caused considerable dissent, especially in rural areas, leading to the third phase of Differentiated family planning policies (1984 onwards).
In 1984, the Communist Party of China (CPC) Central Committee and the State Family Planning Commission issued Central Document 7, which allowed a second birth for rural couples with ‘practical difficulties’, as long as the couples adhered to regulations outlined in the local plan. This document led to divergence in policy implementation across provinces. From the mid-1980s, the provinces (autonomous regions and municipalities) under the CPC Central Committee and the State Council were empowered to assess local socioeconomic conditions and develop context-specific population and family planning regulations.
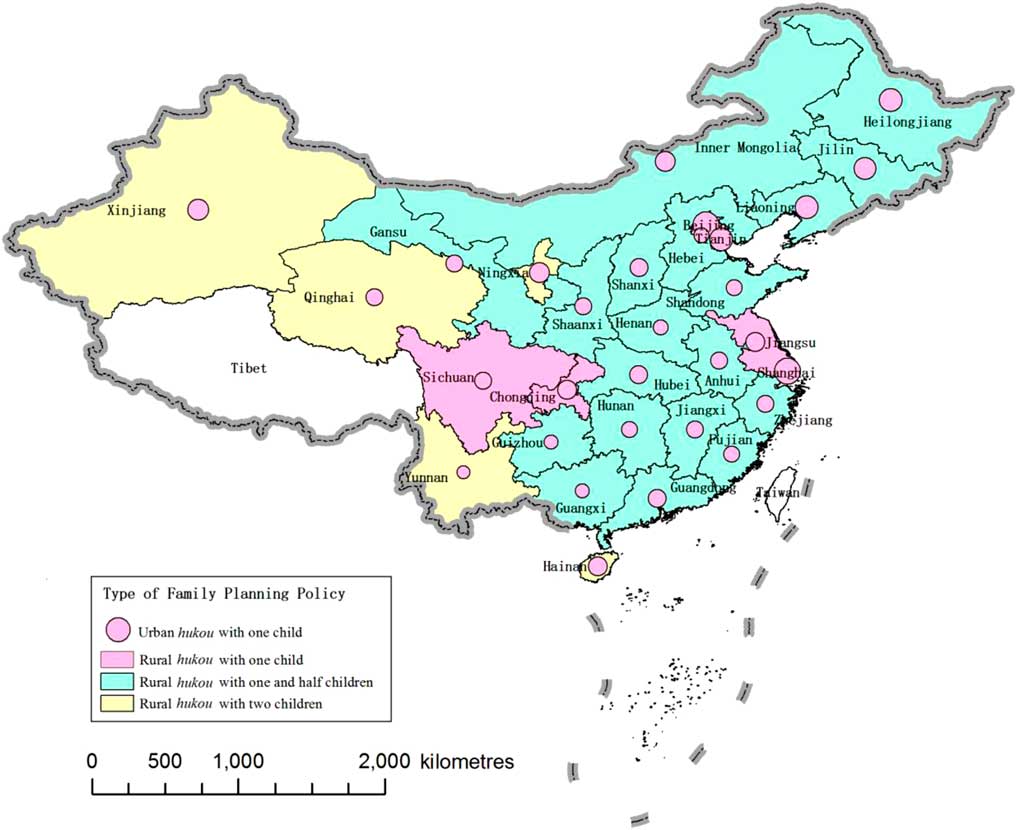
The Differentiated policies can be broadly sub-divided into four types based on the number of children allowed per couple: ‘one-child’, ‘one and a half children’, ‘two children’ and ‘three children’ policies (Greenhalgh, Reference Greenhalgh2003; Gu et al., Reference Gu, Wang, Guo and Zhang2007; NPFPC, 2007). The central features of each policy, along with the provinces covered and associated population coverage, are listed in Table 1 and illustrated geographically in Fig. 1. In November 2013, the new leadership of the Chinese Communist Party announced a ‘softening’ of the strict family planning policy: families were allowed two children if one of the parents was an only child. In October 2015, the government announced it would further relax the rules to allow all couples to have two children, signalling a new era in China’s FPP.
Map of China illustrating different types of family planning policy by geographic area.
Description of the main types of Differentiated FPP
Fertility in China was high in the 1950s and 1960s with a total fertility rate (TFR) of about 6 children per woman. From 1970 onwards, fertility declined rapidly to an average of about 2.7 children per woman in 1980 and it fell further below replacement level in 1990 with 2.0 children per woman (Peng & Guo, Reference Peng and Guo2000). There is a general consensus from the literature that although rapid socioeconomic development across different regions contributed to boosting fertility transition in China, this was largely due to the Later, Longer, Fewer policy and the subsequent more strict FPP implemented by the Chinese government (Tien, Reference Tien1984; Bongaarts & Greenhalgh, Reference Bongaarts and Greenhalgh1985; Wolf, Reference Wolf1986; Feeney & Yu, Reference Feeney and Yu1987; Poston & Gu, Reference Poston and Gu1987; Yang & Chen, Reference Yang and Chen2004; Retherford et al., Reference Retherford, Choe, Chen, Li and Cui2005; Chen et al., Reference Chen, Retherford, Choe, Li and Hu2009). There is also, however, evidence to suggest that the onset of fertility transition and the recent trend towards very low fertility in China have both been driven by socioeconomic development. Birdsall and Jamison (Reference Birdsall and Jamison1983) argued that China’s fertility decline was correlated with income growth, even before the One-Child policy was implemented. Similarly, Lavely and Freedman (Reference Lavely and Freedman1990) reported that urban fertility in China began to fall before the commencement of the strict family planning programme, attributed primarily to high contraceptive use among better educated and urban elites. More recently, Cai (Reference Cai2010) demonstrated that the current below-replacement fertility in Jiangsu and Zhejiang Province is a response to rapid social and economic development. Thus the relative role of policy versus socioeconomic development remains somewhat contested.
Using birth history data from a series of cross-sectional population and family planning surveys, this study examined these issues and presents more systematic and refined evidence of the impact of FPP on sub-populations across time and space, applying decomposition techniques to understand the contribution of changes in Parity Progression Ratios to overall fertility decline in China.
Methods
Data
This paper used data drawn from six consecutive National Population and Family Planning cross-sectional surveys conducted in 1982, 1988, 1992, 1997, 2001 and 2006 by the former State Family Planning Commission of China. The main purpose of the series of surveys was to document fertility, contraceptive use and other reproductive health issues of the population. Retrospective birth history information was available for all births in five of the six surveys; with the exception of the 1992 survey, which recorded birth histories of only last four children. These surveys were designed to be nationally representative, except for the exclusion of Tibet in 1982 and 2006 surveys. For the purposes of this study, Tibet was excluded from the analysis and the 1992 survey was not considered in the calculation of parity-based fertility measures. A systematic assessment of the data indicated generally good quality and consistent records of marriage and birth history information (Coale, Reference Coale1984; Qin, Reference Qin2016). Further information about the surveys and data quality has been reported in several academic studies (Coale & Chen, Reference Coale and Chen1987; Feeney & Yu, Reference Feeney and Yu1987; Feeney & Wang, Reference Feeney and Wang1993; Feeney & Yuan, Reference Feeney and Yuan1994; Zhang & Zhao, Reference Zhang and Zhao2006; Morgan et al., Reference Morgan, Guo and Hayford2009), although the present study is the first to use data from all six.
Data from the 1982, 1992, 1997, 2001 and 2006 surveys were self-weighting. The dataset from the 1988 survey provided sample weights based on the sampling fraction of each province. Comparing the outcome of TFRppr (Total Fertility Rates based on the Parity Progression Ratios) calculated from un-weighted and weighted data, the discrepancies of TFRppr in most years from 1977 to 1987 were all less than 2%. Given that the influence of sample weights was trivial, this paper reports calculations based on un-weighted data. Data on rural–urban residence and province were used to construct a typology to classify individuals in various sub-populations exposed to different FFP.
Sub-population I included urban residents nationwide; sub-population II included rural residents in six provinces (Beijing, Tianjin, Shanghai, Jiangsu, Sichuan and Chongqing); sub-population III included rural residents in nineteen provinces (Hebei, Shanxi, Inner Mongolia, Liaoning, Jilin, Heilongjiang, Zhejiang, Anhui, Fujian, Jiangxi, Shandong, Henan, Hubei, Hunan, Guangdong, Guangxi, Guizhou, Shaanxi and Gansu); and sub-population IV included rural residents in five provinces (Hainan, Yunnan, Qinghai, Ningxia and Xinjiang). This classification was motivated by the main types of Differentiated FPP implemented from 1984 onwards listed in Table 1. Although sub-populations I and II were regulated by the One-Child policy, it is important to differentiate between these two because of the substantial differences between the rural and urban context in China. It should be noted that even though, before 1984, the Later, Longer, Fewer and One-Child FPP were theoretically applied nationwide without differentiating sub-populations, compliance with the policies and subsequent fertility behaviour varied considerably among different population groups (Merli & Herber, Reference Merli and Herbert2002). Therefore the same sub-population classification through the whole study period (1971–2005) was adopted to examine the differential impact of FPP on fertility. In general, the socioeconomic conditions of sub-populations I, II, III, and IV can be ranked sequentially. Sub-population I represented areas with relatively better socioeconomic circumstances, with the lowest levels of illiteracy and the highest household income, whilst sub-population IV represented the poorest in terms of education and household income. Sub-population IV also had the highest representation of non-Han ethnicity. Tables 2, 3 and 4 show the distribution of non-Han ethnicity, illiteracy and household income among the different sub-populations based on data from the surveys held from 1982 to 2006.
Percentage of non-Han ethnic women aged 15–49 years by sub-population, 1982–2006
Calculations based on data from 1982, 1988, 1992, 1997, 2001 and 2006 surveys.
Percentage of women aged 15–49 by level of education and sub-population, 1982–2006
Calculations based on data from 1982, 1988, 1992, 1997, 2001 and 2006 surveys.
Mean annual household income (renminbi, yuan) by sub-population, 1982–2006

Estimated from National Bureau of Statistics (2010).
Analysis
Full birth history data were used to calculate Total Fertility Rates from Parity Progression Ratios (TFRppr) based on the methods proposed by Feeney & Yu (Reference Feeney and Yu1987), Ni Bhrolcháin (Reference Ni Bhrolcháin1987) and Hinde (Reference Hinde1998). To obtain fertility rates up to the year of each survey, a synthetic parity cohort approach was considered. Although Age-Specific Fertility Rates (ASFRs) are widely used, period parity progression based measures of fertility are better suited for examining the policy influence on fertility behaviour. This is because family planning policies in China have always had a clear focus on parity and birth spacing (Feeney & Yu, Reference Feeney and Yu1987). For each survey, the Parity Progression Ratio (PPR) was estimated as the proportion of women who had had an additional birth within 10 years. The assumption was made that women who had not had a (j+1)th parity within 10 years of their j th parity were unlikely to progress to next parity. Parity Progression Ratios up to the 9th birth order for the 1982 and 1988 surveys and up to the 4th birth order for 1997, 2001 and 2006 surveys were examined. The records were truncated at a woman’s 49th birthday at the time of survey. Women’s marriage age was truncated at age 30, because first marriages after age 30 were rare. According to 1982 Population Census and 2005 Population Survey conducted by the National Bureau of Statistics, the proportion of women unmarried for the age group 30–34 was around 1% in 1982, and over 2% in 2005 (Lu & Zhai, Reference Lu and Zhai2009). Therefore the potential contribution of marriage beyond age 30 on TFR was not expected to be large. In the analysis, multiple births were re-coded as second or later birth.
For the calculation of PPRs, first a series of proportions were estimated (q x ) for woman who had their j th birth in the x th year before the particular year and had their (j+1)th birth in the particular year, where x ranged from 0 to 10.
 $$q_{x} \,{\equals} \,{{\matrix{ {\displaystyle{\rm number}\,{\rm of}\,{\rm women}\,{\rm who}\,{\rm had}\,{\rm their}\,j{\rm th}\,{\rm birth}\,{\rm in}\,{\rm the}\,x{\rm th}\,{\rm year}\,{\rm before}\,{\rm the}\,{\rm current}\,{\rm year} } \atop {\displaystyle{\rm and}\,{\rm had}\,{\rm their}\left( {j{\plus}1} \right){\rm th}\,{\rm birth}\,{\rm in}\,{\rm the}\,{\rm current}\,{\rm year}} \cr } } \over {\matrix{ {\displaystyle{\rm total}\,{\rm number}\,{\rm of}\,{\rm women}\,{\rm who}\,{\rm had}\,{\rm a} \,j{\rm th}\,{\rm birth}\,{\rm in}\,{\rm the}\,x{\rm th}\,{\rm year}\,{\rm before}\,{\rm the}\,{\rm current}\,{\rm year}{\minus}{\rm number}\,{\rm of}\,} \atop {\displaystyle{\rm these}\,{\rm women}\,{\rm who}\,{\rm have}\,{\rm already}\,{\rm had}\,{\rm their}\,\left( {j{\plus}1} \right){\rm th}\,{\rm birth}\,{\rm before}\,{\rm the}\,{\rm start}\,{\rm of}\,{\rm the}\,{\rm current}\,{\rm year}} \cr } }}$$
The PPR (p j ) based on the (j+1)th births occurring in a particular year to women who had their j th births in a range of 0–10 previous years was calculated as:
 $$p_{j} {\equals}1{\minus}\left\{ {\left( {1{\minus}q_{0} } \right){\times}\left( {1{\minus}q_{1} } \right){\times}\left( {1{\minus}q_{2} } \right){\times}...} \right\}$$
The PPR from birth to first marriage was calculated in a similar way. For any given year, let p
M denote the period ratio for progression from birth to first marriage, p
0 the period ratio for progression from first marriage to first birth and $p_{{j }}^{'} $
the period ratio for progression from j
th to (j+1)th birth, j=1, 2, .... The statistics p
0, p
1, p
2, ... were period PPRs and TFRppr, an index of total fertility, was calculated as:
$p_{{j }}^{'} $
the period ratio for progression from j
th to (j+1)th birth, j=1, 2, .... The statistics p
0, p
1, p
2, ... were period PPRs and TFRppr, an index of total fertility, was calculated as:
 $${\rm TFR}_{{{\rm ppr}}} {\equals}p_{{\rm M}} {\times}p_{0} {\plus}p_{{\rm M}} {\times}p_{0} {\times}p_{1} {\plus}p_{{\rm M}} {\times}p_{0} {\times}p_{1} {\times}p_{2} ...$$
Using the survey year and the retrospective birth history data, TFRppr was then calculated for each sub-population, as well as for the whole nation.
In order to examine the contribution of marriage and each successive PPR on fertility change ∆TFRppr, ∆TFRppr was decomposed following the principles outlined by Ogawa and Retherford (Reference Ogawa and Retherford1993). For any given time period year A to year B, to calculate the contribution of marriage progression ∆p M to ∆TFRppr , first a standardized value called TFRppr(M) was calculated using the year B value of p M but the year A values of the remaining PPRs. The contribution of ∆p M to ∆TFRppr was TFRppr(M)–TFRppr(year A).
To calculate the additional contribution of ∆p 0 to ∆TFRppr, again a standardized value of TFRppr(M,0) was calculated using the year B value of p M and p 0 and the year A values of the remaining PPRs. The additional contribution of ∆p 0 to ∆TFRppr was TFRppr(M,0)–TFRppr(M). Following the same method, the contributions from ∆p 1, ∆p 2, ∆p 3, ∆p 4 and so on were calculated. The last contribution added to ∆TFRppr was calculated as the difference between TFRppr (year B) and TFRppr (year A).
Survey data for 1982, 1988, 1997, 2001 and 2006 were analysed independently. Annual PPRs and TFRppr were calculated for up to 10 years prior to each survey. For instance, fertility estimates in 1971–1981 were calculated from the 1982 survey, estimates in 1977–1987 from the 1988 survey, and so on. Thus, for some years there was more than one estimate: 1977–1981 from the 1982 and 1988 surveys; 1986–1987 from the 1988 and 2001 surveys; 1990–1994 from the 1997 and 2001 surveys; 1995–1996 from the 1997, 2001 and 2006 surveys; and 1997–2000 from the 2001 and 2006 surveys. Theoretically, any duplicated annual estimate for the analysis was acceptable because each survey was designed to be nationally representative. In practice, for those duplicated annual estimates the annual fertility estimates for 1977–1981 from the 1982 survey, estimates in 1986–1987 from the 1988 survey, estimates in 1990–1996 from the 1997 survey, and estimates in 1997–2000 from the 2001 survey were used.
It should be noted that non-marital fertility is rare in China (Banister & Harbaugh, Reference Banister and Harbaugh1994; Lu & Zhai, Reference Lu and Zhai2009) and generally data on pre-marital births are either ignored or not published in official statistics. Marriage continues to be universal and childbearing within marriage is a social norm across China.
Results
Fertility trends and differentials
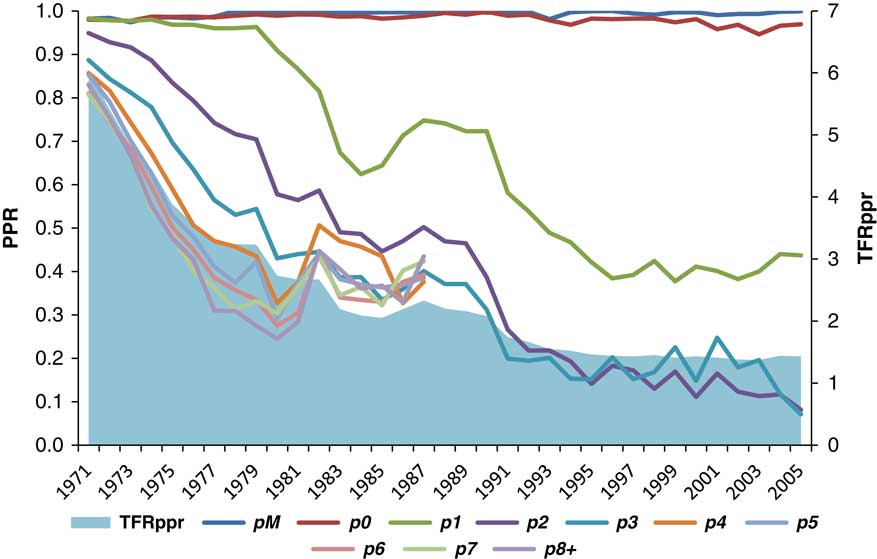
Table 5 and Fig. 2 show the TFRppr and PPRs for China as a whole from 1971 to 2005. These trends are consistent with the patterns expected during the implementation of the Later, Longer, Fewer policy in the 1970s and the introduction of the strict One-Child policy in 1979. After 1984, when the strict One-Child policy was gradually relaxed, the PPRs at parity 1 stopped declining rapidly. Progression ratios from first to second birth were high and stable during the 1970s, and dropped sharply in 1981 following the introduction of the One-Child policy and have continued to decline ever since. Progression ratios to third and higher births declined significantly during the 1970s when the Later, Longer, Fewer policy was encouraged. From 1980 onwards, all higher PPRs declined sharply, reflecting the effective implementation of the One-Child policy. These patterns are shown in Table 5. The TFRppr reached a plateau in 1977 to 1979, just before the introduction of the One-Child policy. The period PPRs also showed similar trends.
Parity Progression Ratios and TFRppr in all China, 1971–2005.
Parity Progression Ratio based Total Fertility Rates (TFRppr) and Parity Progression ratios, China 1971–2005
Calculations based on data from 1982, 1988, 1997, 2001 and 2006 surveys.
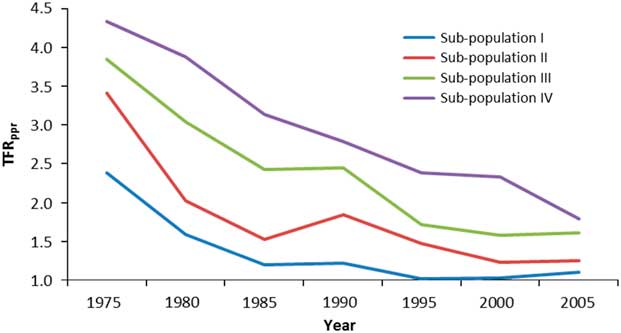
Figure 3 presents the TFRppr by study sub-populations regulated by different FPP. The substantial fertility decline in China since the 1970s is reflected in the decline in fertility of all sub-populations. Interestingly, however, there were marked differences in the initial level of fertility in 1975 across sub-populations. The TFRppr of urban women regulated by the One-Child policy was lower than that of rural women who were regulated by the ‘one and a half children’ policy, which in turn was lower than that of women regulated by the ‘two children’ policy at all observed points in time. Over time, the gaps between the sub-populations regulated by different FPP narrowed, and have remained constant in recent years.
TFRppr among different sub-populations in China, 1975–2005.
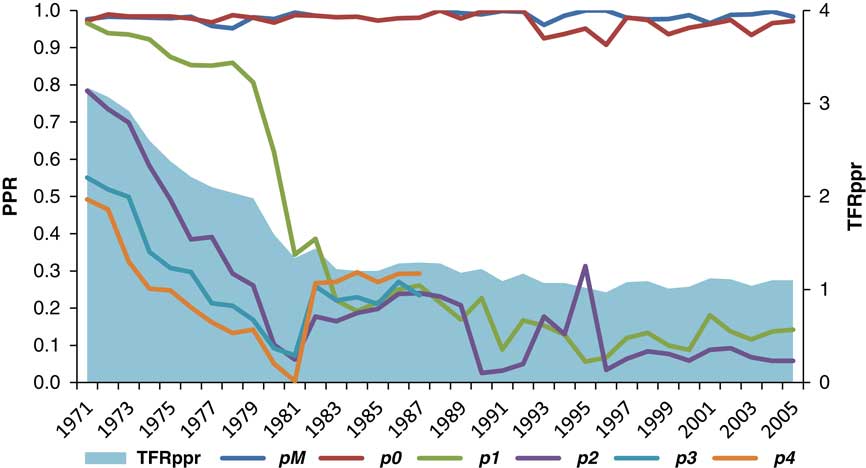
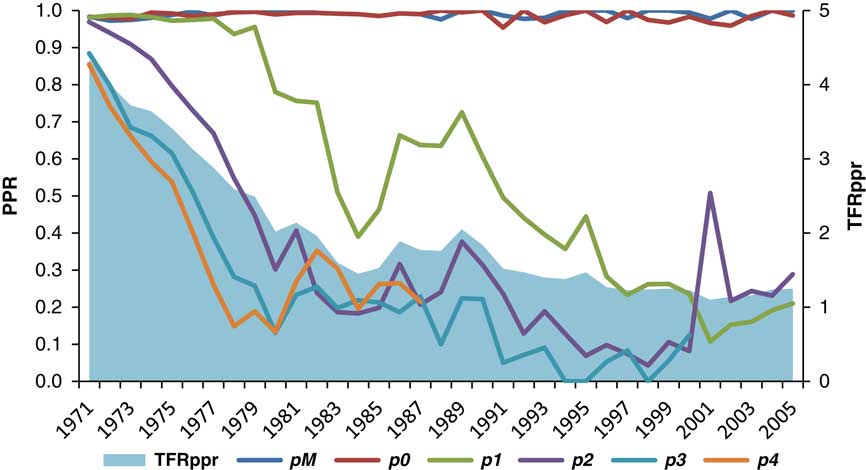
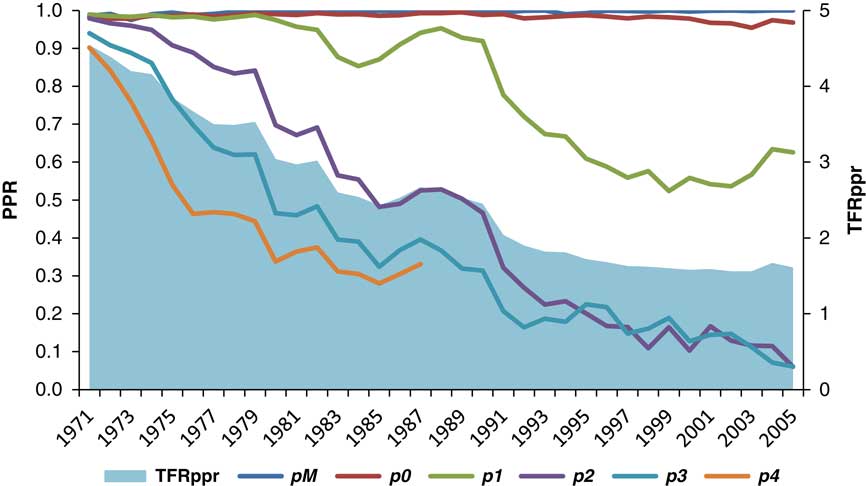
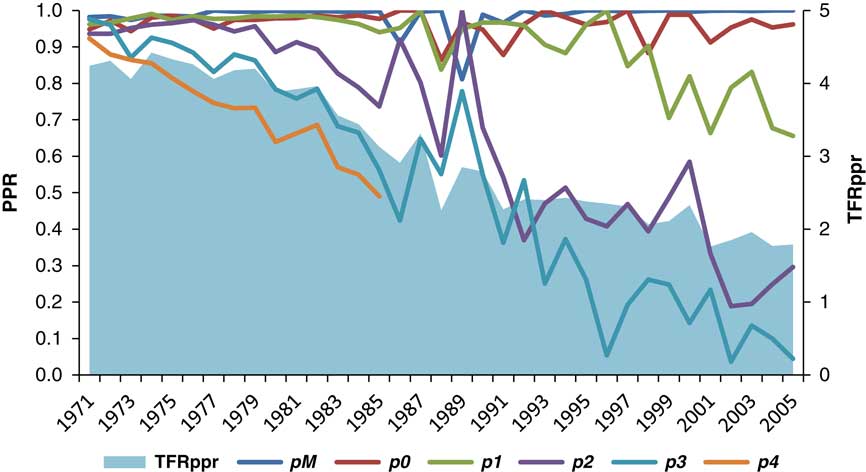
The trends in PPRs for each sub-population are shown in Tables 6–9 and illustrated graphically in Figs 4–7. All sub-populations shared similar patterns in terms of progression from first marriage to first birth, suggesting that both marriage and transition to first birth remain universal across China. Thus the following results will be on the rest of parity progressions, particularly those making transitions from parity 1–2 and parity 2–3 in the different FPP periods.
Parity Progression Ratios and TFRppr for sub-population I in China, 1971–2005.
Parity Progression Ratios and TFRppr for sub-population II in China, 1971–2005.
Parity Progression Ratios and TFRppr for sub-population III in China, 1971–2005.
Parity Progression Ratios and TFRppr for sub-population IV in China, 1971–2005.
Parity Progression Ratios for sub-population I, China 1971–2005
Calculations based on data from 1982, 1988, 1997, 2001 and 2006 surveys.
Parity Progression Ratios for sub-population II, China 1971–2005

Calculations based on data from 1982, 1988, 1997, 2001 and 2006 surveys.
Parity Progression Ratios for sub-population III, China 1971–2005
Calculations based on data from 1982, 1988, 1997, 2001 and 2006 surveys.
Parity Progression Ratios for sub-population IV, China 1971–2005
Calculations based on data from 1982, 1988, 1997, 2001 and 2006 surveys.
1971–1979 (Later, Longer, Fewer policy)
During the period of the Later, Longer, Fewer policy, the progression from parity 1–2 in sub-population I, who lived in urban areas across the whole country, dropped from 0.97 to 0.81; in sub-population II, the figures declined slightly from 0.98 to 0.96; and in sub-populations III and IV, the progression rate remained high at around 0.98. The results indicate that during this period a small share of urban residents started to control their fertility to fewer than two children, even though the FPP did not restrict family size to fewer than two children.
For parity progression from 2 to 3, the ratios declined sharply from 0.78 to 0.26 and 0.97 to 0.45 among sub-populations I and II, respectively. Among sub-population III, the ratio decreased from 0.98 to 0.84, while among sub-population IV, the ratio remained high at around 0.96 during this period. The results indicate that the Later, Longer, Fewer policy was effective and widely accepted among sub-populations I and II, but not well accepted by the other two sub-populations. During the 1970s, in sub-population IV about 96% of women who had a second birth went on to have a third birth. Although there was some reduction among sub-population III, still about 84% of women who had a second birth had had their third birth by 1979.
For higher parity progression in sub-population I, only 17% of women who had a third birth had a fourth birth by 1979, and only 14% of women who had their fourth birth had their fifth birth among sub-population I. The corresponding ratios were 26% and 19%, respectively, in sub-population II, 62% and 44% in sub-population III and 86% and 73% in sub-population IV. Again, these results reflect a wider acceptance of FPP in sub-populations I and II, accompanied by overall better socioeconomic conditions when compared with sub-populations III and IV.
1979–1984 (One-Child policy)
In sub-population I the progression from parity 1–2 declined sharply – from 0.81 in 1979 to 0.19 in 1984 – suggesting that the strict One-Child FPP was implemented very effectively in that population. In sub-populations II, III and IV, the ratios declined from 0.96 to 0.39, 0.99 to 0.85 and 0.98 to 0.96, respectively, highlighting that although the policy had an effect, it was not universally adopted. Even in sub-population II (rural residents of the six ‘developed’ provinces of Beijing, Tianjin, Shanghai, Jiangsu, Sichuan and Chongqing), about 39% of women who already had a first birth did not follow the One-Child FPP, and this was 85% amongst rural residents in the other parts of the country (sub-population III) and 96% in sub-population IV. This provides clear and compelling evidence of the level of non-compliance with the One-Child policy, which subsequently led to the Differentiated FFP that continued until 2013.
The period 1984–1986 was not considered in the decomposition analysis since the majority of provincial regulations were still under process of formulation during this period.
1986–2005 (Differentiated policies)
During this period, the progression from parity 1–2 declined significantly from 0.25 to 0.14 and from 0.66 to 0.21, respectively, among sub-populations I and II, both of which were subject to the ‘one-child only’ policy. The progression ratio from parity 1–2 and parity 2–3 in sub-population III, who were subject to the ‘one and a half children’ policy, decreased from 0.91 to 0.63 and 0.49 to 0.01, respectively, indicating that the policy was effective in reducing third births to virtually zero, with second births being curtailed. Among sub-population IV, who were subject to the ‘two children’ policy, the progression from parity 1–2 and parity 2–3 reduced from 0.95 to 0.66 and 0.92 to 0.30, respectively, again highlighting the effectiveness of the policy in reducing third births. Actual fertility amongst each sub-population was slightly higher than that implied by the Differentiated policy targets, reflecting the fact that there were some exceptions or non-compliance for each type of family planning policy. Nevertheless, the results demonstrate evidence that all four types of FPP were effective and widely implemented.
Decomposition of fertility change
Table 10 shows the results of the decomposition of TFRppr by different family planning policy periods nationally and by sub-populations. The TFRppr reached a plateau during 1977–79. To examine this trend, the decomposition of Later, Longer, Fewer FPP periods were divided into 1971–1977 and 1977–1979. Over the entire period from 1971 to 2005, the TFRppr declined by 4.6 children per woman, with substantial reduction in the 1–2 and 2–3 parity progressions, accounting for 98% of the overall decline.
Change in the Parity Progression Ratio based Total Fertility Rate (TFRppr) and shares of that change attributable to changes in PPRs, all China 1971–2005
* Percentage contribution in the opposite direction of change in TFRppr.
1971–1977 (early stage of the Later, Longer, Fewer policy)
During the first 6 years of the Later, Longer, Fewer policy, the TFRppr declined by 2.7 children per woman, from 6.04 to 3.29. This decline was largely attributed to a decrease in higher PPRs, with approximately 94% of the change being due to reduction in parity progressions at 3, 4, 5 and 6. The results reflect that the Later, Longer, Fewer policy was being effectively implemented among the population as a whole during this period.
1977–1979 (later stage of the Later, Longer, Fewer policy)
In the latter years of the policy, however, the TFRppr remained almost constant. The drop of 0.1 in the TFRppr mainly resulted from a decline in progression to parity 3, 4 and 5. However, it appears that the policy had run its course and further reductions in total fertility proved difficult to achieve, stimulating a change in course and the introduction of a more stringent policy.
1979–1984 (One-Child policy)
During the period of strict enforcement of the One-Child policy, the TFRppr dropped from 3.2 to 2.1. The decomposition of fertility change showed that a reduction of progression from parity 1–2 contributed significantly to the overall decline in fertility at the national level, accounting for 69% of the decline. In addition, reduction of progression from parity 2–3 contributed 23% of the decline. The results are broadly consistent with the expected impact of FPP over this time period.
1986–2005 (Differentiated policies)
During this period, when different policies were applied in different parts of the country, the national TFRppr continued to decline from 2.2 to 1.4 children per woman. The decomposition analysis illustrates that 74% of fertility decline during this period was attributed to a reduction in progression from parity 1–2, and 33% was attributed to a reduction from parity 2–3.
Overall the results provide clear evidence of the influence of family planning policy on fertility decline in China. The Later, Longer, Fewer policy was effective in reducing higher parity births, and fertility reaching a plateau at the late stage of this policy possibly led to the initiation of the One-Child policy.
Discussion
Prevailing socioeconomic conditions have been instrumental in adapting and accelerating the family planning policy response to reducing fertility levels across China. This study’s classification of FPP based sub-populations is a reflection of socioeconomic conditions in the country, mainly taking into account the composition and distribution of ethnic groups. As a result, it was difficult to accurately differentiate the independent effects of FPP and socioeconomic factors associated with the reduction in total fertility and parity progression rates. A key contribution of this research is the evidence it provides highlighting different trajectories of parity transitions and the convergence of total fertility rates across sub-populations with different socioeconomic conditions. The study found that the fertility differentials explained by the FPP remain convincing in the transitional and post-transitional stages, providing an alternative view at the macro-level to that of Cai (Reference Cai2010) and others. However, the disaggregation of fertility change amongst different sub-populations indicates that social economic conditions have played an important role in policy implementation. Women living in the geographical regions regulated by the ‘one and a half children’ policy tended to have higher fertility than those regulated by the ‘one child’ policy; and those regulated by the ‘two children’ policy tended to have higher fertility than those regulated by the ‘one and a half children’ policy. The implication of this finding is that FPP remain an important determinant of China’s overall level of fertility.
Tsui (Reference Tsui2001) and McNicoll (Reference McNicoll1975, Reference McNicoll2001) affirmed a potential direct effect of policy on fertility transition through improving access to fertility-regulation methods and through diffusion of supportive ideas. The Chinese government has indeed been proactive in mobilizing resources and programme co-ordination aimed at reducing fertility through a variety of strategic top-down administrative approaches, such as stringent legislation, wider dissemination of family planning information, provision of incentive-oriented and extended contraceptive services and political control. Over time, the role and influence of national family planning interventions and programmes have been differentially implemented across sub-populations, with national policies (such as the Later, Longer, Fewer and the One-Child policies) being more readily adopted by those who were relatively better off in terms of socioeconomic development than their counterparts. By the time the Differentiated policies were introduced in 1986, fertility in urban areas was already below replacement level. The results suggest that socioeconomic conditions expedited the extent and speed of the family planning policy response across China.
The findings confirm the overall patterns of fertility change in China, and are broadly consistent with those reported elsewhere (for example, Feeney & Yu, Reference Feeney and Yu1987; Luther et al., Reference Luther, Feeney and Zhang1990; Feeney & Wang, Reference Feeney and Wang1993; Freedman & Wang, Reference Freedman and Wang1993; Feeney & Yuan, Reference Feeney and Yuan1994; Zeng, Reference Zeng1996; Retherford et al., Reference Retherford, Choe, Chen, Li and Cui2005). The paper adds new evidence on PPRs among sub-populations differentially exposed to FPP and how these contributed to policy impact on TFRppr across time and place. The classification of sub-populations defined by different FPP enabled the dynamics and heterogeneity of fertility trends and variations across China to be understood.
More recently, there have been a series of public debates about the implications of FPP on future population challenges in China, particularly on issues related to labour shortages, population ageing and skewed sex ratios. The Chinese government has already taken new steps to reform FPP. The most recent reform is a cautious step, relaxing the policy to two children rather than removing the policy altogether, warranting concerns that the relaxation might trigger a baby boom (Basten & Jiang, Reference Basten and Jiang2015). On the other hand, findings from recent fertility intention surveys point towards a TFR far below replacement level in the foreseeable future (Zheng et al., Reference Zheng, Cai, Wang and Gu2009; Zhuang et al., Reference Zhuang, Jiang, Wang, Li, Qi and Wang2014). Mao and Lu (Reference Mao and Luo2013) argued that physiological factors and practical pressures will take precedence over fertility intention and preferences in reducing the actual fertility rate even lower than predicted. Also, with increased women’s education and participation in economic activities, it is likely that the fertility increase might not be as large as is often assumed.
There is evidence that socioeconomic factors have mediated the influence of FPP on fertility change over time and place in China, with high compliance in the most urban, industrialized areas and weaker acceptance among women living in the poorest rural areas. This research confirms the potential impact of FPP throughout the fertility transition process, including the persistent role of policy in the post-transitional stage at a very low fertility level. Given the current changes in FPP, follow-up research is needed to monitor reproductive preferences and future trends in fertility in the country, especially in urban areas and among different socioeconomic groups. Although marriage remains widespread both socially and culturally across China, the younger generation tend to delay marriage increasingly until their late twenties. According to the 2010 census, there is also a gradual trend in the proportion of women remaining single, estimated at a little over 5% (National Bureau of Statistics of China, 2012). Future research may consider truncation of age at first marriage beyond 30 to reduce the potential underestimation of marriage effect on parity progressions and total fertility rate.
Acknowledgments
The authors are grateful to Andrew Hinde and Dudley L. Poston for their constructive comments and suggestions on an earlier version of this manuscript.
Ethical Approval. The authors assert that all procedures contributing to this work comply with the ethical standards of the relevant national and institutional committees on human experimentation and with the Helsinki Declaration of 1975, as revised in 2008.
Conflicts of Interest. The authors have no conflicts of interest to declare.
Funding. This research was supported by the Economic and Social Research Council (ES/J500161/1).


 Open access