

The Black Death and other severe pre-industrial epidemics, frequently referred to as “plagues,” fill the public imagination. They are often identified as crucial turning points in history that sometimes led to the collapse of societies and sometimes paved the road for impressive growth. It is no surprise then that plague features conspicuously in some debates in social and natural sciences: from traditional narratives on the rise of Europe (e.g., North and Thomas Reference North and Thomas1973) to the social and demographic impact of Ebola (e.g., Ó Gráda Reference Borsch and Green2015). Pre-industrial epidemics are useful illustrations of large-scale mass mortality caused by infectious diseases. Indeed, popular science makes comparison to the Black Death in relation to current outbreaks of avian flu, Ebola, or Zika.
Few studies grasp the full complexity of these potentially world-shaping phenomena. Most fail to take into consideration active debates on the nature of the epidemics, the agents that caused them, the changing characteristics of pathogens and diseases over time, and other aspects that are of crucial relevance to assess their economic implications. Even basic terminology is confusing. Although many of the worst pre-industrial epidemics appear to have been caused by the bubonic plague, the range of epidemics that are referred to as “plagues” is much larger. Far from being a superficial debate on terminology, this is of substantial importance. The nature and consequences of infections depend on the specific agent; vagueness in language makes it difficult to properly interpret historical documentation, navigate the scientific and popular literature, and generally understand the phenomenon.
Recent developments suggest that it is time to reassess the economic implications of plague and other infections (e.g., Cohn Reference Cohn2007a; Bosker et al. Reference Bosker, Brakman and Garretsen2008; Campbell Reference Campbell and Cavaciocchi2010a, 2016; Alfani Reference Alfani2013a; Ó Gráda Reference Borsch and Green2015). Indeed, given the importance for social science of understanding both the determinants of mortality and its consequences (Cutler, Deaton, and Lleras-Muney Reference Cutler, Deaton and Lleras-Muney2006), increasing interest in the role of disease in determining the path of economic development (Diamond Reference Diamond1997; Acemoglu, Robinson, and Johnson Reference Acemoglu, Robinson and Johnson2003; Nunn and Qian Reference Nunn and Qian2010) focuses attention on major epidemics. Some authors have claimed that the Black Death—the most iconic wave of the plague—is a key element in Europe's divergence from the rest of the world (e.g., Epstein Reference Epstein2000; Clark Reference Clark2007; Voigtländer and Voth 2013).
This Review and Reflection article provides an overview of recent literature on pre-industrial plagues, from historical studies to biological and paleo-biological research, focusing on those aspects that are of particular interest to economic and social historians. We analyze the main environmental and institutional factors that shaped both the way in which a plague originated and spread and its overall demographic and socioeconomic consequences. We aim to clarify how the same pathogen shows historically different epidemiological characteristics, and how epidemics that appear similar (especially regarding the number of victims) had deeply different consequences. We also discuss the current debates about the socioeconomic consequences of plague, both in the long and the short term.
Our main focus is on the bubonic plague which was responsible for the worst mortality crises of the medieval and early modern period. The Black Death (1347–1352) is the first plague for which we have relatively abundant data on real wages, wealth distribution, and population. It is no surprise, then, that recent literature has focused primarily on this episode and on subsequent ones caused by the same pathogen. We also discuss some other lethal pre-industrial epidemics, such as those affecting the Roman Empire and the Mediterranean during late Antiquity and the early Middle Ages and the string of epidemics associated to the sixteenth-century “Columbian Exchange.” This comparison provides better understanding of the specificities of different events and offers a more encompassing view of human responses to mortality crises. A better understanding of pre-industrial epidemics can therefore offer useful insights to comprehend the modern world.
PLAGUE AND OTHER EPIDEMICS
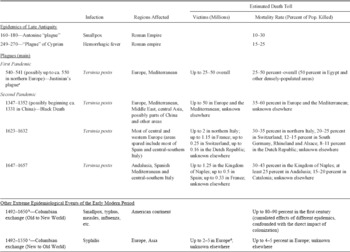
“Plague” is one of those unfortunate words having different meanings for different people in different contexts. It is used vaguely when referring to epidemics of different natures (type of pathogen) and consequences (affecting the whole population or a subset of it), where the only common traits these “plagues” share is that they cause an exceptionally high number of deaths and/or cause terror.Footnote 1 Historians sometimes face serious problems in correctly identifying the disease, because historical sources, especially those preceding early modern times, are often blurry in distinguishing different infectious diseases. In a strictly biological sense, plague is usually understood as an infection caused by the Yersinia pestis bacillus, identified in 1894 by Alexandre Yersin. Seen in Table 1, most of the largest pre-industrial epidemics were Yersinia pestis. Although until recently the identification of the causative agent for ancient plagues was disputed (Duncan and Scott Reference Duncan and Scott2001; Cohn Reference Cohn2002; Little Reference Little2011), paleobiologists have now provided considerable evidence to confirm the view that the Black Death, the Justinian's plague, and others were indeed caused by the Yersinia pestis bacillus (e.g., Morelli et al. Reference Morelli, Song and Mazzoni2010; Bos et al. Reference Bos, Schuenemann and Brian Golding2011). For consistency, we will use the word plague only for epidemics presumably associated with Yersinia pestis.Occasionally, “plague”–between inverted commas–will be used to refer to other epidemics.
Major lethal epidemics of the pre-industrial world
Notes:
Figures for Justinian's plague refer to the initial outbreak only, not to the outbreaks which make up the “First Pandemic” ending in 750.
Following colonization epidemics repeated regularly for centuries where population was not entirely eradicated, yet the larger demographic toll took place roughly in the first 150 years.
After the mid-sixteenth century, syphilis mutated towards a less aggressive disease.
Given the scarcity of information, the victims of syphilis are a very uncertain upper boundary only.
Sources: Based on the sources cited in the main text.
The Black Death and Other Plague Waves
The Black Death, which hit Europe in 1347–1352, was probably the worst plague of all times. It killed between one- and two-thirds of the European population (Del Panta Reference Del Panta1980; Benedictow Reference Benedictow2004) and affected northern Africa and large parts of Asia as well. According to William H. McNeill's classic reconstruction, plague was endemic in the wild rodent population of the Himalaya. When the Mongols incorporated that area into their growing empire, they sparked an outbreak. In 1331 a terrible epidemic, possibly of plague, affected the province of Hebei in north-eastern China. This might have been the beginning of the pandemic that subsequently crossed the Asian steppe reaching Caffa on the shores of the Black Sea in 1346 (McNeill Reference McNeill1976).Footnote 2 From there, the plague spread by ship to Byzantium, to some areas of southern Italy, and possibly to Marseille in southern France in 1347. By 1348, it ranged over the Mediterranean area and the rest of Europe.
In Europe and the Mediterranean alone, the Black Death killed up to 50 million people, making it the second-worst pandemic in human history in absolute terms, behind the 1917–1919 Spanish Influenza that killed between 50 and 100 million people (Johnson and Mueller Reference Johnson and Mueller2002). It remains first in terms of mortality rates. Over the following three centuries plague became a fairly common occurrence (Biraben Reference Biraben1975; Livi-Bacci Reference Livi-Bacci2000, 2007). Although we know little about the outbreaks in the century immediately after the Black Death (for a useful synthesis, see Cohn Reference Cohn and Nutton2008), those occurring in the sixteenth, seventeenth, and eighteenth centuries have been studied in detail.
Two seventeenth-century plagues are of particular interest because for much of Europe they were the worst after the Black Death. They do seem to share the ability to cause long-term divergence between more and less affected areas (Alfani Reference Alfani2013a). The 1623–1632 plague started in northern Europe (northern France, the Netherlands, and the Rhineland), and by 1625 it had spread to England and northern-central Germany. It then moved southwards, through eastern France and southern Germany. By 1628–1629, a belt from the Pyrenees to Bavaria and Switzerland was infected. In 1629 the plague entered northern Italy, spreading to Tuscany in 1631, but sparing the rest of Italy. From Lombardy, the plague spread to Catalonia, which was ravaged during 1629–1630 (Eckert Reference Eckert1978; Alfani Reference Alfani2013a). The 1647–1657 plague broke out in eastern Spain, possibly coming from northern Africa. It then affected Andalusia and other parts of Spain, as well as the Balearic archipelago. In 1652 it spread to Sardinia and in 1656 to the Kingdom of Naples. During 1656–1657, all of southern Italy (Sicily excepted) was infected, as well as central Italy (Tuscany excepted), and Liguria to the North (Pérez Moreda 1987; Alfani Reference Alfani2013a).
The seventeenth-century plagues belong to a cycle of epidemics often referred to as the “Second Pandemic,” which started with the Black Death and ended only in the eighteenth and early nineteenth century. The Second Pandemic was followed by a “Third Pandemic,” which originated in the Yunnan region of China in the late nineteenth century. In 1894, Hong Kong was affected. From here, plague spread globally via shipping (Haensch Reference Haensch, Bianucci and Signoli2010, p. 1). In 1896 it reached India, where in a few decades 12.5 million died (Kohn Reference Kohn2007, 183–84). The Hong Kong plague wave led to small outbreaks in Europe, from the 1900 epidemic of Glasgow, with 16 deaths (Cohn Reference Cohn2002, p. 13), to the 1920 epidemic of Paris, with 39 deaths (Audoin-Rouzeau Reference Audoin-Rouzeau2007). More importantly, in 1900 the plague crossed the ocean and reached San Francisco, where during 1900–1904 an epidemic caused 113 deaths (Echenberg Reference Echenberg2007, pp. 213–42). From San Francisco the plague spread eastward, infecting the population of wild rodents and becoming endemic. This Third Pandemic is ongoing. Between 2010 and 2015, the World Health Organization (WHO) reported 3,248 cases of human plague worldwide, resulting in 584 deaths; 96 percent occurred in Africa, 3 percent in the Americas (including 39 cases, leading to 5 deaths, in the United States); and 1 percent in Asia (Bertherat Reference Bertherat2016). With signs of antibiotic-resistant strains, plague has to be considered a “re-emerging infectious disease” and a serious global threat (Ziegler Reference Ziegler and Green2015, pp. 260–63).
The First Pandemic, relatively neglected by past scholars, has recently attracted attention as a potential driver of the decline of the Roman Empire. Linked to Justinian's plague, which started in 541, it arguably compromised the Byzantine emperor's attempt to reconquer Italy and other core areas of the Western Roman Empire (Sarris Reference Sarris2002). But terminology here is again confusing. Historians today tend to use “Justinian's plague” to refer to a series of plague outbreaks, which ended around 750 when the infection disappeared from Europe, the Mediterranean, and the Middle East, not to return until the Black Death (Little Reference Little2007). Justinian's plague is the first epidemic for which we have substantial historical and paleo-biological evidence that the infection was Yersinia pestis. It caused up to 25–50 million victims across Europe and the broader Mediterranean area (Little Reference Little2007; Horgan 2014; Harper Reference Harper2016). In 544 it seems to have reached Ireland and possibly, around the same date, Britain (Maddicott Reference Maddicott1997, pp. 10–11; Dooley Reference Dooley and Little2007, p. 215–16) although this is uncertain. Justinian's plague is usually considered the third-worst epidemic in the history of humankind.
Other Major Pre-Industrial Lethal Epidemics
Plague caused most of the mortality attributed to epidemics in the pre-industrial world, but there were other noteworthy examples of lethal epidemics that were almost certainly not caused by Yersinia pestis. Two such outbreaks were the Antonine “plague” of 160–180, possibly a smallpox epidemic, which in Italy caused a decline of about 10–30 percent in the overall population (older estimates were up to 50 percent; Lo Cascio and Malanima Reference Lo Cascio and Malanima2005, p. 12; Harper Reference Harper2016), and the “Cyprian's plague” of 249–270, arguably a hemorrhagic fever of some sort, which affected the entire Roman Empire. This latter epidemic had important long-term consequences (Harper Reference Harper2015).
Other major epidemics are associated with the Columbian exchange; that is, the exchange of diseases, as well as ideas, food crops, and populations, between the New and the Old World after Columbus (Crosby Reference Crosby1972; Nunn and Qian Reference Nunn and Qian2010). Just as Mongols had carried with them the plague from Asia, Europeans brought a range of diseases to the Americas, plague among them. But other diseases seem to have dominated in terms of diffusion and overall mortality: measles, whooping cough, chicken pox, smallpox, typhus, and malaria, against which indigenous people had no defence, either biological (immunity, selection) or cultural (basic knowledge of the disease) (Diamond Reference Diamond1997; Livi-Bacci Reference Livi-Bacci2007). The demographic collapse after 1492 was catastrophic, with estimates of up to 85–90 percent of the overall population lost in different locations (Cook Reference Cook1981, Reference Cook1998; Newson Reference Newson1993, 2006). In certain parts of the Caribbean, populations like the Taino Indians, were almost entirely wiped out (Livi-Bacci Reference Livi-Bacci2007). It is difficult to precisely calculate the losses because many figures are still contentious, and we do not know whether the explorers made their estimates of the size of indigenous populations before or after the first epidemics struck (Nunn and Qian Reference Nunn and Qian2010, p. 166). Although it is hard to disentangle how many deaths were actually due to disease given the many other factors contributing to the collapse, such as death and ill treatment by the colonizers and the general sharp decline in standards of living (Allen, Murphy, and Schneider Reference Allen, Murphy and Schneider2012), most believe that disease was a major contributor (Newton 1993; Livi-Bacci Reference Livi-Bacci2006).
Since evidence is considerably thinner than for the Old World, and many factors of colonization affected population dynamics, figures should be taken with caution. Smallpox, for example, the most cited disease in the New World collapse, has in pre-industrial settings a lethality in the order of “just” 20–35 percent, perhaps somewhat higher in “virgin soil” populations (Carlos and Lewis Reference Carlos and Lewis2012, p. 282) but much lower than the 80 percent and more attributed to bubonic plague in Europe. Massimo Livi-Bacci suggested that although it is mathematically possible that smallpox alone caused a 60 percent population decline over a relatively short period of time, this would be the outcome of an extreme and unlikely scenario in which three successive epidemics hit with full strength (i.e., infecting all non-immune individuals) and with maximum conceivable lethality (40 percent) a society which did not “rebound” after each shock (Livi-Bacci Reference Livi-Bacci2006, pp. 207–9). Finally, epidemics did not affect all American regions in the same way. Disease could spread more rapidly in the more densely populated areas (see Figure 1). Once diseases took the initial death toll, if the size of population allowed, they frequently became endemic: epidemics of smallpox, measles, and typhus erupted regularly. Mexico was hit in 1659, 1692–1697, 1736–1739, 1761–1764, 1772–1773, 1779, and 1797–1798, and the Andean region in 1692–1694, 1718–1720, and the 1780s (Newson 2006, p. 169).
American Demographic Collapse Following the Columbian Exchange in the Most Populated Regions

From the Americas, Europe imported syphilis. Although easily treated today with penicillin, in the early modern period syphilis was lethal. Only during the seventeenth century it morphed into a less aggressive disease (Crosby Reference Crosby1972). The first recorded epidemic was in 1495 during the French siege of Naples, hence the popular denomination of “French disease.” The timing and some historical records suggest it had probably come from the Americas, and a phylogenetic study has lent support to the hypothesis (Harper et al. Reference Harper, Ocampo and Steiner2008). Estimates are uncertain, but by the mid-sixteenth century, syphilis might have infected up to 5 percent of the entire European population (Oriel Reference Oriel1994), possibly causing deaths in the millions and, because of its venereal nature, significantly affecting social behavior. We know even less about the spread of syphilis to other continents during the early modern period. In some parts of Asia it must have been significant, as a recent study estimated that by the late nineteenth century, 11 percent of adult Japanese women were infected (Drixler Reference Drixler2016, p. 671).
WHAT WE DO AND DO NOT KNOW ABOUT PLAGUE
Yersinia pestis is a bacterium belonging to the enterobacteria family. According to genetic studies, it evolved from the relatively harmless soil pathogen Yersinia pseudotuberculosis between 4394 BC and 510 AD, probably in the Tibetan-Quinghai Plateau (Cui et al. Reference Cui, Yu and Yan2013; Green 2015b). Under normal circumstances, Yersinia pestis cannot be transmitted directly from person to person. Classic accounts of the Black Death and other plagues model transmission as involving first a rat epidemic and the rat flea as the vector carrying the pathogen to humans. This story is oversimplified. Rats are not the only possible carrier. Many different rodents (American wild squirrels, prairie dogs) as well as other mammalians, sheep, canids, and camels, are susceptible to Yersinia pestis (Green 2015b, pp. 32–34). Additionally rat fleas are only one of many likely vectors along with other species of flea and maybe lice. The complexity of Yersinia pestis' transmission is relevant because during the Black Death and many subsequent plague waves the infection spread across human populations with an efficacy and speed that run counter to the standard rat-to-rat flea and rat flea-to-human transmission model, puzzling paleobiologists and historians alike (Bolton Reference Bolton, Clark and Rawcliffe2013, pp. 26–28; Raoult et al. Reference Raoult, Mouffok and Bitam2013).
In principle, the quickest way for an infection to spread is human-to-human. Yersinia Pestis can cause secondary pneumonia and subsequently transmit through aerosol, without the need of a vector. But this “pneumonic plague” develops only in very specific environmental conditions (typically cold and humid). Additionally, the scientific evidence accumulated during the Third Pandemic suggests that “direct transmission [of plague] by aerosols may not explain pandemics” (Raoult et al. Reference Raoult, Mouffok and Bitam2013, p. 19). We still need to understand how Yersinia pestis could have caused so many deaths, so quickly, and with such a cadence. We need to consider not only the nature of the pathogen but also the human environment and the action of the institutions trying to fight the epidemic. Additionally, the issue of human-to-human plague transmission is not entirely closed. First, we cannot yet rule out that ancient strains of Yersinia pestis were more efficient than current biovars in spreading through aerosols.Footnote 3 Secondly, we are also unsure which parasites could have been, in the specific environmental conditions of pre-industrial Europe, more effective vectors of the infection. Human parasites (human fleas, lice, etc.) could have acted as vectors, without the intervention of rats and their parasites (rat fleas), a form of transmission that can be treated as direct human-to-human, to distinguish it from the complex model involving rats-to-rat fleas-to-humans (e.g., Biraben Reference Biraben1975; Whittles and Didelot Reference Whittles and Didelot2016, p. 2).
The hypothesis of human-to-human transmission has been explored using traditional sources, such as parish records and simple statistical techniques. Roger Schofield (Reference Schofield1977), employing a method based on the binomial expansion, used information about the clustering of deaths per household to identify bubonic plague as the probable culprit in a large epidemic affecting Colyton (England) in 1645–1646. With the same technique, he recently attributed to an outbreak of bubonic plague followed by pneumonic plague an epidemic affecting Bräkne-Hoby (Sweden) in 1710–1711 (Schofield Reference Schofield2015). Were this to be confirmed by paleo-biological methods, this would be the last known plague in Scandinavia. Guido Alfani and Samuel K. Cohn (Reference Alfani and Cohn2007) used this method for a 1630 plague in the Italian rural town of Nonantola to find evidence of human-to-human transmission. Alfani and Marco Bonetti Reference Alfani and Bonetti2016) again working on 1630 Nonantola, produced the first micro-demographic study of a pre-industrial plague using modern survival analysis techniques and supported human-to-human transmission.
Geography and Intensity
While classic studies already analyzed the geography of plague (Biraben Reference Biraben1975; McNeill Reference McNeill1976), recent research explores new aspects of the spatial evolution of the disease. These encompass a global history of plague, going beyond traditional local studies and integrating traditional historical sources with new evidence from paleobiology and phylogenetics (Green Reference Green2015a; 2015b). They reach beyond Western Europe, so that the Mediterranean and the Balkans are better represented in the narrative, offering comparison and improved understanding of plague epidemiology especially at the time of the last outbreaks in the eighteenth and nineteenth century which originated from northern Africa and the Levant (Borsch Reference Borsch2005; Restifo Reference Restifo2005; Andreozzi Reference Andreozzi2015; Varlik Reference Varlik and Green2015; Blažina Tomič and Blažina 2015). Within Europe, new studies have gone beyond Biraben's pioneering, but now outdated, account (e.g., Eckert Reference Eckert1996; Alfani Reference Alfani2013a).
Estimates of plague intensity have changed significantly in recent years. Early studies relied upon limited data and provided at best some educated guesses. Recent extensive archival work argues that even the upper bound of those initial, conservative guesses were underestimates. Plague was apparently deadlier than we used to think. For the Black Death, Ole J⊘rgen Benedictow (2004, pp. 382–84) practically doubled earlier figures, suggesting the disease killed up to 60 percent of the European population (50 million victims). Idamaria Fusco (Reference Fusco2009) also doubled the previous estimates for the 1656–1657 plague in the Kingdom of Naples (from 20–30 percent to 43 percent, or 1.25 million victims in the Kingdom alone). Alfani (Reference Alfani2013a) increased the mortality rate estimates for the northern Italian areas affected by the 1629–1631 plague (from 20–25 percent to 35 percent, or 2 million victims). Recently Ronald Rommes (Reference Rommes2015) raised the upper bound of plague victims in the Dutch Republic throughout the seventeenth century to about 600,000.
The on-going reassessment of plague intensity has also led to the emergence of new approaches which aim to better evaluate the potential heterogeneous impact of plague. Alfani (Reference Alfani2013a) introduced the notion of “territorial pervasiveness,” i.e., the ability of plague to infect vast areas “pervasively.” This involved measuring the probability that communities with different characteristics (urban or rural) were affected by a given epidemic, and underlined at least two new aspects of the epidemiology of early modern plagues. First, whereas sixteenth century epidemics were largely urban events, the Black Death and the main seventeenth-century outbreaks affected both city and country, at least in southern Europe, which seems crucial in explaining the much greater demographic and economic impact. Second, the last great plagues of the seventeenth century affected southern Europe much more severely than the North. Over the whole century, plague victims in England numbered about 450 thousand, just a fraction of the 3.5–4 million in Italy,Footnote 4 the roughly 1.25 million in Spain, and the 2.2 million plus in France (Alfani Reference Alfani2013a, p. 411). The primary sources necessary to measure territorial pervasiveness (parish books of burials or baptisms) are widely available in Europe, at least from the early seventeenth century, so there is ample opportunity for further comparative research. For example, Daniel R. Curtis (Reference Curtis2016) recently applied this method to evaluate plague intensity in the seventeenth-century Low Countries.
Mortality by Sex, Age and Socioeconomic Status
Significant recent attention has been paid to individual susceptibility to plague. Skeletal sources have been used to assess whether sex affected an individual's risk of dying from the Black Death. Sharon N. DeWitte (Reference DeWitte2009) found no significant sex effect. Similar conclusions were reached for seventeenth-century plagues in England (Schofield Reference Schofield1977; Bradley Reference Bradley1977; Duncan and Scott Reference Duncan and Scott2001; Whittles and Didelot Reference Whittles and Didelot2016) and for the 1629–1631 plague of northern Italy (Abrate Reference Abrate1972; Manfredini, De Iasio, and Lucchetti 2002; Alfani and Cohn Reference Alfani and Cohn2007). Ratios of male to female deaths for a series of Italian towns are reported in Table 2, and they all fall largely around one. One of the few discordant cases emerges from six Milanese plagues between 1452 and 1523, where female deaths were clearly prevalent, but this seems the consequence of poor and overcrowded living conditions for immigrant women and widows (Alfani and Cohn Reference Alfani and Cohn2007).
Plague deaths by age and sex during the 1630 epidemic in Northern Italya

Notes:
Carmagnola is a city in the current region of Piedmont, while the rural town of Nonantola and the territory of Parma belong to Emilia-Romagna.
The age bands used in the table reflect the fact that in Nonantola the parish priest did not record the burials of infants under five years of age, while for Carmagnola we have no information for those under 11 years of age.
This age-band is one year longer than the others.
Total for ages 11 and older.
Sources: For Nonantola, books of burials of the Parish Archive of St Michele. For Carmagnola, own elaboration from Abrate (Reference Abrate1972). For the villages in the province of Parma, database Manfredini.
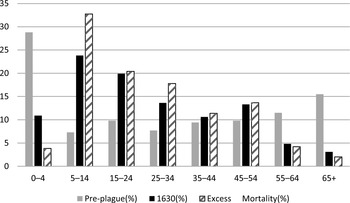
Evidence on age is somewhat ambiguous. Studies on skeletal remains from the Black Death suggest a positive correlation between frailty or poor health (identifiable by skeletal lesions), in turn associated with old age, and the probability of dying from the plague (DeWitte and Wood Reference DeWitte and Wood2008). Studies on the same period, based mainly on chronicles, indicate that all age groups were affected similarly (see e.g., Biraben 1975; Duncan and Scott Reference Duncan and Scott2001). However, it seems likely that some of the plague waves immediately following the Black Death (late fourteenth and early fifteenth centuries) affected mostly those below 12 years of age (Cohn Reference Cohn and Nutton2008, pp. 86–87). The use of sources like parish books, unavailable for the Middle Ages, allows to measure “excess mortality” per age group (i.e., the difference between the deaths per age group during a plague compared to those which occurred in normal pre-plague years). These studies conclude that plague differentially affected adolescents and young adults (11–20), followed at a distance by those aged 21–30, while relatively sparing the youngest (below 5) and the oldest components of the population (Abrate Reference Abrate1972; Manfredini, De Iasio, and Lucchetti 2002; Alfani and Cohn Reference Alfani and Cohn2007). Figure 2 shows plague excess mortality in 1630 in rural Parma.
Plague excess mortality by age (percent distribution) before and during the 1630 epidemic in the province of Parma (20 parishes)
The methodology of excess mortality is intrinsically limited because it does not take into account the age structure of the population. Using a comparison of actual plague deaths in London (St Botolph), Eyam, and Colyton with model populations, Schofield (Reference Schofield1977) found that the risk of dying of plague seemed to decline with age. In a study of the 1720–1722 Marseille plague, which is noteworthy because it computes age-specific mortality rates from archival evidence rather than use of model populations, Isabelle Séguy et al. (2006) found that plague mortality rates increased with age. The only other work of which we are aware that includes a reconstruction of the complete age structure of the population, applying survival analysis to the 1629–1631 plague in northern Italy, concluded that the young (<10 years of age) were less affected and that the risk of dying peaked much later than had been previously assumed, between ages 40 and 60 (Alfani and Bonetti Reference Alfani and Bonetti2016).
There is, however, substantial evidence that the way in which plague affected different ages might have changed during the Second Pandemic. The same seems to hold for socioeconomic status. At the time of the Black Death and in the immediate post Black Death epidemics, plague acted as a “universal killer.” From the fifteenth century, the disease acquired a social character, preferentially striking the poor (Slack Reference Slack1985; Carmichael Reference Carmichael1986; Alfani Reference Alfani2009, Reference Alfani2013a, pp. 103–107; Cohn Reference Cohn and Cavaciocchi2010). This seems to have changed again by the time of the last great plagues of the seventeenth century, which spread widely and killed socio-economic elites. In 1630 Venice, for example, 17 percent of the members of the Great Council were killed by plague, while in 1656–1657 Genoa, 40 percent of the members of the Great and Low Councils died (Pullan Reference Pullan, Ranger and Slack1992, p. 111). Particularly severe epidemics apart, plague showed a tendency to affect the poor more than the rich, no doubt due to the different urban environments in which they lived.
HOW ENVIRONMENT AND INSTITUTIONS SHAPE A PLAGUE
One of the main lessons from the study of plague is that the characteristics of the pathogen only partly explain the evolution of an epidemic. We need to take into consideration the environment in which the pathogen acts and the institutional context in which the epidemic takes place.
Environmental and Human Factors
Recent work examines the specific environmental conditions prior to the Black Death. Bruce M. S. Campbell (2010a, 2010b, 2016) suggests that “exogenous environmental factors may have played a greater and more direct role in causing the crisis of the fourteenth century than most conventional accounts of the period admit” (2010a, p. 31). This crisis includes not only the most terrible human epidemic ever, but also a prior epizootic, the “cattle plague” of 1314–1321. Weather and climatic anomalies, what Campbell dubs “physical shocks,” coincided with a biological hazard (the return of the plague to Europe) to generate the complex event we call Black Death. Campbell hints that climatic anomalies might also be associated with the onset of Justinian's Plague in the 540s (2010a, p. 14, 2016, pp. 229–30). But he admits that the evidence is mostly conjectural, and the underlying mechanism unclear (some hypotheses in 2016, pp. 286–89).
Boris V. Schmid et al. (2015) find a correlation between the 1347–1837 European plague outbreaks and episodes of environmental instability in Central Asia. They argue that climate fluctuations which led to a collapse in the local population of gerbils, increased the density of fleas per gerbil, inducing them to seek out humans as alternative hosts. As there is no evidence for climate-sensitive wildlife plague reservoirs in Europe, fluctuations in Central Asia's climate explain the timing of European plagues through a process of continuous re-infection from Asia. This hypothesis dramatically alters the current perspective of the Second Pandemic, “shifting it from a single introduction doctrine at the time of the Black Death to a climate-driven intermittent pulse of new strains arriving from wildlife rodent plague reservoirs in Asia” (Schmid et al. 2015, p. 3023). The evidence provides only partial support to their hypothesis, in part because the authors rely heavily on Biraben's relatively outdated database on the chronology and geography of plague. Additionally, the study fails to explain the absence of plague from Europe from 750–1346, when climate was no less volatile than later. It is far from clear, therefore, what might have prevented the plague from spreading westwards before 1347. Finally, recent paleo-biological studies found evidence of persistence of plague in Europe during the Second Pandemic (e.g., Bos et al. Reference Bos, Herbig and Sahl2016). Generally speaking, future plague studies will have to pay closer attention to weather and climate than in the past, and they will have to be broadened into multidisciplinary endeavors, as a pathogen like Yersinia pestis “only creates [plague] when it passes through various environments, different hosts as well as different ecosystems” (Green Reference Green2015a, p. 14).
Certain human activities arguably helped to shape the evolution of plagues. Trade is an important channel for the spread of pathogens. The main trading cities of the continent, such as Amsterdam, London, or Venice, were hit by plagues with particular frequency (Biraben 1975; Alfani Reference Alfani2013a). High levels of rural commercialization might help explain the relatively high territorial pervasiveness of plague outbreaks, as in the Low Countries (Curtis Reference Curtis2016). Humans also spread epidemics via wars. According to the traditional reconstruction, Mongols besieging the Genoese in Caffa brought the plague back to Europe in 1347. There is considerable evidence of infectious diseases, plague, typhus, or syphilis, traveling with armies. The Thirty Years War (1618–1648) seems to have been crucial in spreading plague through Germany and the rest of Central Europe (Eckert Reference Eckert1996), and war in 1629 allowed plague to infect the Peninsula when it breached quarantine barriers introduced by the Italian health officials.
The influence of the environment was not limited merely to the spread of plague; it determined the impact of plague on different groups. Rural populations typically enjoyed protection relative to urban dwellers. A rural community could be spared entirely if, like many mountain villages, it was in a relatively isolated geographical environment (Alfani Reference Alfani2013a, Reference Alfani2013b). Within cities, overall plague mortality could vary substantially by quarters. Poor housing, overcrowded spaces, and greater proximity to parasites favored the spread of plague and of other epidemics which goes a long way towards explaining why many plagues showed a tendency to affect particularly the poorest sectors of the population. In London, during 1560–1665, residents of the richest parishes were less likely to die of plague (Cummins, Kelly, and Ó Gráda 2016). In 1523 Milan, plague claimed 42 percent of its victims in just four of 60 parishes—again, the poorest and most densely-populated, where recent immigrants tended to live in exceptionally overcrowded and precarious conditions (Cohn and Alfani Reference Cohn and Alfani2007, pp. 193–94). To these unequal living conditions should also be added the inequality of treatment by governments and institutions during the health crisis, which might have contributed to the relatively high mortality rates of the poor.
The Role of Institutions
Environmental conditions and climate fluctuations interacted with human agency to shape epidemics, but human-devised institutions played a crucial role in determining their eventual spread and intensity. When the Black Death appeared, European societies were unprepared to face the threat. But as it became clear that plague was there to stay, a process of institutional and cultural adaptation occurred, a key component of how humans react to a change in their biological environment. The first two centuries following the Black Death were truly impressive. Starting in the fourteenth century with very rudimentary instruments and limited by their actual knowledge of what plague was, by the early sixteenth century urban administrators had implemented—at least in Italy, the forerunner in the introduction of effective health institutions—a broad range of policies that quite successfully prevented the spread of the infection. These interventions included health controls at mountain passes, river and sea harbors, and at political boundaries. Then, each individual state subjected its infected communities to quarantine to isolate them from the rest of the territory by means of sanitary cordons. At the local level, within each infected community, human contact was limited by quarantines and other temporary restrictions on the freedom of movement. Those infected and their families were isolated in specific structures (lazzaretti or plague wards) built at a distance from the community. Foreshadowing institutional developments that would fully materialize in the ensuing centuries, by the late fourteenth to early fifteenth centuries, permanent health boards were established, able to take action more quickly than the commissions created during states of emergency in 1348. Permanent boards could accumulate substantial human capital to fight epidemics. These boards also made it possible to monitor the international situation, assessing potential health threats, and were the only means of early warning to allow local authorities to implement measures to prevent and contain an epidemic (Cipolla Reference Cipolla1976, Reference Cipolla1981; Cohn Reference Cohn2009; Alfani and Melegaro Reference Alfani and Melegaro2010; Alfani Reference Alfani2013b).
It is no accident that these institutions were developed first in the Italian peninsula and in the broader Adriatic area. In the late Middle Ages, Italy constituted the core of the European and Mediterranean economy, and its main trading cities had reason to be particularly fearful of infection because of their vast international commercial networks. The first quarantine procedure for suspected cases of plague was introduced either in Reggio Emilia in 1374 or in Ragusa in 1377 (Cosmacini Reference Cosmacini2005; Blažina Tomič and Blažina 2015), and was immediately replicated by Genoa and Venice. The first permanent plague ward was built in 1423 on a Venetian lagoon island. Late-medieval Italian public health institutions were quickly imitated in Spain and France (Cipolla Reference Cipolla1976). However, some parts of northern Europe were slow in doing so. England, in particular, “was unlike many other European countries in having no public precautions against plague at all before 1518” (Slack Reference Slack1985, pp. 201–26). Even in the seventeenth century, England was still trying to introduce institutions that had long-since been consolidated in Mediterranean Europe. Northwestern Europe also lagged in the development of medical literature on the topic, which often came from translations of Southern European tracts. Publication of plague tracts boomed in sixteenth-century Italy and France (Cohn Reference Cohn2009). They established the state-of-the-art in terms of knowledge about the disease and usually included sections on “governing the plague” (what we would now call “policy suggestions”), based upon the consolidated experience.
Having institutions in place does not, of course, automatically mean they were effective. Carlo M. Cipolla Reference Cipolla1976, 1981) was skeptical about the usefulness of “general quarantines,” which compelled all city dwellers to remain confined to their homes during a plague, arguing that if rats and rat fleas transmitted plague, these measures could not arrest its spread, so that the huge costs implied (quarantines halted all economic activities) were sustained in vain. We now know this argument is oversimplified. As noted earlier, recent literature suggests human-to-human transmission might have been more likely, and the environmental factors shaping the spread of the epidemic more complex, than previously thought. Although medical knowledge at the time was partial at best, and in many cases wrong, we need to evaluate in a more generous way the achievements of public health institutions and the costs borne to implement anti-plague policies (Alfani Reference Alfani2013b, pp. 87–88). There is little doubt that controls between states were effective; entire territories escaped infection and local communities were forewarned. Preparation usually involved measures such as improving urban hygiene with the removal of waste or cleaning of wells. Though first introduced to fight plague, these measures became a key component of long-lasting policies to prevent contagion and were applied in similar ways when facing new health threats, such as cholera in the early nineteenth century (Alfani and Melegaro Reference Alfani and Melegaro2010).
Indeed, many recent empirical studies suggest that institutional action to contain the plague was quite effective. In 1656–1657, health authorities in Rome managed, by means of sanitary cordons, to keep some quarters infection-free. The result was an overall mortality of just 8 percent (Sonnino Reference Sonnino2006), while elsewhere in the Papal States urban mortality rates were 30–40 percent. During the same epidemic, the health institutions of the Kingdom of Naples were successful in keeping at least some regions (e.g., Sicily and most of Apulia) from becoming infected (Fusco Reference Fusco2007). But arguably the main achievement of the Italian health authorities was to make the Peninsula free of endemic plague from the mid-sixteenth century. There is clear historical evidence that all subsequent outbreaks were due to re-introduction of the infection from the outside, usually by war or trade. This might have been a mixed blessing. When war brought the plague back to Italy in late 1629, the Peninsula had been plague-free for decades and some areas had not experienced any plague since the end of the Italian Wars (1494–1559). As a consequence, the vast majority of the population had never been in contact with the pathogen, which may help to explain why this European plague wave proved exceptionally harmful to the Italian population (Alfani Reference Alfani2013a).
A final aspect of how institutions contributed to shape the consequences of plague is how they actively shifted mortality towards certain specific social-economic groups. From the fifteenth century, most plagues were particularly harsh on the poor. This has to do both with the poor's relatively unhealthy living areas, but also with how they were treated during the epidemics. Once doctors and health authorities noticed that plague mortality tended to be higher in the poorest parts of the city, they began to see the poor themselves as the potential culprits of the spread of the infection. As a result, during the early modern period their presence in cities was increasingly resented (Pullan Reference Pullan, Ranger and Slack1992; Alfani Reference Alfani2009, Reference Alfani2013b). At the onset of a plague, or even as a precautionary measure, vagrants and beggars were expelled. Other poor were isolated in specific places and institutions, often beyond the city walls, where they became easy prey to the infection (Alfani Reference Alfani2009). Interestingly, the loss of large proportions of the poor was often regarded as one of the few positive consequences of plague. As noted by a friar, Antero Maria di San Bonaventura (1658, translated and cited in Alfani Reference Alfani2013b), who was actively involved in fighting the plague in 1656–1657 Genoa,
What would the world be, if God did not sometimes touch it with the plague? How could he feed so many people? …Thus it is necessary to confess that the contagion is the effect of divine providence, for the good governance of the universe. (p. 106)
It seems certain that the marked social-economic gradient of plague mortality was partly due to the health institutions. At the same time, there is no clear evidence that officials were actively trying to have the poor killed by the infection. Unfortunately, we cannot say the same for the Jews at the time of the Black Death. Cohn (2007b, pp. 3–4) has argued that, especially in Germany and other central European areas, Jewish pogroms were not a reflection of popular mass hysteria as previously thought, but rather organized action of local elites which, using the Black Death as a motivation, found support in the city authorities. Theresa Finley and Mark Koyama Reference Finley and Koyama2016) have added that pogroms were more intense where central state institutions were weaker. This inhumane behavior seems to have been confined to the exceptional psychological and cultural context of the Black Death, as Jewish communities were not targeted during subsequent plagues, but elements of the underlying motivation might have persisted for many centuries (Voitgländer and Voth 2012).
Many explanations have been proposed for the progressive disappearance of plague from Europe from the seventeenth century. Some focus on environmental factors, stressing the potential role played by variations in the population of vectors of the disease, perhaps associated with climate change, or a process of mutual adaptation between humans and pathogens. Others focus on human action and institutional factors, including improvements in health institutions and plague management, and/or in sanitation and hygiene (McNeill Reference McNeill1976; Appleby Reference Appleby1980; Del Panta Reference Del Panta1980; Slack Reference Slack1985; Livi-Bacci Reference Livi-Bacci2000). Alfani (Reference Alfani2013a, pp. 421–23) has recently suggested that the exceptional severity and territorial pervasiveness of the last great plagues of the seventeenth century itself could have led to its disappearance through a process of mass selection and maybe immunization, possibly associated with the appearance of new and particularly aggressive pathogen strains. This argument contrasts with the older hypothesis of mutual adaptation between humans and the plague pathogen, for which there is no evidence whatsoever.Footnote 5 Yet we are still far from solving the mystery of the disappearance of plague from Europe. What is clear is that an answer can be found only by looking at the complex interaction between environmental and human/institutional factors.
ECONOMIC AND SOCIAL CONSEQUENCES OF PLAGUES
Positive or Negative Impacts in the Long Run?
Plagues have long played a central role in explanations of the rise of Europe (North and Thomas Reference North and Thomas1973; Cipolla Reference Cipolla1993), the development of resistance to pathogens (Diamond Reference Diamond1997), the creation of institutions (Epstein Reference Epstein2000), and the reorganisation of agrarian production (Herlihy Reference Herlihy1997). Recently, discussion of the long-run economic consequences of plague has been renewed in the context of the “Great Divergence” debate. Some claim the Black Death and subsequent epidemics set Western Europe on a path of quicker economic development by contributing to the creation of a “high-mortality” demographic regime and a “high-income” Malthusian equilibrium. In contrast, China and other advanced parts of Asia, which were spared or less affected by plague, became stuck in a “low-mortality,” “low-income” equilibrium (Clark Reference Clark2007, pp. 99–102). Somewhat paradoxically, by reducing the life expectancy at birth of Europeans, plague led to an improvement in the quality and scope of their lives. Indeed, there is evidence of a long-lasting improvement in European and Mediterranean real wages immediately after the Black Death (Pamuk Reference Pamuk2007; Campbell Reference Campbell2010b). Scholars who place the onset of the Great Divergence at a much later period, closer to the Industrial Revolution, do not view the epidemic as a trigger of the divergence (Pomeranz Reference Pomeranz2002), yet the timing is not impossible to reconcile. A recent study suggests that the shock of the plague was so great, and being further reinforced by increased trade, urbanisation and conflicts between states, it would have needed many generations of population growth to reverse its positive impact on real wages. This long-lasting high-income economy in turn created a favorable environment for a series of political and structural reforms, and this is what eventually opened the doors for the Great Divergence (Voigtländer and Voth 2013).Footnote 6
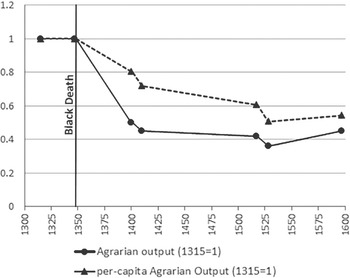
Nevertheless, it is clear that the Black Death did not produce the same positive effects everywhere. It seems that in relatively under-populated areas of Europe the Black Death set economies on a lower, not higher path of development. In Spain, where it interrupted a process of sustained growth that had begun circa 1270, “[Plague] destroyed the equilibrium between scarce population and abundant resources. Pre-Black Death per capita income levels were temporarily recovered by the late sixteenth century, but were only exceeded after 1820” (Álvarez Nogal and Prados de la Escosura 2013, p. 3). Other European areas characterized by low population density, such as Ireland, seem to have fared similarly (Kelly Reference Kelly2001). In Eastern Europe, the epidemic might have contributed to foster the so-called “second serfdom,” leading to a worsening of the peasant conditions, with long-term negative consequences (Domar Reference Domar1970; Acemoglu and Robinson Reference Acemoglu and Robinson2013, pp. 100–101), although not all agree on this point (Dyer Reference Dyer and Allmand1998, p. 111). On the other side of the Mediterranean, in Egypt, the rural depopulation caused by the epidemic led to the collapse of the irrigation system, which remained in a centuries-long condition of decay punctuated by local crashes which further complicated recovery (Borsch Reference Borsch2005, 2015). Only limited data are available for the pre-epidemic period, but what we have is consistent with the idea of a substantial and long-lasting disruption triggered by the Black Death, as shown by the evolution of agrarian output in Figure 3.
Agrarian output in Egypt, ca. 1300–1600
We must take care against arguing that all lethal epidemics behaved like the Black Death, producing positive consequences in the long run. The last great plagues of the seventeenth century affected southern Europe more severely than the North. Since this happened in a particularly competitive economic context, due partly to the opening of the Atlantic trade routes, these plagues helped shift some of the formerly most-advanced economies to a lower development path, enhancing the so-called “Little Divergence” (Alfani Reference Alfani2013b; Alfani and Percoco Reference Alfani and Percoco2016). The epidemics of the late Roman Empire also seem to have had a negative imprint on long-term growth. Although Rome eventually recovered, there is evidence that the Antonine “plague” of 160–180, which affected the Empire at the apex of prosperity, had long-lasting negative consequences for key sectors like agriculture, industry, and public building (Duncan-Jones Reference Duncan-Jones1996). The “plague” of Cyprian (249–270) acted “as an external shock to a complex, resilient system …, triggering cascading change and systemic re-organization” (Harper Reference Harper2015, p. 249). It brought forward the decline of the Empire, at least in the West. Three centuries later, Justinian's plague, the first clearly caused by Yersinia pestis, compromised the emperor's project to “renew” the Roman Empire (renovatio imperii), weakened the state military and fiscal capacity for generations, and more generally destroyed the economies and societies of large parts of Europe and the Mediterranean (Sarris Reference Sarris2002; Little Reference Little2007). Kristin N. Harper's (2016) study of Egypt, a key region of the Roman Empire, provides convincing evidence that each of the three big epidemics of Antiquity had overall negative effects. In light of this body of work, we probably need to reconsider the Black Death more as an exception in producing long-run positive effects in much of Western Europe, and most definitely not the prototypical high-mortality shock.
Lethal epidemics obviously have consequences beyond the economic realm, deeply affecting both society and culture. The Cyprian “plague,” for example, helped favor “the progress of an obscure and radical cult, Christianity, within a religious culture dominated by civic paganism” (Harper Reference Harper2015, p. 256). The sociocultural consequences of the Black Death studied in particular detail by David J. Herlihy (Reference Herlihy1997) and most recently by Cohn (1992, 2002, 2009) point out that in the short run, the Black Death precipitated Europeans into a difficult psychological condition of uncertainty and fear. In the medium- and long-run, however, Cohn (2002, p. 244) argues that the decline in overall mortality rates, which characterised subsequent plagues from the late fourteenth to the sixteenth century (mortality spiked again during the seventeenth), contributed to “the makings of a new sense of progress and even triumph over the natural world,” triggering the Renaissance. The increasingly apparent socioeconomic connotation of plague, as well as the (perceived) growing success of doctors and plague officials in fighting the disease, contributed to boost the self-confidence of the elites.
Short and Medium run: Wealth/Income Distribution and the labor Market
While we can argue about whether the long-run consequences were positive or negative, there is no doubt that in the short run major epidemics caused much harm to economy and society, not to mention the psychological damage to the population. Communities affected by plague suffered heavy costs from the disruption of trade and economic activity, the destruction of human and physical capital (to purge the city of materials considered at risk of spreading the contagion), and the resources used during the crisis to contain the epidemic (Alfani Reference Alfani2013b, pp. 95–103). Social structures and local trust and solidarity networks were also placed under considerable strain, as “one Citizen fled after another, and one neighbor had not any care of another. Parents nor kindred never visiting them, but utterly they were forsaken on all sides” (Boccaccio, Decameron, 1350).
Two particular consequences of lethal epidemics in the short- and medium-term have gained considerable recent attention: distribution and the labor market. Almost 50 years ago, in a comparative survey of Egypt, England, and Italy, Robert S. Lopez, Harry A. Miskimin, and Abraham Udovitch (1970) expanded upon a classic article on the economic conditions during the Renaissance by Lopez and Miskimin (Reference Lopez and Miskimin1962), and argued, without evidence, that the economic dislocation caused by the Black Death led to a polarization of wealth and income distributions. David Herlihy, a student of Lopez, was the first to provide archival information about distributions of wealth before and after the Black Death in two Tuscan villages (Herlihy Reference Herlihy1967, 1968). Using medieval estimi (property tax records) as well as the famous Florentine Catasto of 1427, he claimed that in both villages, the Black Death triggered a growth in inequality as a consequence of a weakening in numbers and collective assets of the “middle class.” This process was strengthened by inheritance systems and managerial factors (Herlihy Reference Herlihy1967). Herlihy further generalized from these results: “the highly skewed distribution of wealth in the fifteenth-century was a comparatively new development, and (...) wealth had been somewhat more evenly distributed across the population in the thirteenth century, before the onslaught of the great epidemics” (Herlihy Reference Herlihy, Abrams and Anthony Wrigley1978, p. 139).
For decades, Herlihy's pioneering studies remained the only attempts to directly measure the Black Death's distributional consequences. With a revival of archival-based research on pre-industrial economic inequality, this has changed. The new findings question the previous results. A case study of Piedmont in northern Italy found that between 1300 and 1800, the Black Death was the only event associated with a decline not an increasein inequality; a decline that lasted for a century (Alfani Reference Alfani2015). These initially unexpected results led to further archival work. For Tuscany, Alfani and Francesco Ammannati (2017) discovered further evidence of a decline in inequality following the epidemic. They argue that Herlihy's results were driven by the fact that he had not standardized his sources. Properly compared, the Black Death triggered a decline in inequality, albeit less long-lasting than in Piedmont. Far from causing a polarization of societies, as originally argued by Lopez and Miskimin, the Black Death was exceptional in spreading wealth across the entire society, as illustrated in Figure 4 for one Tuscan town (see additional examples in Alfani and Ammannati Reference Alfani and Ammannati2017). In other areas such as Emilia-Romagna (northern Italy) and southern France, similar trends are found. All the evidence indicates that the Black Death can be linked to a decline in economic inequality.
Wealth distribution (Lorenz curves) pre- and post-Black Death in Prato (Italy)

These findings on the distributional effects of the Black Death raise at least two questions. The first relates to the potential mechanism behind the decline in inequality. Cipolla, in his critique of Lopez and Miskimin, suggested that “the Malthusian checks [i.e., the Black Death] probably caused a redistribution of income through a rise in real wages” (Cipolla Reference Cipolla1964, p. 524). While he had no evidence, Cipolla was right in arguing that an inequality decline after a severe mortality crisis is what we should expect. As labor becomes more scarce, real wages increase, reducing labor income inequality. Recent research in real wages provides solid evidence that this was indeed the case following the Black Death (Pamuk 2007; Pamuk and Shatzmiller Reference Pamuk and Shatzmiller2014). Wealth inequality and consequently, capital income inequality are also likely to decrease, as a larger stratum of population has both the means (due to higher wages) and the opportunity (due to more and cheaper real estate on the market in the aftermath of the plague) to gain access to property.
The second question is why subsequent plagues, particularly the ones in the seventeenth century, did not trigger similar processes of inequality reduction. Research is needed but some ideas suggest themselves. One line of argument focuses on institutional adaptation following the return of plague in the fourteenth century. Although inheritance systems throughout Italy were partible before and after the Black Death, the crisis led to the spread of institutions to protect the largest patrimonies from the risk of dispersion. Fideicommissum, which guaranteed that a well-defined set of family properties were transferred unaltered from one generation to the next, is probably the most common and well known (Cohn Reference Cohn1992). This and similar institutions made patrimonies more resilient to mortality crises, but entrenched wealth inequality (Alfani Reference Alfani2010). Another factor to consider is that the Black Death caused such a large-scale shock to pre-existing social and economic structures precisely because it was unexpected. Something similar seems to have happened with the great “plagues” of Antiquity. In a forthcoming book, Walter Scheidel (Reference Scheidel2017) suggests that the collapse of the Roman Empire (which was arguably epidemic-induced) led to inequality decline both in Italy and in the provinces, Britain included.
Additionally, post-Black Death plagues did not produce the same positive consequences in terms of increase in real wages and improved living standards. One explanation can be found in the changes in mortality per socioeconomic status noted earlier. If an epidemic eliminates part of the low-status, unskilled population only and affects the cities, sparing the country, then its consequences on real wages may be minimal for both skilled and unskilled workers, as the country can typically supply the city with unskilled workers. Only the worst seventeenth-century plagues were Black Death-like in overall mortality rates and in territorial pervasiveness. In Italy, in particular, the 1629–1631 and 1656–1657 plagues were universal killers affecting all strata of society resulting in an increase in real wages paid to skilled workers after the plagues—but additional skilled workers were nowhere to be found. Each city tried to keep its own workers and attract others, but labor shortages were crippling, for example in Venice (Pullan Reference Pullan1964, p. 422) or Cremona (Andreozzi Reference Andreozzi and Cavaciocchi2010). The available data on urban production (especially textiles) show that the plague displaced the production trend to a lower path (Alfani Reference Alfani2013a, pp. 18–19). More generally it has been argued that given the specific context of the southern European seventeenth century plagues, the mass destruction of human capital caused an exceptionally serious productivity shock to the economies of many relatively advanced areas. In particular, the 1629–1630 plague affected the northern Italian economies at the worst possible moment, when their manufactories were dealing with increasing competition from northern Europeans, relatively spared by plague in that century (Alfani Reference Alfani2013a; Alfani and Percoco Reference Alfani and Percoco2016).
The consequences of plagues and other lethal epidemics for the labor market are worthy of further research. As with income distribution, it is unlikely all epidemics affected labor markets in the same way. The outcome probably depended on the structure and level of mortality, on the territorial pervasiveness of the epidemic, as well as on the specific historical context in which the crisis occurred. Not even for the Black Death are the consequences as clean-cut as sometimes presumed. Some recent studies show that while in the medium- and long-run real wages rose across Europe after the Black Death, in the short run the labor market did not seem to react as if exclusively driven by economic logic. Indeed, post-plague labor legislation could pursue a range of dissimilar objectives (Munro Reference Munro2003; Cohn Reference Cohn2007a). In many instances the focus was on ensuring public order, preventing the lower classes from acquiring contractual power and thus compromising the relative position of elites. The elites in turn needed reassuring as they collectively suffered from psychological fragility, which fostered end-of-the-world social behaviors, from the flagellant movement to the persecution of Jews and other minorities. Policies took the form of decrees contra laboratores(“against the laborers”) aimed at containing the “greed” of the lower classes. A surprising consequence of such pro-elite labor legislation was that in many places, in the aftermath of the Black Death real wages declined in the short run rather than increasing (Cohn Reference Alfani and Cohn2007). Even in relatively liberal Florence, a certain flexibility in the urban labor market was coupled with strict controls “against” rural workers, to prevent them from profiting from the situation. The conclusion is that in relations to economics and demography “politics may have played a larger role in determining who might benefit or suffer from a government's particular vision of the rightful order of things and the ‘just price'” (Cohn Reference Alfani and Cohn2007, pp. 475–76, 2016).
The Black Death seems to have affected labor markets differently across Europe by favoring female participation in the North. According to Tine De Moor and Jan-Luiten Van Zanden Reference De Moor and Van Zanden2010), the growth in labor demand triggered by the epidemic led many women to enter the labor market. This change in behavior proved to be long-lasting, affecting in a positive way both culture, as it led to more balanced relationships between genders, and the economy by deepening markets. De Moor and Van Zanden argued that this did not happen in southern Europe, or happened to a lesser extent. There the dowry system dis-incentivized female labor by limiting women's ability to inherit from their deceased husbands the resources collectively cumulated by the household during the marriage. More generally, they argue the Black Death favored the establishment of the “European Marriage Pattern” (Hajnal Reference Hajnal, Glass and Eversley1965) across Western Europe, which is also often considered a potential cause of long-term economic divergence. These arguments, in turn, have been challenged (Dennison and Ogilvie Reference Dennison and Ogilvie2014) and triggered an active debate (Carmichael et al. Reference Carmichael, de Pleijt and Luiten Van Zanden2016; Dennison and Ogilvie Reference Dennison and Ogilvie2016).
PRE-INDUSTRIAL PLAGUES AND MODERN “PLAGUES”
Plagues and other lethal epidemics played a key role in shaping economic, social, institutional, and cultural change in the past. They also provide useful insights for understanding better current developments. Take, for example, the institutions put in place internationally to organize the fight against health threats. A clearly-recognizable ligne rouge connects the permanent health boards introduced by many cities in the late Middle Ages, to the monitoring systems of regional states in the early modern period, to the nineteenth century's national health authorities introduced in response to the arrival of cholera, to the global system of international cooperation epitomized in the creation of the WHO in 1948. Practically all the policies developed to fight the plague (e.g., quarantines, health certificates, isolation of patients, and cleansing of the urban environment) continue to number among the key tools to fight epidemics (Alfani and Melegaro Reference Alfani and Melegaro2010).
Even more clearly, pre-industrial plagues constitute the model against which we tend to compare modern “plagues.” In some instances, this has to do with the exceptional lethality and transmissibility of new infections, most recently Ebola, a viral hemorrhagic fever. The first outbreaks occurred in Sudan and Congo in 1976 and immediately attracted attention due to horrifically high lethality rates (25 percent to 90 percent, depending on the outbreak). Fear was somewhat contained, because, until recently, the worst Ebola epidemic (Uganda in 2000–2001) involved “only” 224 confirmed deaths, partly due to the speed and effectiveness with which the virus killed its hosts. This changed in 2014–2016, when a large-scale epidemic affected Liberia, Guinea, and Sierra Leone, causing 28,646 known cases and 11,323 deaths; a lethality rate of almost 40 percent (WHO 2016a, 2016b). A few cases were reported outside Africa, including in western countries, which greatly contributed to the global scare. Almost immediately, studies appeared directly contrasting Ebola with plague, focusing on their shared ability to induce terror (Green 2015c) as well as on some similarities in their epidemiological characteristics (some of which had already been pointed out by Duncan and Scott Reference Duncan and Scott2001). In particular, Cormac Ó Gráda (2015) has underlined that both infections are highly lethal, have similar (long) incubation times, and when they first appeared no cure was available—three factors that also increased their ability to cause panic.
Terror and panic, however, are not restricted to killing infections like Ebola. There are commonalities in the reaction of individuals and societies to epidemic threats that are, in a sense, less “rational” being largely independent from actual mortality levels. For example, the scare caused in the West by the emergence of the SARS virus in 2003, or the so-called “swine flu” in 2009–2010, when fear was to a large degree the consequence of the initial overreporting of lethality in Mexico (Alfani and Melegaro Reference Alfani and Melegaro2010). Similarly with Zika, which at the time we are writing is causing much alarm in connection to the 2016 Olympics in Brazil, both because athletes and tourists fear becoming infected, and because this might be an opportunity for the virus to spread quickly to other parts of the world (Attaran Reference Attaran2016). Notwithstanding the radical difference from plague, the traditional cultural framework used to elaborate on killing epidemics has been employed extensively, with the Zika infection being emphatically compared to a “biblical plague,” or to the bubonic plague itself.
One final consideration is that Yersinia pestis is far from having been eradicated. It has to be considered a re-emerging infectious disease, one which is currently endemic in different continents (Africa, Asia, and the Americas) and which needs special surveillance both because it is considered a potential weapon for bioterrorists (Butler Reference Butler2013) and because it is spontaneously becoming resistant to antibiotics (Ziegler 2015). This last factor has also provided an opportunity for interesting comparative research aimed at estimating the huge welfare gains to be derived from the disappearance of plague and other diseases from Europe (Ó Gráda 2016). Accounting for these gains clarifies how much we have to lose, which is a final, important reason for continuing in the historical exploration of the factors shaping past plagues and other lethal epidemics, and of their multi-faceted consequences for human societies.



