1 INTRODUCTION
In the last decade, wide-field extragalactic transient surveys—such as the Palomar Transient Factory (PTF; Rau et al. Reference Rau2009; Law et al. Reference Law2009), the Panoramic Survey Telescope and Rapid Response System (PanSTARRS; Kaiser et al. Reference Kaiser, Stepp, Gilmozzi and Hall2010), the Catalina Real-time Transient Survey (CRTS; Drake et al. Reference Drake2009), the Texas Supernova Search (Quimby Reference Quimby2006; Yuan Reference Yuan2010), and the All-Sky Automated Survey for Supernovae (ASAS-SN; Shappee et al. Reference Shappee2014; Holoien et al. Reference Holoien2016)—have revolutionised our understanding of the myriad ways in which stars explode through the discovery of new classes of exotic transients. Simultaneously, these surveys have discovered hundreds of supernovae (SNe) of ‘traditional’ types (see Filippenko Reference Filippenko1997, for a review), enabling statistical analyses of the properties of these SNe.
Whilst imaging surveys have provided discovery and light curves for this wealth of new transients, complementary spectroscopy surveys have provided the critical insight into the physical origins of these events. Numerous supernova spectroscopy surveys have released thousands of high-quality spectra of nearby SNe into the public domain (Matheson et al. Reference Matheson2008; Blondin et al. Reference Blondin2012; Silverman et al. Reference Silverman2012c; Folatelli et al. Reference Folatelli2013; Modjaz et al. Reference Modjaz2014). These surveys have frequently been dedicated to the spectroscopic follow-up of Type Ia supernovae (SNe Ia) which, due to their rates and luminosities, dominate any magnitude-limited imaging survey. Such surveys have revealed that photometrically similar SNe can still exhibit diversity of spectroscopic behaviour, indicating spectra remain a critical tool for revealing the full nature of the supernova progenitors (particularly for SNe Ia). Additionally, spectra remain critical for supernova classification—particularly at early phases when the full photometric evolution has yet to be revealed. Such early classifications then inform the use of additional SN follow-up facilities, including those operating outside the optical window.
Recently, the Public ESO Spectroscopic Survey for Transient Objects (PESSTO; Smartt et al. Reference Smartt2015) began a multi-year programme on the NTT 3.6-m telescope in Chile, with the goal of obtaining high-quality spectral time series for roughly 100 transients (of all kinds) to be released to the public. This survey has already released hundreds of spectra in its first two annual data releases, and continues to release all SN classification spectra within typically 1 d from observation. Other ongoing SN spectroscopy programmes, such as the Asiago Supernova Programme (Tomasella et al. Reference Tomasella2014), also make important contributions to the transient community through timely SN classification and spectroscopy releases.
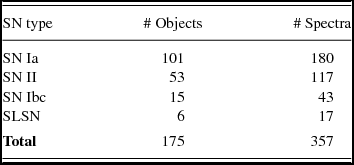
Here, we describe our ongoing spectroscopy programme AWSNAP—the ANU WiFeS SuperNovA Programme—which uses the Wide Field Spectrograph (WiFeS; Dopita et al. Reference Dopita, Hart, McGregor, Oates, Bloxham and Jones2007, Reference Dopita2010) on the Australian National University (ANU) 2.3-m telescope at Siding Spring Observatory in Australia. In this paper, we describe the data processing procedures for this ongoing programme, and describe the first AWSNAP data release (AWSNAP DR1) comprising 357 spectra of 175 supernova of various types obtained during 82 classically scheduled observing nights over a 3-yr period from 2012 July to 2015 August. Most of these spectra have been released publicly via the Weizmann Interactive Supernova data REPository (WISeREPFootnote 1 — Yaron & Gal-Yam Reference Yaron and Gal-Yam2012), with the remainder set to be released within the next year as part of forthcoming PESSTO papers. This programme will continue to observe SNe of interest and classify SN discoveries from transient searches such as the new SkyMapper Transients Survey (Keller et al. Reference Keller2007). We aim to release future SN classification spectra from AWSNAP publicly via WISeREP in parallel with any classification announcements.
This paper is organised as follows. Section 2 describes the WiFeS data processing and SN spectrum extraction procedures. Section 3 presents general properties of our SN sample and compares AWSNAP DR1 to other public SN spectra releases. In Section 4, we present some analysis of the properties of the SNe Ia in our sample, including measurement of narrow sodium absorption features afforded by the intermediate resolution of the WiFeS spectrograph. Some concluding remarks follow in Section 5.
2 OBSERVATIONS AND DATA DESCRIPTION
Observations for AWSNAP were conducted with the WiFeS—(Dopita et al. Reference Dopita, Hart, McGregor, Oates, Bloxham and Jones2007, Reference Dopita2010) on the ANU 2.3-m telescope at Siding Spring Observatory in northern New South Wales, Australia. Observing nights were classically scheduled with a single night of observing every 8–15 d. On some occasions, special objects of interest were observed during non-AWSNAP nights. A full list of the AWSNAP transient spectra is presented in Table A3 in Appendix A. In the sections that follow, we describe the processing of the WiFeS data, then characterise both the long-term performance of the WiFeS instrument and observing conditions at Siding Spring.
2.1. Data reduction and supernova spectrum extraction
The WiFeS instrument is an image-slicing integral field spectrograph with a wide 25 arcsec × 38 ′′arcsec field of view. For AWSNAP, this frequently provided simultaneous integral field observations of SNe and their host galaxies. The WiFeS image slicer breaks the field of view into 25 ‘slitlets’ of width 1 arcsec, which then pass through a dichroic beamsplitter and volume phase holographic (VPH) gratings before arriving at 4k × 4k CCD detectors. AWSNAP observations were always conducted with a CCD binning of 2 in the vertical direction—this sets the vertical spatial scale of the detector to be 1 arcsec, yielding final integral field elements (or ‘spaxels’) of size 1 arcsec × 1 arcsec. Typically seeing at Siding Spring is roughly 2 arcsec (see Section 2.3).
The VPH gratings utilised by WiFeS provide a higher wavelength resolution than traditional glass gratings. The low- and high-resolution gratings provide resolutions of R = 3000 and R = 7000, respectively, yielding velocity resolutions of up to σv ~ 45 km s−1 which is ideal for observing nebular emission lines from ionised regions in galaxies. For SNe, this can reveal narrow absorption features (see Section 4.2) from circumstellar material (CSM) which are typically smeared out by lower resolution spectrographs. AWSNAP observations were generally conducted with the lower resolution B3000 and R3000 gratings for the blue and red arms of the spectrograph, respectively, with the RT560 dichroic beamsplitter. Occasionally, the R7000 grating was deployed on the red arm to provide higher resolution observations of sodium absorption features. In Table 1, we provide the wavelength range, spectroscopic pixel size, and wavelength resolution (determined as the FWHM of calibration lamp emission lines) for the three gratings used for AWSNAP observations.
Details of WiFeS gratings.

Data for AWSNAP observations were reduced with version 0.7.0 of the PyWiFeS pipeline (Childress et al. Reference Childress, Vogt, Nielsen and Sharp2014a). PyWiFeS performs standard image pre-processing such as overscan and bias subtraction, as well as cosmic ray rejection using a version of LACosmic (van Dokkum Reference van Dokkum2001) tailored for WiFeS data. The wavelength solution for WiFeS is derived using an optical model of the spectrograph which achieves an accuracy of 0.05 to 0.10Å (for R = 7000 and R = 3000, respectively) across the entire detector. Spectral flatfielding (i.e. correction of pixel-to-pixel quantum efficiency variations) is achieved with an internal quartz lamp, whilst spatial flat-fielding across the full instrument field of view is facilitated by twilight sky flats. Once the data has been pre-processed and flat-fielded, it is resampled onto a rectilinear three-dimensional (x, y, λ) grid (a ‘data cube’). We then flux calibrate the data cubes with the use of spectrophotometric standard stars (from, e.g. Oke Reference Oke1990; Bessell Reference Bessell1999; Stritzinger et al. Reference Stritzinger, Suntzeff, Hamuy, Challis, Demarco, Germany and Soderberg2005) and the Siding Spring Observatory extinction curve from Bessell (Reference Bessell1999), whilst telluric features are removed using observations of smooth spectrum stars.
To further facilitate data reduction for the AWSNAP data release, we developed an SQL database for WiFeS observations using the Python Django framework. We created modified versions of the PyWiFeS reduction scripts that allow the user to request that all data from a specific night using a specific grating be fully reduced. The reduction scripts then query the database for all science observations and calibration data from that night and perform the required reduction procedures. For nights where a full suite of calibrations was not available (e.g. due to guest observations on a non-AWSNAP night), calibration solutions from the closest (in time) AWSNAP night were automatically identified via the database and employed in the reduction. Both the wavelength solution and spatial flat-fielding of the instrument are incredibly stable on long (~year) timescales (see Section 2.2), thus validating the choice to use calibrations from different nights where necessary. This new database-driven data processing mode for PyWiFeS will be an important component of the upcoming effort to develop fully robotic queue-based observing capabilities for the ANU 2.3-m telescope.
The output of the PyWiFeS pipeline is a flux calibrated data cube that contains signal from the target supernova, the night sky, and occasionally the SN host galaxy. Extraction of the SN spectrum requires isolation of the spaxels containing supernova signal and subtraction of the underlying sky (and possibly galaxy) background. To achieve this, we constructed a custom Python-based GUI which allows the user to manually select spaxels containing the target SN (‘object’ spaxels) and spaxels used to determine the background (‘sky’ spaxels, which may contain some galaxy signal). The background spectrum is determined as the median spectrum across all ‘sky’ spaxels, and this median spectrum is subtracted from each ‘object’ spaxel. The final SN spectrum is then the sum of the sky-subtracted object spaxels, and the variance spectrum is the sum of the variance from all object spaxels (with no subtraction of sky variance).
This SN spectrum extraction technique produces excellent quality sky subtraction due to the robust spatial flat-fielding achieved with PyWiFeS. However, some obvious sky subtraction residual features are evident in the redder wavelengths of most R3000 spectra where the night sky exhibits sharp emission features from rotational transitions of atmospheric OH molecules. The intrinsic line width of these emission lines is below the resolution of the spectrograph, meaning the observed line width is that of the spectrograph—which in this case is only slightly larger than the detector pixel size. The natural wavelength solution of the spectrograph shifts spaxel-to-spaxel, so when all spaxels are resampled onto the same wavelength grid this means sky lines experience pixel-wise resampling that is not uniform across the full instrument field of view. Thus, when a median sky spectrum is subtracted from a specific spaxel, some residual features arise due to this resampling effect. A more robust technique for correcting this would be to model the intrinsic sky spectrum using the multiple samplings achieved across all spaxels and resample it to the wavelength solution of each spaxel before subtracting it (as was demonstrated for two-dimensional spectroscopic data by Kelson Reference Kelson2003). Such a technique is beyond the scope of the current data release, but is being prioritised for future AWSNAP releases.
2.2. Long-term behaviour of the WiFeS instrument
One key advantage of having a long-running observing programme is the ability to characterise the long-term behaviour of the WiFeS instrument. Below we analyse the stability of the wavelength solution and instrument throughput on multi-year timescales. WiFeS did undergo a major change in early 2013 when the detectors for both arms of the spectrograph were replaced with higher throughput E2V CCDs. Thus, we restrict our analysis to dates from late 2013 May until the end of the current data release in 2015 August.
We collected the wavelength solution fits for the B3000 (R3000) grating from 48 (45) distinct epochs following the WiFeS detector upgrade. In Figure 1, we plot the difference between the wavelength solution for each individual epoch and the mean wavelength solution across all epochs. Epochs are colour-coded from earliest (red) to latest (purple) to illustrate potential coherent long-term shifts in the wavelength solution. The top panels present the B3000 grating, whilst the bottom panels present the R3000 gratings. The left and middle columns represent the WiFeS slitlets at the top and middle of the detectors, respectively. In the right hand panels of this Figure, we show the average deviation of the wavelength solution for a given epoch from the global mean wavelength solution, as a function of epoch. This allows us to track any coherent evolution of the detector wavelength solution with time.
Evolution of the WiFeS wavelength solution over a 2-yr period spanning 2013 May to 2015 April. In the left two panels of each row, we plot the deviation of individual wavelength solutions from the mean solution (averaged over the full 2-yr period) for the top and middle slitlets of the instrument (left and middle columns, respectively) for the B3000 (top row) and R3000 (bottom row) gratings. Wavelength solution residuals are colour-coded by date from earliest (red) to latest (purple), with the pixel size (dashed black lines) and wavelength solution residual RMS (solid black lines) displayed for comparison. In the right panels of each row, we show the average deviation (across all wavelengths) from the mean wavelength solution as a function of epoch, to trace the temporal evolution of the instrument solution (points for individual epochs obey the same colour scheme as the left panels).

From these plots, we see clear demonstration of the remarkable stability of the WiFeS instrument. The RMS variation of wavelength solution is smaller than a single pixel for both gratings (i.e. both detectors) for nearly all wavelengths, with the exception of the lower throughput regions near the dichroic boundary. There is some evidence of a coherent shift of the blue detector wavelength solution over the 2-yr time period probed here, but this is still less than two pixels shift. For the red detector, we can say confidently that the wavelength solution has shifted by less than a pixel over a timescale of 2 yrs. This remarkable stability achieved (by design) by WiFeS means the use of the wavelength solution from an adjacent night yields negligible changes in wavelength, and thus small instrumental velocity shifts—highly suitable for supernova analyses.
We then collected illumination corrections (derived from twilight flat observations) from 46 (45) distinct epochs for the B3000 (R3000) grating. In Figure 2, we show the mean illumination correction (left panels) and RMS of the illumination correction (right panels—presented in fractional form, i.e. the RMS divided by the mean) for both the B3000 (top) and R3000 (bottom) gratings. We find the mean variation of the illumination correction to be 1.4 and 1.2% for the B3000 and R3000 gratings, respectively, for the full WiFeS field of view. The nature of the instrument optics are such that the outer regions of instrument field of view have slightly lower throughput, and thus a higher fractional RMS than the inner most region. For the innermost 8 arcsec × 8 arcsec region typically used for SN observation in AWSNAP, the RMS of the illumination correction is 0.8 and 0.3% for the blue and red detectors (i.e. B3000 and R3000 gratings). Thus, the throughput of the WiFeS instrument has remarkable spatial uniformity on long (multi-year) timescales.
The normalised mean (left column) and RMS (right column) of the illumination corrections for the B3000 (top row) and R3000 (bottom row) gratings. The RMS images are shown as fractional values of the mean illumination correction.

2.3. Observing conditions at siding spring observatory
In addition to the long-term behaviour of the WiFeS instrument, our observing programme allows us to monitor the observing conditions at Siding Spring Observatory. Below we briefly discuss the atmospheric throughput and seeing conditions experienced during AWSNAP observing.
We collected the flux calibration solutions from 59(54) epochs for the B3000 (R3000) grating from 2013 May to 2015 August, and these are plotted in Figure 3 after being normalised in the wavelength range with highest throughput (45 00–5 400 Å and 6 500–8 000 Å for B3000 and R3000, respectively). These curves represent the normalised throughput (in magnitudes) of the instrument and atmosphere as measured with spectrophotometric standard stars (typically from Oke Reference Oke1990; Bessell Reference Bessell1999; Stritzinger et al. Reference Stritzinger, Suntzeff, Hamuy, Challis, Demarco, Germany and Soderberg2005) whose flux has already been corrected using the nominal Siding Spring extinction curve from Bessell (Reference Bessell1999). The effects of the instrument throughput and atmospheric transmission are degenerate here, as WiFeS instrument throughput cannot be independently measured using local (i.e. terrestrial) calibration sources.
Flux calibration solutions for the B3000 (top) and R3000 (bottom) gratings. As in Figure 1, these are colour-coded by date from earliest (red) to latest (purple), with the mean flux calibration solution shown as the solid black line.

From the curves in Figure 3, we see that the total combined throughput of the instrument plus atmosphere is relatively stable. We calculated the RMS colour variation in the throughput curves and find variations of σ(U − B) = 0.09 mag for B3000 (note the V band runs into the wavelength range where the dichroic splits light between the blue and red channels) and σ(r − i) = 0.04 mag for R3000. We note these are calculated from the mean flux calibration solution for each night, where no attempt has been made to derive a unique extinction curve for a given night. These colour variations are relatively small, and comparable in size to the colour dispersion found when comparing spectrophotometry to imaging photometry for other SN spectroscopy samples (e.g. Silverman et al. Reference Silverman2012c; Blondin et al. Reference Blondin2012; Modjaz et al. Reference Modjaz2014).
We also measured the atmospheric seeing during our observing programme, using both guide star FWHM measurements recorded from the WiFeS guider camera and low airmass (secz ⩽ 1.5) WiFeS data cubes convolved with the B- and R-band filter curves (for the blue and red cameras, respectively). We plot the observed distribution of seeing values in Figure 4. The seeing distribution peaks slightly above 1.5 arcsec (for all measurements) with a tail predominantly filled to 2.5 arcsec, with little or no sub-arcsecond observations and a small number of observations with incredibly poor seeing (3.0 arcsec or greater).
Seeing measurements at Siding Spring Observatory as measured during AWSNAP observations. These include measurements from the WiFeS guider camera (green dash-dot histogram), and measurements of low airmass standard star WiFeS datacubes convolved with B-band (blue solid histogram—from the blue detector) and R-band (red dashed histogram—from the red detector) filter curves.

3 THE AWSNAP SUPERNOVA SAMPLE AND SPECTROSCOPIC DATA RELEASE
In this Section, we briefly describe the global characteristics of the sample of SNe comprising the first data release (DR1) for AWSNAP. This consists of observations made between 2012 July18 and 2015 August17, a total of 357 epochs of 175 total SNe. These spectra have all been uploaded to WISeREP (Yaron & Gal-Yam Reference Yaron and Gal-Yam2012), with most made publicly available and the small remainder set to be made public with the associated PESSTO publication within the next year. Some additional spectra taken after 2015 August 17 have been processed and released via WISeREP, and we expect the future release of AWSNAP spectra to proceed in a continuous fashion via the same procedures outlined in this work.
AWSNAP originated as the spectroscopic observation programme for the supernova group at the ANU. The programme was intended to cover a broad range of science topics driven by transient discoveries from contemporaneous photometric surveys, with a large emphasis on timely classification of newly discovered transients. The observing and target selection strategy for AWSNAP was heavily influenced by the scheduling of our observing time, which typically consisted of one single classically scheduled full night of observing every 8–15 d throughout the entirety of the calendar year. The most significant implication of this scheduling was that dense spectroscopic sampling (i.e. 2–3 d cadence) was generally not viable for our preferred targets (though on rare occasions we requested time exchange with other observers for targets of particular importance). Furthermore, additional targets were always needed to fill an entire night of observing. Thus, we frequently chose to make complementary observations of targets being observed through the PESSTO programme (Smartt et al. Reference Smartt2015), or chose targets whose spectroscopic data would have legacy value for future analyses. As a result, we observed a diverse range of targets that covered the entire Southern sky. The full list of targets and their classification information in presented in Table A1 in Appendix A, and their distribution on the sky is shown in Figure 5.
On-sky distribution (in equatorial coordinates) of all extragalactic targets in AWSNAP DR1 (white diamonds) plotted over the 857 GHz all-sky map from the Planck satellite (Planck Collaboration et al. 2011) which reveals emission by Milky Way dust. The physical pointing limit of the ANU 2.3-m telescope (~+40° declination) is shown as the solid gray bar.

The AWSNAP spectra have relatively high signal-to-noise (S/N) by design so that they might be useful for precision spectral feature measurement. Our sample’s median S/N is 16 per Å, with 1σ high and low S/N values of 40 and 6 per Å, respectively. We show some example AWSNAP spectra in Figure 6 exhibiting low (− 1σ), medium (median), and high (+ 1σ) S/N.
Example spectra spanning the typical range of signal-to-noise (S/N) in the AWSNAP sample. Shown here are spectra of SN 2012dt (a SN II, with a ‘low’ S/N of 5 per Å), ASASSN-15ba (a SN Ia, with a ‘medium’ S/N of 13 per Å), and SN 2012dj (a SN Ib, with a ‘high’ S/N of 33 per Å).

In Figure 7, we present a histogram of the number of spectroscopic observations per target for the AWSNAP sample compared to three major SN Ia spectroscopic data releases: the Berkeley SN Ia Programme (BSNIP; Silverman et al. Reference Silverman2012c), the Harvard Center for Astrophysics (CfA) Supernova Programme (Matheson et al. Reference Matheson2008; Blondin et al. Reference Blondin2012), and the Carnegie Supernova Project (CSP; Folatelli et al. Reference Folatelli2013). Our sample has a high fraction of singly observed targets compared to the other programmes. This is in part due to the fact that our data release includes all our SN classification spectra, as well as the persistent need for us to fill our classically scheduled observing queue. We thus also show in the inset of Figure 7 the normalised histogram of spectroscopic epochs for multiply observed SNe (i.e. targets with N obs > 2), which shows a much more similar distribution to the other programmes.
Normalised histogram of the number of spectroscopic epochs per target for the full sample of AWSNAP DR1 targets. For comparison, we also show the same histogram for previous SN spectroscopy surveys: BSNIP (Silverman et al. Reference Silverman2012c), CfA (Matheson et al. Reference Matheson2008; Blondin et al. Reference Blondin2012), and CSP (Folatelli et al. Reference Folatelli2013). The inset shows the (re-)normalised histograms of the number of spectroscopic epochs for multiply observed targets (i.e. those with N obs > 1) in the same surveys.

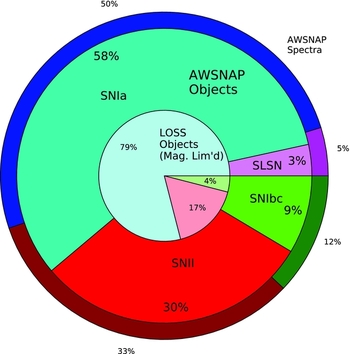
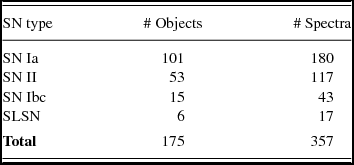
The types of SNe observed in AWSNAP DR1 is summarised in Table 2 and presented graphically in Figure 8. We show both the number of targets and number of spectra for AWSNAP, and for reference we compare this to the magnitude-limited rates for SNe in the local universe calculated by Li et al. (Reference Li2011a). For this figure, we have grouped the SNe by type into four main categories:
-
• SNe Ia: includes the standard (Branch-normal) SNe Ia, sub-luminous (SN 1991bg-like Filippenko et al. Reference Filippenko1992a), over-luminous (SN 1991T- and SN 1999aa-like Filippenko et al. Reference Filippenko1992b), candidate ‘super-Chandrasekhar’ SNe Ia (Scalzo et al. Reference Scalzo2010, Reference Scalzo2012), and SNe Iax (Foley et al. Reference Foley2013).
Figure 8.Total number of spectra (outer ring) and SN targets (middle annulus) for AWSNAP broken down by SN type, compared to the volume-limited SN rates (inner circle) for the LOSS survey (Li et al. Reference Li2011a, —note this galaxy-targeted survey did not find any SLSNe). In each ring, the regions are colour-coded by (broad) SN type (see text for discussion): SNe Ia (blue), SNe II(red), SNe Ib/Ic (green), and SLSNe (purple).
 Table 2.
AWSNAP objects and spectra by SN type.
-
• SNe Ibc: SNe Ic, SNe Ib, and SNe IIb—the standard classes of ‘stripped-envelope’ SNe (e.g. Bianco et al. Reference Bianco2014; Modjaz et al. Reference Modjaz2014; Graur et al. Reference Graur, Bianco, Modjaz, Maoz, Shivvers, Filippenko and Li2015; Liu et al. Reference Liu, Modjaz, Bianco and Graur2016).
-
• SNe II: SNe IIP and SNe IIL—which we note cannot be distinguished spectroscopically—and SNe IIn.
-
• SLSNe: ‘superluminous’ SNe—for our sample, this consists entirely of the ‘SLSN-Ic’ type (see, e.g. Inserra et al. Reference Inserra2013) which show blue continua with weak absorption features and no hydrogen signatures.

We note these groupings are made strictly to provide broad perspective on the sample statistics, but we reiterate that the SN sub-types within each group have their own unique physical mechanisms.
From Figure 8, we clearly see that, as expected, SNe Ia comprise the majority of objects and spectra in the AWSNAP sample, but comprise a smaller fraction than might be expected from a pure magnitude limited sample of SNe such as that of the Lick Observatory Supernova Search (LOSS, whose relative SN rates are presented in Li et al. Reference Li2011a). This may be due in part to the fact that many of the SNe in AWSNAP were discovered by untargeted supernova searches such as the ASAS-SN (Shappee et al. Reference Shappee2014). These surveys find SNe in low-mass galaxies that are missed by targeted surveys such as LOSS. Due to the increased star-formation intensity in low-mass galaxies (e.g. Salim et al. Reference Salim2007), this means the relative rate of core-collapse SNe will be higher and thus CCSNe will comprise a higher fraction of the sample. Additionally, we explicitly targeted a higher fraction of CCSN discoveries owing to the comparative paucity of CCSN spectroscopic samples compared to SNe Ia (again arising from the magnitude-limited rates). Thus, our higher representation of CCSNe than the expectation from the magnitude-limited rates of Li et al. (Reference Li2011a) is likely a combination of the higher CCSN fraction for our untargeted feeder surveys and our explicit emphasis on preferential targeting of CCSNe.
4 TYPE IA SUPERNOVA SPECTRA FROM AWSNAP
As a first demonstration of the usefulness of the AWSNAP dataset, we analyse basic spectroscopic features of the SNe Ia in our sample—this comprises 180 total spectra of 101 objects. In Figure 9, we plot a histogram of the phasesFootnote 2 of our SN Ia spectra, again compared to previous large SN Ia spectroscopy surveys (CfA, BSNIP, CSP). Our sample shows a similar phase coverage as previous surveys, with perhaps a slight increase in earlier phases due to improved SN discovery efficiency from nearby SN searches. In the sections that follow, we further analyse features of interest from the AWSNAP SN Ia spectroscopy sample.
Histograms of spectroscopic phases (with respect to B-band maximum light) for SN Ia spectra in AWSNAP and other SN Ia spectroscopy samples (the same as in Figure 7). Note the AWSNAP phases are based on the spectroscopic-based phase reported with the SN classification, which may have an associated uncertainty of 3–5 d.

4.1. Spectral features in SNe Ia at maximum light
We begin by inspecting the spectra of SNe Ia close to the epoch of peak brightness. These maximum light spectra have a long history of providing key insights into the diversity of SN Ia explosions through the study of ‘spectral indicators’ (Nugent et al. Reference Nugent, Phillips, Baron, Branch and Hauschildt1995; Hatano et al. Reference Hatano, Branch, Lentz, Baron, Filippenko and Garnavich2000; Benetti et al. Reference Benetti2005; Bongard et al. Reference Bongard, Baron, Smadja, Branch and Hauschildt2006, Reference Bongard, Baron, Smadja, Branch and Hauschildt2008; Hachinger, Mazzali, & Benetti Reference Hachinger, Mazzali and Benetti2006; Hachinger et al. Reference Hachinger, Mazzali, Tanaka, Hillebrandt and Benetti2008; Branch et al. Reference Branch2006; Branch, Dang, & Baron Reference Branch, Dang and Baron2009; Bronder et al. Reference Bronder2008; Silverman, Kong, & Filippenko Reference Silverman, Kong and Filippenko2012b), as well as potential avenues for improving the cosmological standardisation of SNe Ia (Wang et al. Reference Wang2009; Bailey et al. Reference Bailey2009; Blondin, Mandel, & Kirshner Reference Blondin, Mandel and Kirshner2011; Silverman et al. Reference Silverman, Ganeshalingam, Li and Filippenko2012a). Thus, we actively targeted many SNe Ia (which had already been classified) on an epoch close to maximum light to obtain high-quality spectra facilitating such studies.
We isolated the sample SNe Ia with a spectrum within 5 d of estimated peak brightness. It is important to reiterate here that the phases for our SN Ia sample are extrapolated from the reported spectroscopic classification phase and date. It has been demonstrated previously (e.g. Blondin et al. Reference Blondin2012) that the phase determined for SNe Ia via spectroscopic matching codes such as SNID (Blondin & Tonry Reference Blondin and Tonry2007) typically has an uncertainty of at least 3–5 d. Thus, we may have included SN Ia spectra as much as 10 d removed from maximum light. Our analysis here is intended to be illustrative of the utility of our published spectra, and more detailed quantitative spectroscopic analyses should always be coupled to a robust photometric data set.
For the analysis that follows, we measure two key quantities of interest: the silicon absorption ratio R Si, and the strength of high-velocity features (HVFs) R HVF. For this work, we define R Si as the ratio of the pseudo equivalent width (pEW) of the 5962 Å feature to the pEW of the 6355 Å feature. The pEW for each feature is measured by fitting a linear pseudo-continuum across narrow regions redward and blueward of the given feature (similar to methods employed in Silverman et al. Reference Silverman, Kong and Filippenko2012b), then integrating the flux in the normalised absorption feature.
R Si is known to correlate strongly with the SN Ia light curve decline rate (Nugent et al. Reference Nugent, Phillips, Baron, Branch and Hauschildt1995). We quantified the relationship between our definition of R Si (the pEW ratio) and light curve decline rate Δm 15 by fitting a linear relationship between these quantities for a sample of 342 SNe Ia collated from the CfA, BSNIP, and CSP samples. The fit to these data is presented in Appendix A2, shown graphically in Figure A1 with a best fit trend given by Equation (A1). Below we will use this relation to display the corresponding range of Δm 15 spanned by our observed values of R Si.
We measure the HVF strength for our SN Ia sample using the same techniques employed in Childress et al. (Reference Childress, Filippenko, Ganeshalingam and Schmidt2014b), and similarly define R HVF as the ratio of the pEW of the HVF to the pEW of the photospheric velocity feature (PVF). Briefly, we first normalise the Ca NIR feature using a linear pseudo-continuum fit. We then fit the Ca NIR feature with two Gaussians in velocity space with velocity centres, widths, and absorption depths fitted with a Python mpfit routine. Each component in velocity space corresponds to a triplet in wavelength space, and we set the absorption depth of each component equal to each other (i.e. the optically thick limit). As in Childress et al. (Reference Childress, Filippenko, Ganeshalingam and Schmidt2014b), we require the photospheric velocity component to have a velocity centre within 20% of the value derived for the Si 6355 Å feature, though in most cases the results are the same if this requirement is removed.
In Figure 10, we plot the measured HVF strength (R HVF) versus the silicon absorption strength ratio R Si. For illustrative purposes, we also show the scale of light curve decline rate Δm 15 corresponding to the plotted range of R Si using the above relation. A representative error bar for Δm 15 from the above relation and a typical R HVF error-bar are shown in the figure.
Strength of the high-velocity features (HVFs) in the Ca II NIR triplet—using the quantity R HVF as defined by Childress et al. (Reference Childress, Filippenko, Ganeshalingam and Schmidt2014b)—plotted against the Si II absorption strength ratio R Si defined by Nugent et al. (Reference Nugent, Phillips, Baron, Branch and Hauschildt1995). On the top axis, we show the rough equivalent light curve decline rate Δm 15 values corresponding to the range of R Si values. The crosshair in the upper right represents the characteristic errors in measurement of R HVF (typically 20%, plotted here for the larger values of R HVF) and the error in Δm 15 when converted from R Si.

Figure 10 demonstrates a tendency for SNe Ia with strong HVFs to also have low values of R Si and thus broad light curves (low Δm 15). This correlation of HVFs with SN Ia light curve width was first observed by Maguire et al. (Reference Maguire2012) in composite high-redshift SN Ia spectra, and subsequently confirmed by numerous studies of low-redshift SNe Ia (Childress et al. Reference Childress, Filippenko, Ganeshalingam and Schmidt2014b; Maguire et al. Reference Maguire2014; Pan et al. Reference Pan, Sullivan, Maguire, Gal-Yam, Hook, Howell, Nugent and Mazzali2015; Silverman et al. Reference Silverman, Vinkó, Marion, Wheeler, Barna, Szalai, Mulligan and Filippenko2015; Zhao et al. Reference Zhao2015). Our results support these studies with spectra alone.
4.2. Narrow sodium absorption features in SN Ia spectra
A great advantage of the higher resolution of WiFeS (compared to many spectrographs deployed for other SN spectroscopy surveys) is the ability to detect narrow absorption features, particularly the Na I doublet at λλ5890/5896 Å. This feature has a long history of being used to infer the presence of foreground dust in SNe Ia (Barbon et al. Reference Barbon, Benetti, Rosino, Cappellaro and Turatto1990; Turatto, Benetti, & Cappellaro Reference Turatto, Benetti, Cappellaro, Hillebrandt and Leibundgut2003; Poznanski et al. Reference Poznanski, Ganeshalingam, Silverman and Filippenko2011; Poznanski, Prochaska, & Bloom Reference Poznanski, Prochaska and Bloom2012; Phillips et al. Reference Phillips2013). Earlier works attempted to derive correlations between SN Ia colours and sodium absorption strength (i.e. the absorption equivalent width), but Poznanski et al. (Reference Poznanski, Ganeshalingam, Silverman and Filippenko2011) showed sodium to be a poor indicator of SN Ia reddening. Phillips et al. (Reference Phillips2013) refined this result by showing that SN Ia reddening exhibits a strong correlation with absorption strength of the diffuse interstellar bands (found exclusively in the interstellar medium) but some SNe Ia have an excess of sodium absorption that does not coincide with associated reddening of the SN. Thus, sodium features in SNe Ia remain instructive but should be considered with a measure of caution.
Recently, velocities of sodium absorption features in SN Ia spectra have been used as a diagnostic of CSM, including cases of some SNe Ia (Patat et al. Reference Patat2007; Simon et al. Reference Simon2009) where the sodium absorption features exhibit variability (though most do not—see Sternberg et al. Reference Sternberg2014), indicating SN-CSM interaction. More recently, a statistical analysis of the velocity distribution of sodium features in SNe Ia by Sternberg et al. (Reference Sternberg2011) found an excess of SNe Ia with blueshifted sodium features, indicating that a fraction of SNe Ia explode inside an expanding shell of material that was presumably shed by the SN Ia progenitor system prior to explosion. Maguire et al. (Reference Maguire2013) extended this work to show that the excess of SNe Ia with blueshifted sodium absorption was populated predominantly by the more luminous SNe Ia with slow declining light curves (i.e. high ‘stretch’).
We thus searched for the presence of sodium absorption features in our sample of SN Ia spectra. For most SNe Ia (13), this was done with the lower resolution (R3000) observations of the SN at maximum light. For six SNe Ia, we also had a higher resolution (R7000) observation of the SN at maximum light. In a few instances, this observation was triggered by the presence of strong reddening being reported in the SN classification announcement. For the other instances, we obtained both a low-resolution (R3000) and high-resolution (R7000) spectrum in the red whilst obtaining a longer exposure blue (B3000) spectrum during nights near full moon when the blue sky background was exceptionally high.
We fitted the sodium doublet absorption profile as follows. First, the spectrum was normalised to the local continuum by fitting a quadratic to the SN flux between 10–25 Å redward or blueward of the doublet centre (5893 Å). The absorption profile was fitted as two Gaussians with rest wavelengths set by the doublet wavelengths but with unknown (common) velocity shift and velocity width and (independent) absorption depths. This was done with an mpfit routine in Python, which accounts for variable covariances and returns the appropriate fit values and uncertainties. We show representative examples for fits to data from both gratings in Figure 11. The outcomes for our sodium profile fits are presented in Table A4 in Appendix A, and comprise six successful fits for targets with R7000 spectra, and 13 for R3000 spectra.
Sodium absorption fit examples for both the R7000 (top) and R3000 (bottom) gratings. Data (which have been normalised to the local continuum fit) are shown as blue diamonds whilst the best fit absorption profile is shown as the solid red curve. For reference, we also mark the continuum level (horizontal black line at value 1.00) and the rest wavelengths of the sodium doublet (vertical dotted gray lines).

The primary quantity we wanted to measure from the sodium absorption feature was its velocity with respect to the local standard of rest at the SN site. The default local rest velocity was initially set to be the systemic velocity of the SN host galaxy. In some cases, we detected clear nebular emission lines at the SN site present in the SN spectrum—for these cases, the local rest velocity (i.e. the rotational velocity of the host galaxy at the site of the SN) was measured from the Hα emission line.
In two cases (SN 2014ao and ASASSN-14jg), no local Hα emission was present in the SN spectrum, and the SN sodium velocity differed from the host systemic velocity by more than 100 km s−1. To obtain the true local rest velocities for these two SNe Ia, we took advantage of the integral-field data provided by WiFeS, which allows us to measure host galaxy properties (such as velocity) over a broad field of view.
We illustrate this for SN 2014ao in Figure 12: The WiFeS field of view extends from the host galaxy core to the outer edge of its spiral arms in the direction of the SN. We were able to extract the velocity of an H ii region along the SN-host axis and found its velocity differed significantly from that of the host core (Δv = 174 ± 10 km s−1). As galaxy velocity curves tend to flatten at large radii, we use the H ii region velocity as the local rest velocity of SN 2014ao—a value much closer to the measured sodium absorption velocity.
Determination of the local velocity for SN 2014ao in NGC 2615 with WiFeS. Left: SDSS (York et al. Reference York2000) gri colour composite—created with SWARP (Bertin et al. Reference Bertin, Mellier, Radovich, Missonnier, Didelon, Morin, Bohlender, Durand and Handley2002) and STIFF (Bertin Reference Bertin, Ballester, Egret and Lorente2012)—with the WiFeS field of view (red rectangle) and SN location (red dot) highlighted. Middle: Image of the SN 2014ao WiFeS data cube in the isolated wavelength range within ± 6 Å (i.e. ± 300 km s−1) of the wavelength of Hα at the published redshift of NGC 2615, with host core (purple square) and nearby H ii region (brown square) highlighted—the SN is the bright object near the centre. Right: Extracted WiFeS spectra of the nearby H ii region (top) and host core (bottom) near the Hα+NII emission line group, with the expected location of those lines at the published redshift of NGC 2615 (z = 0.014083, Theureau et al. Reference Theureau, Bottinelli, Coudreau-Durand, Gouguenheim, Hallet, Loulergue, Paturel and Teerikorpi1998a) shown as the vertical gray lines.

With the final sodium absorption velocities for our sample, we can inspect the relationship between sodium velocity and other spectroscopic properties of our SN Ia sample. In Figure 13, we plot the silicon absorption ratio (R Si), the HVF absorption strength (R HVF), and the absorption strength (i.e. equivalent width) of sodium itself against the velocity of the sodium absorption feature. Based on results of Maguire et al. (Reference Maguire2013), we would expect SNe Ia with low R Si and high R HVF values (the high stretch, slow declining SNe Ia) to have a slight excess of blueshifted sodium absorption. Our sample size here is too small (and not well-selected) to make any robust statement about such preferences. However, we note that this analysis was not the explicit objective of our observations, but instead was a supplemental outcome facilitated by the nature of the WiFeS data.
Top: Silicon absorption ratio R Si plotted against velocity centre of the narrow sodium absorption feature (as in Figure 10 we show the corresponding values of Δm 15, though note the smaller range). Middle: HVF strength (R HVF) plotted against sodium absorption velocity. Bottom: Absorption equivalent width of the combined D1+D2 sodium lines plotted against sodium absorption velocity. On the right axis of this panel, we use the relation of Poznanski et al. (Reference Poznanski, Prochaska and Bloom2012) to show the reddening values E(B − V) corresponding to the measured sodium equivalent widths if the absorption arises solely from the ISM—though this is unlikely to be true for all SNe Ia (Poznanski et al. Reference Poznanski, Ganeshalingam, Silverman and Filippenko2011; Phillips et al. Reference Phillips2013—see discussion in text). In all panels, higher resolution observations with the R7000 grating are displayed as green squares, whilst lower resolution R3000 observations are shown as blue circles.

Thus, WiFeS is an excellent instrument for measuring sodium absorption in SNe Ia, a key observable for investigating SN Ia progenitor systems. This is particularly true for observations taken with the R7000 grating, which provides sodium velocity uncertainties of order a few km s−1, thus enabling a robust classification of the SN as being ‘blueshifted’ or ‘redshifted’. More importantly, perhaps, is the capability of WiFeS to observe a wide field of view around the SN. This enables a measurement of the local systemic velocity at the SN location, even in cases where emission from the host galaxy is weak at the SN location itself.
4.3. Spectroscopic evolution of SN 2012dn
The SN with the greatest number of spectroscopic epochs in AWSNAP is SN 2012dn, and we show its AWSNAP spectroscopic time series in Figure 14. SN 2012dn was a spectroscopically peculiar SN Ia whose photometric and spectroscopic evolution was studied extensively by Chakradhari et al. (Reference Chakradhari, Sahu, Srivastav and Anupama2014)—they found it to be similar to the ‘candidate super-Chandrasekhar’ SN Ia SN 2006gz (Hicken et al. Reference Hicken, Garnavich, Prieto, Blondin, DePoy, Kirshner and Parrent2007). For brevity, we will refer to this class of objects as ‘super-Chandra’, though we caution the reader that the origin of the extreme luminosity of these objects is still under debate (see, e.g. Taubenberger et al. Reference Taubenberger2011; Hachinger et al. Reference Hachinger, Mazzali, Taubenberger, Fink, Pakmor, Hillebrandt and Seitenzahl2012). We comment on only a few additional outcomes for SN 2012dn from the AWSNAP data, but refer readers to Chakradhari et al. (Reference Chakradhari, Sahu, Srivastav and Anupama2014) and Parrent et al. (Reference Parrent2016) for a thorough discussion of this interesting object.
AWSNAP time series of SN 2012dn, labelled by phase with respect to the date of maximum light (2012 July 24, as determined by Chakradhari et al. Reference Chakradhari, Sahu, Srivastav and Anupama2014). Note these observations come from the first semester of AWSNAP when observing time was allocated in multi-night blocks separated sometimes by a month or more.

We obtained a very high signal-to-noise spectrum of SN 2012dn at phase +91 d (with respect to the date of maximum light 2012 July 24, as determined by Chakradhari et al. Reference Chakradhari, Sahu, Srivastav and Anupama2014). At this epoch, the SN is beginning to enter the nebular phase when the ejecta become optically thin, revealing emission from the iron group elements (IGEs) near the centre of the SN. Spectra at these epochs provide an excellent diagnostic of the nucleosynthetic products of the SN explosion. In Figure 15, we present our +91 d spectrum of SN 2012dn compared to very late spectra of other candidate super-Chandra SNe Ia SN 2007if (Scalzo et al. Reference Scalzo2010; Yuan et al. Reference Yuan2010; Taubenberger et al. Reference Taubenberger2013) and SN 2009dc (Silverman et al. Reference Silverman, Ganeshalingam, Li, Filippenko, Miller and Poznanski2011; Taubenberger et al. Reference Taubenberger2011; Yamanaka et al. Reference Yamanaka2009; Tanaka et al. Reference Tanaka2010; Hachinger et al. Reference Hachinger, Mazzali, Taubenberger, Fink, Pakmor, Hillebrandt and Seitenzahl2012; Kamiya et al. Reference Kamiya, Tanaka, Nomoto, Blinnikov, Sorokina and Suzuki2012; Taubenberger et al. Reference Taubenberger2013), as well as the gold standard normal SN Ia SN 2011fe (Nugent et al. Reference Nugent2011; Li et al. Reference Li2011b; Parrent et al. Reference Parrent2012; Pereira et al. Reference Pereira2013).
SN 2012dn at its latest AWSNAP epoch (+91 d on 2012 October 23) compared to other candidate super-Chandra SNe Ia SN 2007if at +98 d (top panel, from Silverman et al. Reference Silverman, Ganeshalingam, Li, Filippenko, Miller and Poznanski2011) and SN 2009dc at +97 d (middle panel, from Taubenberger et al. Reference Taubenberger2011), as well as the normal SN 2011fe (bottom panel, from Pereira et al. Reference Pereira2013).

This comparison clearly reveals a strong spectroscopic similarity between SN 2012dn and the candidate super-Chandrasekhar SNe Ia, and a distinct dissimilarity with SN 2011fe. Perhaps, most prominent is the weaker Fe III line complex at ~ 4700 Å for the super-Chandra SNe Ia compared to SN 2011fe. This discrepancy is also evident in fully nebular spectra of super-Chandra SNe Ia at ~ 1 yr past maximum light, as discussed by Taubenberger et al. (Reference Taubenberger2013). This indicates that the ionisation state of the super-Chandra SNe Ia at these phases is different from normal SNe Ia—whether the diminished Fe iii emission arises from a higher or lower average ionisation state remains uncertain.
Additionally, the velocity profile of the emission features in the super-Chandra SNe Ia exhibits a marked difference to that of SN 2011fe (and other normal SNe Ia). The normal SN Ia profile appears very Gaussian (and indeed is generally well fit by a Gaussian profile—Childress et al. Reference Childress2015), whilst the super-Chandra velocity profile appears sharper at the centre. This is particularly evident for the line features at ~ 5 900 and ~ 6 300 Å, which at these epochs are dominated by Co iii. Further spectral modelling of this and other late-phase super-Chandra spectra may reveal important insights into the structure and composition of the super-Chandra ejecta.
Finally, the high resolution of WiFeS reveals narrow emission lines from the host galaxy of SN 2012dn. We isolated the narrow host galaxy lines using the longest exposure of SN 2012dn, the late-phase observation of 2012 October 23 (+91 d). We fit a simple linear ‘continuum’ near each emission line by fitting a line to the SN spectrum between 5 and 15 Å away from the line centre on both the blue and red sides of the line. We illustrate this technique and present the SN-subtracted emission features in Figure 16.
Extraction of host galaxy emission line flux (green) from late SN 2012dn spectrum (blue) using simple linear continuum fits (red).

In Table 3, we present the measured emission fluxes and errors for the major galaxy emission lines, all of which have been scaled by the observed flux in the Hβ line. By comparing the observed ratio of the Hα and Hβ lines to its expected value of 2.87 (the Balmer decrement Osterbrock & Ferland Reference Osterbrock and Ferland2006), we can determine the amount of reddening in the H ii regions giving rise to the host emission lines. We use the Cardelli, Clayton, & Mathis (Reference Cardelli, Clayton and Mathis1989) to find a host reddening of E(B − V) = 0.17 ± 0.10, a value remarkably similar to the SN reddening of E(B − V) = 0.18 (Milky Way plus host) determined by Chakradhari et al. (Reference Chakradhari, Sahu, Srivastav and Anupama2014). We correct the host emission line fluxes for the value E(B − V) = 0.17 and report the corrected values (which we also re-scale to the de-reddened Hβ flux) in Table 3.
SN 2012dn local emission line fluxes.

a Observer frame fluxes, scaled to Hβ.
b De-reddened using Balmer decrement reddening of E(B − V) = 0.17 so that F(Hβ) = F(Hα)/2.87 with a CCM reddening law, and scaled to the de-reddened flux of Hβ.
With the de-reddened host galaxy emission line fluxes, we calculate a gas-phase metallicity at the site of SN 2012dn. The N2 method of Pettini & Pagel (Reference Pettini and Pagel2004, hereafter PP04) yields 12 + log(O/H) = 8.29 ± 0.04, whilst the O3N2 method of PP04 yields 12 + log(O/H) = 8.35 ± 0.03. The former value is remarkably close to the estimated site metallicity for SN 2006gz of 12 + log(O/H) = 8.26 calculated by Khan et al. (Reference Khan, Stanek, Stoll and Prieto2011) using the same metallicity method. If we convert the O3N2 value to the Tremonti et al. (Reference Tremonti2004) scale using the formulae of Kewley & Ellison (Reference Kewley and Ellison2008) as was done in Childress et al. (Reference Childress2011), we measure 12 + log(O/H) T04 = 8.51 ± 0.04.
Comparing the above values to the solar oxygen abundance of 12 + log(O/H)⊙ = 8.69 (Asplund et al. Reference Asplund, Grevesse, Sauval and Scott2009), we find the site metallicity for SN 2012dn is in the range 40–65% solar, depending on the chosen metallicity calibration. This sub-solar metallicity value is consistent with the previously reported trend for super-Chandra SNe Ia to prefer low metallicity environments (Taubenberger et al. Reference Taubenberger2011; Childress et al. Reference Childress2011; Khan et al. Reference Khan, Stanek, Stoll and Prieto2011).
5 CONCLUSIONS
This work marks the primary data release for the AWSNAP, comprising 357 distinct spectra of 175 unique SNe. These data were collected using the WiFeS on the ANU 2.3-m telescope during 82 nights of observing over a 3-yr period from mid-2012 to mid-2015.
The AWSNAP spectroscopy sample is comparable in size to other SN spectra data releases, and its composition of SN types is roughly in line with expectations for a magnitude-limited SN search. The phase coverage of the AWSNAP SN Ia sample is comparable to other published SN Ia spectroscopy datasets (for SNe Ia with multiple epochs of observation), with the inclusion of more SNe Ia with a single observation (i.e. classification spectra only).
We presented some analyses of the AWSNAP SN Ia sample, including some results uniquely enabled by the fine wavelength resolution available with WiFeS. We measured broad absorption features in SN Ia spectra at maximum light, including the ratio of silicon absorption features R Si and the strength of HVFs R HVF. Additionally, we measured the strength and velocity of narrow sodium absorption features, including some cases where the integral-field nature of the instrument allowed us to measure the local systemic velocity within the SN host galaxy. Some expected feature trends, such as a correlation between R HVF and R Si, were recovered in our data set. The nature of sodium absorption in our sample was limited by small number statistics. Finally, we presented our observations of the candidate super-Chandrasekhar SN Ia SN 2012dn, and used narrow host galaxy emission features to show the SN site exhibits sub-solar metallicity.
The WiFeS instrument presents several unique advantages for the study of transients, particularly owing to its comparatively narrow velocity resolution (σv ~ 45 km s−1). It has previously been employed in the study of SNe with strong narrow emission features such as SN 2009ip (Fraser et al. Reference Fraser2013, Reference Fraser2015), SN 2012ca (Inserra et al. Reference Inserra2014, Reference Inserra2016), and SN 2013fc (Kangas et al. Reference Kangas2016). Here, we also demonstrated that the fine velocity resolution allows for the measurement of narrow absorption features, particularly sodium absorption in SNe Ia. The higher resolution of WiFeS also frequently revealed narrow host galaxy emission features at the site of the SN, which can at times be used to determine a SN site metallicity (as we showed for SN 2012dn). Finally, the integral field nature of WiFeS allowed us to measure the local host galaxy rotational velocity at the site of several SNe, even when there was no emission directly at the SN location. Thus, WiFeS is an instrument capable of not only standard SN spectroscopic observations, but also a unique suite of capabilities not commonly found in transient follow-up instruments.
ACKNOWLEDGEMENTS
We are very grateful for the excellent technical support staff for the ANU 2.3-m telescope and the WiFeS instrument: Peter Verwayen, Ian Adams, Peter Small, Ian Price, Peter Young, and Jon Nielsen. We thank the ANU telescope time allocation committee who continue to support the observations presented herein. We also thank Julie Banfield, Michael Ireland, Stefan Keller, Lisa Kewley, Jeremy Mould, Chris Owen, Aaron Rizzuto, Dary Ruiz, and Tian-Tian Yuan for additional observations. We also thank the anonymous referee for very helpful comments.
This research was conducted by the Australian Research Council Centre of Excellence for All-sky Astrophysics (CAASTRO), through project number CE110001020. IRS was supported by Australian Research Council Laureate Grant FL0992131. This research has made use of the NASA/IPAC Extragalactic Database (NED) which is operated by the Jet Propulsion Laboratory, California Institute of Technology, under contract with the National Aeronautics and Space Administration. This research has made use of NASA’s Astrophysics Data System (ADS).
APPENDIX A1: TARGET AND OBSERVATION DETAILS
In this Appendix, we present the observational metadata for the AWSNAP data release, as well as sodium fit results and host (or local) redshifts used in the sodium fitting.
AWSNAP targets: Table A1 presents the discovery and classification details for the full list of 175 objects featured in the AWSNAP DR1 data release. We list the discovery location and date, as well as discovery reference and group that discovered the transient. Note the discovery references are typically either Astronomer’s Telegrams (ATel’s, denoted as, e.g. ‘A1234’) or telegrams from the Central Bureau for Electronic Telegrams (CBET’s, denoted as, e.g. ‘C1234’), though occasionally a separate discovery notice was not issued—in these cases, typically the webpage of the discovering group was cited in the classification reference. Classification references are given with similar notation, listed along with classification date, quoted supernova type and phase from the classification, as well as the redshift listed in the classification.
All AWSNAP Targets.

In Table A1, the discovery and classification groups are listed either as acronyms of the group name, or listed as the first author in the discovery/classification notice. The acronyms used in the table for discovery groups are as follows:
-
• ASAS-SN: the All-Sky Automated Survey for Supernovae (Shappee et al. Reference Shappee2014).
-
• CHASE: the CHilean Automatic Supernova sEarch (Pignata et al. Reference Pignata, Giobbi, Tornambe, Raimondo, Limongi, Antonelli, Menci and Brocato2009).
-
• CRTS: the Catalina Real-Time Transient Survey (Drake et al. Reference Drake2009).
-
• Gaia: transient alerts from Gaia (e.g. Wyrzykowski et al. Reference Wyrzykowski, Hodgkin, Blogorodnova, Koposov and Burgon2012; Blagorodnova et al. Reference Blagorodnova, Koposov, Wyrzykowski, Irwin and Walton2014, Reference Blagorodnova, Van Velzen, Harrison, Koposov, Mattila, Campbell, Walton and Wyrzykowski2016).
-
• ISSP: the Italian Supernova Search Programme.
-
• LOSS: the Lick Observatory Supernova Search (Ganeshalingam et al. Reference Ganeshalingam2010).
-
• LSQ: the La Silla-QUEST low redshift supernova survey (Baltay et al. Reference Baltay2013).
-
• MASTER: the Mobile Astronomical System of Telescope-Robots (Lipunov et al. Reference Lipunov2004).
-
• OGLE: the OGLE-IV real-time transient search (Wyrzykowski et al. Reference Wyrzykowski2014).
-
• PanSTARRS: the Panoramic Survey Telescope and Rapid Response System panstarrs.
-
• PTF/iPTF: the Palomar Transient Factory (Rau et al. Reference Rau2009; Law et al. Reference Law2009) and its successor.
-
• SkyMapper: the SkyMapper (Keller et al. Reference Keller2007) transients search.
-
• TAROT: the Télescope á Action Rapide pour les Objets Transitoires (Rapid Action Telescope for Transient Objects) at La Silla (e.g. Klotz et al. Reference Klotz, Boer, Atteia, Gendre, Le Borgne, Frappa, Vachier and Berthier2013).
-
• TNTS: the Tsinghua-NAOC Transient Survey.
The acronyms used in the table for classification groups are as follows:
-
• ASP: the Asiago Supernova Programme (Tomasella et al. Reference Tomasella2014).
-
• AWSNAP: the ANU+WiFeS SuperNovA Programme (this work).
-
• CSP: the Carnegie Supernova Project (Folatelli et al. Reference Folatelli2013).
-
• LCOGT: the Las Cumbres Observatory Global Telescope (Brown et al. Reference Brown2013).
-
• PESSTO: the Public ESO Spectroscopic Survey for Transient Objects (Smartt et al. Reference Smartt2015).
-
• SNF: SuperNova Factory (Aldering et al. Reference Aldering, Tyson and Wolff2002).
Some transients in Table A1 are known by other aliases or are listed in shorthand form (due to a lengthy full name). These transients and their aliases (or full names) are noted in Table A2.
Alternate and/or full designations for SNe in the AWSNAP sample.

Literature data used to fit the trend of Δm 15 versus R Si. The best fit is the thick solid line, and the thin dashed line represent the trend ± 1σ (where σ is the dispersion of the data about the trend).

AWSNAP spectra: The full list of AWSNAP spectra released here is given in Table A3, along with pertinent observation details such as grating and exposure time.
SN Ia sodium fits: In Table A4, we present the best fit parameters (and uncertainties) for our fits to narrow sodium absorption in our sample of SN Ia maximum light spectra. Table A5 lists the redshifts used to establish the local rest velocity of the SN—typically this was the redshift of the host galaxy but occasionally is obtained from galaxy emission features at the location of the SN (denoted as ‘Local’).
APPENDIX A2: DERIVATION OF THE SN Ia R Si–Δm 15 RELATION FROM LITERATURE DATA
Our fit to the relation between Δm 15 and R Si is presented here. Our fit to the data is shown in Figure A1, and from these data we derive a best fit relation of
All AWSNAP spectra.

Fits of Na line in SNe Ia.

Host galaxy redshifts for SN Ia Na sample.

 $$\begin{equation}
\Delta m_{15} = 2.04 R_{{\rm Si}} + 0.808.
\end{equation}$$
$$\begin{equation}
\Delta m_{15} = 2.04 R_{{\rm Si}} + 0.808.
\end{equation}$$
The scatter about this best fit curve is 0.190 mag.