


Introduction
As narrated by himself in an autobiographic note (Mullis, Reference Mullis1990), in 1983, Kary Mullis was struck by the idea of a procedure for synthesizing repeatedly deoxyribonucleic acid (DNA) in vitro, which he named polymerase chain reaction (PCR). Beginning with a single target molecule of DNA, he envisaged he could find DNA fragments and ‘generate 100 billion similar molecules in an afternoon’. In 1985, he applied for a patent for PCR (Mullis, Reference Mullis1985), then finished and substituted it by a subsequent 1987 application (Mullis, Reference Mullis1987). He described such procedure also in a scientific record (Mullis and Faloona, Reference Mullis and Faloona1987) in the format of an experimental method. The Authors report (Mullis, Reference Mullis1987; Mullis and Faloona, Reference Mullis and Faloona1987) that PCR is based upon the reiteration of a reaction cycle which includes, in each cycle, a heating subprocess referred to as denaturing or denaturation. In the ‘Claims’ section of the patent application (Mullis, Reference Mullis1987), denaturation was so mentioned: ‘wherein said nucleic acid is double-stranded and its strands are separated by denaturing’. Hereafter, we will refer to such heating subprocess intended for DNA strands separation as the ‘denaturation claim’ or, more briefly, as DNA denaturation.
The presence of a DNA heating step, in a conceivable theoretical scheme for nucleic acid amplification and sequencing, turns out to be a critical point for the sake of the fidelity of such an amplification procedure against the risk of thermal depolymerization, or disaggregation, of the DNA molecule. This could lead to a consequential loss of information in the sequence of nucleotides, due to the random breakage mechanisms similar to those explaining the molecular weight decay observed under the effect of gamma-rays on DNA, described for instance by Cox et al. (Reference Cox, Overend, Peacocke and Wilson1955), and reported also for heating by many authors. However, concerning DNA stability to heating, there can be found relevant discrepancies between more recent studies dealing with the exploitation of DNA heating above 80 °C for nucleic acid amplification purposes, and the results in the original early studies devoted to the analysis of the disruptive effects of heat on DNA. Such discrepancies are briefly sketched hereafter.
Innis et al. (Reference Innis, Myambo, Gelfand and Brow1988), cited by Kary Mullis in 1990, reported a remarkable fidelity of PCR by heating. It is stated indeed by Innis et al. (Reference Innis, Myambo, Gelfand and Brow1988) that with PCR ‘segments of single-copy genomic DNA can be amplified > 10 million-fold with very high specificity and fidelity’ and (referring to a modified version of PCR therein proposed) that ‘the fidelity of PCR […] is quite respectable (approximately one mistake in 4000–5000 base pairs sequenced after 35 cycles of PCR and cloning of the products)’. They write ‘The mixture was heated to 90 °C for 3 min, incubated at 42 °C for 20 min, cooled to room temperature’, but no specific considerations or references are reported concerning the problem of a thermal depolymerization. Similarly, in Mullis (Reference Mullis1987) and Mullis and Faloona (Reference Mullis and Faloona1987), it is reported the possibility of customarily performing heating steps from a temperature of about 80 °C up to temperatures as high as 100 °C and even 105 °C (Mullis, Reference Mullis1987).
Conversely, the very early pioneering studies of historical relevance which were entirely dedicated to the physical, chemical, and biological effects on DNA by several physical agents (Goldstein and Stern, Reference Goldstein and Stern1950; Zamenhof et al., Reference Zamenhof, Alexander and Leidy1953), provided compelling evidence that heating above 81°, even for few minutes, determines a sharp thermal DNA degradation. The observed degradation also consists of strands fragmentation into shorter molecular segments involving deterministically unpredictable sequence-breaking fractures of linkages along a single polynucleotide chain. This phenomenon was early shown by several authors. Among others, Shooter et al. (Reference Shooter, Pain and Butler1956) carefully experimentally examined it, while Applequist (Reference Applequist1961) well described its bond scission kinetics by a random degradation model achieving significant predictivity of several degradation processes. Also, the biological implications concomitant to DNA fragmentation with loss of biological activity were early shown as a first macroscopic effect by Zamenhof et al. (Reference Zamenhof, Alexander and Leidy1953).
It is worth anticipating that, in this respect, a watershed publication dealing with the denaturation claim is a 3 pages short communication by Doty and Rice (Reference Doty and Rice1955). With some emphasis, this paper can be said to represent a sort of ‘parting of the Red Sea’ as it marked the birth of a new post-1955 paradigm on the preserved integrity of molecular information (after DNA is brought to temperatures capable to irreversibly reduce its viscosity, generally above 81 °C, and consecutively cooled). Within a pre-1955 paradigm, the DNA molecule appears to be divided into many smaller fragments upon heating above 81 °C while, within a post-1955 paradigm retrievable in part of the literature, it undergoes only a marginal alteration which, at least according to what has been stated by Doty in his 1955 paper, may also leave its molecular weight unchanged or even determine strand disassociation. Quite remarkably, heating above 81 °C, under some fast cooling conditions requirements specified in a subsequent paper by Doty et al. (Reference Doty, Marmur, Eigner and Schildkraut1960), is deemed to be even capable of bringing neat strands separation with halving of molecular weight. Given the discriminant role of the 1955 short communication, this paper is carefully scrutinized in a subsequent section of the present study.
The aim of the present review is to analyze such apparent conflict between what has been reported in the more recent papers dealing with the denaturation claim and what has been found in previous seminal scientific publications of the decade 1950–1960, which have first investigated the matter of thermal denaturation/degradation.
The overall focus of the present study is on answering the following main research question:
based on the available scientific literature concerning the investigation of thermal degradation of DNA, is it plausible to admit that an amplification of genetic information, stored in the sequence of DNA, can be achieved by consecutive heating/cooling cycles with temperatures above 90 °C?
To answer the question above, a detailed scientific review is reported of publications which have provided qualitative and quantitative evidence elucidating if, how, and under which conditions, an onset of longitudinal sequence-breaking random fragmentation of DNA molecules is possible at the PCR heating temperatures above 90 °C. Based on the critical scientific review and discussion of settling issues relevant to the plausibility of achieving amplification of DNA information by consecutive heating/cooling cycles at temperatures above 90 °C, this study brings a precise answer to the main research question above. Implications on PCR fidelity are drawn in a conclusive section.
Given the ever-increasing diffusion of PCR in forensic science and in kits for diagnostic applications asseverated by the World Health Organization (some of which are commonly known as ‘PCR swabs’), the purpose and significance of the questions posed in the current study are promptly understood to be of high relevance for public health policies as well as in forensic science.
The review will show that a main consequence of the high-temperature thermal cycling processes of PCR on DNA strands is a loss of integrity, adverse to PCR reliability, with the formation of shorter molecules which still remain, in the largest number, two-stranded. Other properties of buffers which are discriminant to determine the extent of this heating-induced fragmentation process are the presence in buffers of some electrolytes, like NaCl, which can have, to some extent, a protective action against thermal bombardment by making the molecule less stiff and less fragile.
Guide to reading subsections of this review
The present study is organized as follows. In section ‘Scientific background’, the background literature is reviewed in three parts separately.
-
• Part one presents a retrospective bibliographic survey which starts from the account of the denaturation claim in Mullis’ (Reference Mullis1987) patent and parses all evidence about the denaturation claim retrievable from the bibliographical references contained in the main papers which have presented PCR.
-
• Part two presents a first introductory review of three papers by Doty et al. of the years 1955–1960 which have introduced some controversial elements of interpretation of the effect of DNA heating at high temperatures.
-
• Part three reviews the pioneering studies from 1950 to 1960 on the effects of heating and other physical and chemical agents, which mainly describe the evidence against the denaturation claim and consequently raise questions on the fidelity of PCR.
The focus of the scientific background section is specifically kept over experiments capable to show whether or not DNA complementary strands neatly separate as a consequence of heating, and – even more – over the associated degree of preserved integrity of molecular information upon repeated heating–cooling cycles with heating above 80 °C.
The organization of this review prosecutes as follows. Section ‘Review of the experiments on DNA heating by Doty and Rice (Reference Doty and Rice1955, 1957)’ contains a closer scrutinization and critical review of the papers by Doty and coworkers in the years 1955–1960 and pinpoints key issues related to the denaturation claim which are identified to be pivotal elements of controversy when compared with contemporary results on DNA heating. In section ‘Discussion on the structural resilience of DNA chains after reiterated PCR cycles’, such key issues are discussed in the light of experimental evidence collected in this study from the literature herein reviewed. Conclusions are drawn in the final section.
Scientific background
The denaturation claim from PCR back to Doty and Rice (Reference Doty and Rice1955)
In Mullis and Faloona (Reference Mullis and Faloona1987), few information is reported on the DNA denaturation step. Among the five methods therein presented, for methods I and II the Authors state: ‘The solution is brought to 100 °C for 1 min, and is cooled to 25 °C for 30 sec in a water bath + 2 min’. For methods III, IV, V, and VI, heating is prescribed at temperature of 95 °C with time varying from 2 to 5 minutes. The paper does not contain references which deal with the function of the DNA denaturation associated with the specific methodology employed, except for three footnote references (Saiki et al., Reference Saiki, Scharf, Faloona, Mullis, Horn, Erlich and Arnheim1985; Scharf et al., Reference Scharf, Horn and Erlich1986; Kwok et al., Reference Kwok, Mack, Mullis, Poiesz, Ehrlich, Blair, Friedman-Kien and Sninsky1987). No differences in results are mentioned concerning the use of the different temperatures and times.
Since Mullis and coworkers in their first descriptions (Mullis, Reference Mullis1987; Mullis and Faloona, Reference Mullis and Faloona1987) do offer scarce bibliographical support to the denaturation claim, a dedicated background is reported in this section. Hereafter, excerpts from three references (Saiki et al., Reference Saiki, Scharf, Faloona, Mullis, Horn, Erlich and Arnheim1985; Scharf et al., Reference Scharf, Horn and Erlich1986; Kwok et al., Reference Kwok, Mack, Mullis, Poiesz, Ehrlich, Blair, Friedman-Kien and Sninsky1987) mentioned in Mullis and Faloona (Reference Mullis and Faloona1987) and from those retrieved in Mullis’ (Reference Mullis1987) patent are reported, selected as far as they contain significant information concerning the issue under scrutiny (i.e., relevant or relatable to the denaturation claim as presented by K. Mullis). Following a philological rationale, these excerpts are presented by publication date in reverse order:
-
• In Innis et al. (Reference Innis, Myambo, Gelfand and Brow1988), mentioned by Kary Mullis in 1990 an ‘annealing reaction’ is described comprising a step in which ‘the mixture was heated to 90 °C for 3 min’. Also, brief accounts of ‘PCR thermal cycling’ and of ‘denaturation at 93 °C for 30 sec’ are reported as well as brief accounts of denaturing steps ‘at 80 °C for 3 min’ and ‘at 75 °C for 5 min’.
-
• In Kwok et al. (Reference Kwok, Mack, Mullis, Poiesz, Ehrlich, Blair, Friedman-Kien and Sninsky1987), where the authors deal with the application of procedures related to PCR in search for the identification of a virus deemed responsible for acquired immunodeficiency syndrome (AIDS), a denaturation step is mentioned, although no relevant information is provided on the denaturation procedure therein employed.
-
• In Scharf et al. (Reference Scharf, Horn and Erlich1986), it is reported: ‘2 minutes of denaturation at 95 °C, 2 minutes of cooling at 37 °C’.
-
• In Saiki et al. (Reference Saiki, Scharf, Faloona, Mullis, Horn, Erlich and Arnheim1985), the information relevant to heating that can be retrieved is the temperature of 95 °C, and heating times of 2 minutes, 5 minutes or more, up to 10 minutes.
-
• In Gaubatz and Paddock (Reference Gaubatz and Paddock1982), a ‘Heating and quick cool’ step is reported in Figure 5 therein which depicts an ‘Hypothetical approach for sequencing recombinant plasmid containing a cDNA’. In the fourth section ‘Discussion on the structural resilience of DNA chains after reiterated PCR cycles’ therein it can be also read about ‘heat denaturation and quenching in ice’.
-
• The paper by Caton and Robertson (Reference Caton and Robertson1979) reports: ‘a novel technique is described for the production of pure, full-length influenza virus ds DNA’s corresponding to each segment of the influenza virus genome, and suitable for molecular cloning and restriction endonuclease’ and, concerning heating, it is reported that ‘Corresponding cDNA’s were […] boiled for 30 seconds and cooled on ice’.
The excerpts collected above constitute the almost entire body of textual information on the heating/cooling step that is readily retrievable after a first level bibliographic scan from Mullis (Reference Mullis1985, Reference Mullis1987, Reference Mullis1990) and from Mullis and Faloona (Reference Mullis and Faloona1987). For the sake of scientific reproducibility of materials and methods related to the PCR denaturation step, this information is not sufficient to allow prompt repetition of the same experimental methods by other researchers; even more, this information is not even adequate to permit a basic understanding of the elementary significance and purpose of temperature change in a 20 °C-wide range of critical values, – that is, from 80 °C to 100 °C – in this step of the PCR scheme. Times of heating also frequently differ without explanation (from 1 minute to 1 hour or even more).
This substantial lack of information may let the reader presume that the denaturation claim might have been considered established enough in the specialized scientific community, at the time of these publication (i.e., in the time frame 1979–1990), so as to not require additional descriptions or elucidations.
A second-level bibliographic investigation of references cited in the papers just mentioned (Caton and Robertson, Reference Caton and Robertson1979; Gaubatz and Paddock, Reference Gaubatz and Paddock1982; Saiki et al., Reference Saiki, Scharf, Faloona, Mullis, Horn, Erlich and Arnheim1985; Scharf et al., Reference Scharf, Horn and Erlich1986; Kwok et al., Reference Kwok, Mack, Mullis, Poiesz, Ehrlich, Blair, Friedman-Kien and Sninsky1987; Innis et al., Reference Innis, Myambo, Gelfand and Brow1988), proceeding from 1979 backwards, offers a few additional elements about the denaturation claim.
Innis et al. (Reference Innis, Myambo, Gelfand and Brow1988) place PCR in the wake of refinements of DNA sequencing techniques, which followed the methodology reported in a paper by Sanger et al. (Reference Sanger, Nicklen and Coulson1977). Therein, concerning the denaturation claim, the only statement retrievable is that a solution of DNA is ‘heated to 100 °C for 3 min’. This procedure refers to the DNA sequencing method described in a paper by Air et al. (Reference Air, Sanger and Coulson1976), which is actually based on heating at 100 °C for 3 min and which, in turn, is reported to correspond, with slight modifications, to a previous DNA sequencing method described by Sanger and Coulson (Reference Sanger and Coulson1975).
In 1971, the idea that denaturation would form single strands from the two-strand DNA molecule was presented by Kleppe et al. (Reference Kleppe, Ohtsuka, Kleppe, Molineux and Khorana1971) in a final paragraph as a line of thought supporting ongoing experimentation. In the same paper, the authors express a conjecture on the reversibility of this process and present the idea of repeating the heating–cooling (denaturation-annealing) cycle. The application of several heating treatments is described at temperatures of 70 °C and 100 °C along times of 2 and 3 minutes, respectively. Three years later, in Panet and Khorana (Reference Panet and Khorana1974), heating processes on DNA and related polynucleotides were actually applied all at 95 °C for times of 2, 3, or 10 minutes. It can be noted that in these works the rationale supporting the choices of these particular times and temperatures is not specifically justified or discussed. Almost 20 years later, the fundamental link between the 1971 paper by Kleppe and Khorana et al. and the PCR protocol was remarked in a short paragraph that appeared in Nature (Anonymous, 1989).
In Sanger and Coulson (Reference Sanger and Coulson1975), the denaturation step is reported aiming ‘to separate the newly-synthesized strands from the template’. The importance of denaturing is remarked and, concerning heating, temperatures and time are indicated at 95 °C as well as ‘at 95 to 100 °C for 3 min’. In presenting the principle of their synthesis method, Sanger and Coulson (Reference Sanger and Coulson1975), cite Wu and Kaiser (Reference Wu and Kaiser1968) who also refer in their materials and methods section, when dealing with hydrolysis of DNA, of a heating process of DNA mixtures ‘to 100 °C for 3 min’. Therein reference is made to the enzymatic synthesis method of DNA proposed by Josse et al. (Reference Josse, Kaiser and Kornberg1961). In this last paper, denaturation by heating is described with a longer heating time. They specifically report: ‘Heating of calf thymus DNA for 30 minutes at 100 °C in a medium of low ionic strength results in collapse of the rigid helical structure to a randomly coiled configuration’.
It can be concluded from this first literature parsing that the practice of heating steps along times from 1 to 5 minutes, reported by Mullis and Faloona (Reference Mullis and Faloona1987) and by Innis et al. (Reference Innis, Myambo, Gelfand and Brow1988), can be indirectly traced back to heating practices already accepted in 1961 as documented by the paper of Josse et al. (Reference Josse, Kaiser and Kornberg1961) who applied 100 °C for a longer time of 30 minutes.
Josse et al. report that ‘The pattern of sequence frequencies was the same in DNA synthesized with calf thymus DNA primer or with enzymatically prepared primer in which only traces of the native calf thymus DNA primer were present. The pattern was also unaltered when the primer used was denatured by heating’.
A fundamental point to be remarked concerning the paper by Josse et al. (Reference Josse, Kaiser and Kornberg1961) is the notion of unaltered pattern of frequencies. On the first page of this paper, it is clearly explained, however, that the pattern of frequencies refers to the frequency of occurrence of nucleotides. Understanding that the notion of unaltered pattern of frequencies of nucleotides is completely different from the notion of unaltered pattern of nucleotides, a fundamental question to be formulated for the sake of integrity of genetic information becomes the following: ‘To what extent the “collapse” entailed by such heating denaturation practices is reversible for the sake of the integrity of the pattern of the sequences of nucleotides?’
Geiduschek and Holtzer, in their 1962 review on light-scattering studies for the characterization of DNA, also review the stability of DNA in aqueous solutions to acids and heat and summarize the findings achieved at their time into the following sentences (see pp. 489–490 therein): ‘No distinction between heat and acid denaturation is to be made. By suitable adjustment of these variables, it is possible to deform DNA without change of molecular weight although denaturation may under the proper circumstances be followed by degradation or even aggregation’. Also, they write: ‘The native helical structure of DNA can be disrupted in a variety of ways not involving changes of its chemical constitution’ and specify that among other causes ‘addition of acid […], heating […] are all capable of producing denaturation’. A list of 13 references supports this last assertion on heating denaturation. These references are examined according to their ability to provide settling elements of evidence for answering the key research question of the present study: if, and how, at the PCR heating temperatures, above 90 °C, an onset of longitudinal sequence-breaking random fragmentation of DNA molecules is possible, and under which conditions. The works of this list of 13 references containing fundamental elements for answering are reviewed in closer detail in section ‘Pioneering pre-1961 studies on DNA heating not authored by Doty’ together with other fundamental publications. Four of these 13 works are, instead, more briefly reviewed hereafter (explaining the reason for such a briefer review).
-
– The scientific content of the one-page conference proceeding by Butler, Shooter, and Pain (Reference Butler, Shooter and Pain1956) containing their report at the 1955 Third International Congress of Biochemistry in Bruxelles is more broadly presented and discussed in the six-pages publication by Shooter et al. (Reference Shooter, Pain and Butler1956) in the journal Biochimica et Biophysica Acta submitted just 1 month after the conference, on September 1955. This last scientific publication is reviewed in detail in sections ‘Estimates of molecular weight from viscosity-sedimentation experiments’ and ‘Molecular weight from combined sedimentation/viscosity measurements and the scientific debate among Doty, Shooter and coworkers’.
-
– From the 1955 book ‘The Nucleic Acids’ edited by Davidson and Chargaff, and contained among the 13 references by Geidusheck, no specific conclusive information can be retrieved on the effect of heating, in terms of proof or disproof of the occurrence of sequence-breaking longitudinal fragmentation. In particular concerning heating at 100 °C, in the fifth chapter on hydrolysis of nucleic acids by Loring (Reference Loring, Chargaff and Davidson1955) on page 196 it can be read: ‘The purine bases of DNA are easily removed by mild acid treatment (heating the free nucleic acid in 2% solution at boiling water bath temperature for 10 minutes) apparently without complete degradation of the original polynucleotide structure. The material remaining was early recognized as a complex substance’. In Chargaff’s tenth chapter of the same book (1955), the distinction between denaturation and degradation is discussed. Concerning the meaning of denaturation, it can be read: ‘A mild, but persistent, mistreatment of a protein leads to a state of malaise known, vaguely, as denaturation’. The Author writes: ‘The line separating a denaturation product from a degradation product is not clearly drawn; but one could define as denaturation products those substances whose preparation caused interference with the physical properties, but not with the chemical composition, of the parent nucleic acid, while the latter change will form part of the description of a degradation product’. This definition is understood to leave the question completely open on whether the word denaturation contemplates or not a disruption and/or a randomization of the genetic sequence by sequence-breaking fragmentations and sequence-recombining aggregations. However, no specific review or discussion of heating effects is reported in Chargaff’s chapter and in the remainder of this book. Concerning molecular weight decay as a primary indicator of possible longitudinal sequence-breaking fragmentation, the reassuring conclusion achieved by Reichmann et al. (Reference Reichmann, Bunce and Doty1953) is reported by Chargaff that the adjustment of calf thymus DNA solutions (in 0.2 M NaCl), to pH 2.6 by dialysis ‘did not affect the molecular weight (7,700,000), as determined by light scattering’. This conclusion by Reichmann et al. quoted in reference (Reference Reichmann, Bunce and Doty1953) is closely reviewed herein in section ‘A fundamental digression on the detection of DNA acidic degradation by light scattering with a confutation’ together with the underlying experimental evidence. Concerning stability to heat, even in Jordan’s chapter (Jordan, Reference Jordan, Chargaff and Davidson1955), devoted to the physical properties of nucleic acids, no decisive information is retrieved about the thermal stability to longitudinal fragmentation of the DNA molecule, apart from a mention of the protective effect of salt against heat denaturation, as found in Thomas’ work (Thomas, Reference Thomas1954a; Reference Thomas1954b). It can be read in this chapter: ‘A further protective effect of salts against heat denaturation of DNA solutions has been observed by Thomas. For calf thymus DNA in sodium chloride solutions of various concentrations, some denaturation occurs at room temperature at <10–4 M and below 70° in 10–2 M. Denaturation is strongly inhibited even at 100 ° C in 10–1 M and M solutions. It is claimed that heat denaturation occurs stepwise and that the critical temperature for each step varies for DNA from different sources. Thus, DNA from starfish testis in 10–2 M sodium chloride undergoes the first step in denaturation at 55 °C compared with 70 °C for that from calf thymus’. In particular, the statement that ‘Denaturation is strongly inhibited even at 100 °C in 10–1 M and M solutions’ is a quotation of Thomas (Reference Thomas1954b). Concerning this last statement by Thomas, it should be remarked that Thomas detects denaturation by changes in optical density at 260 mμ and that this measure is not conclusive neither in proof nor in disproof of occurrence of sequence-breaking longitudinal fragmentation of the DNA molecule at 100 °C in presence of these salt concentrations.
-
– Finally, the two papers by Zamenhof et al. (Reference Zamenhof, Griboff and Marullo1954, Reference Zamenhof, Leidy, Hahn and Alexander1956), among the 13 cited by Geiduschek and Holtzer (Reference Geiduschek and Holtzer1959) concerning heating degradation and denaturation, are also not reviewed in detail since these two works just extend measures of viscosity drop and bacterial transformation inactivation reported by Zamenhof et al. (Reference Zamenhof, Alexander and Leidy1953) and do not provide conclusive evidence in proof or disproof of the possibility of the onset of disruptive longitudinal sequence-breaking random fragmentation of DNA molecules in addition to the fundamental elements of evidence already reported by Zamenhof et al. (Reference Zamenhof, Alexander and Leidy1953). For this reason, herein in section ‘Evidence of vanishing of transforming activity paired by viscosity drop’ only the scientific publication by Zamenhof et al. (Reference Zamenhof, Alexander and Leidy1953) is reviewed.
-
– The remaining nine references quoted by Geiduschek and Holtzer are all reviewed in closer detail in the next subsections.
The pivotal papers of Doty et al. of the years 1955–1960
Continuing the literature review by keeping a reverse chronological order and a focus on possible evidences of molecular integrity of the sequences of nucleotides in a same strand at high temperature and/or of possible strands separation, the bibliographic scan runs across three papers by Doty and coworkers published between 1955 and 1960 (Doty and Rice, Reference Doty and Rice1955; Rice and Doty, Reference Rice and Doty1957; Applequist, Reference Applequist1961), and already mentioned in the introduction. These papers report results of physical and chemical analyses specifically devised to follow the molecular weight changes of DNA during and after a heating/cooling cycle in order to attempt to understand how depolymerization and possible strand separation progress as a consequence of heating. The conclusions of these three papers by Doty regarding the consequences of DNA heating at 100 °C deserve to be remarked since they entail significant elements of mutual disagreement (i.e., conflict among conclusions stated in these same three papers) and conflict with the conclusions of studies on DNA heating published before 1955. Some of these elements of disagreement are reported hereafter.
In particular, Doty et al. (Reference Doty, Marmur, Eigner and Schildkraut1960) conclude their study reporting, in a final summary, a very general statement: ‘When solutions of bacterial DNA are denatured by heating and then cooled, two different molecular states can be obtained in essentially pure form depending on the choice of conditions, that is, rate of cooling, DNA concentration, and ionic strength’. They continue: ‘One state corresponding to fast cooling consists of single stranded DNA having about half the molecular weight of the original DNA. The other state corresponding to slow cooling consists of recombined strands united by complementary base pairing over most of their length. This form has as much as 50 per cent of its original transforming activity and is called renatured’. The statement above is remarkably very general since, without specifying the heating temperature and the heating time, it depicts a single-stranded product resulting from complete disassociation of all hydrogen bonds between complementary strands into molecular weight halving. We will refer to this picture as the high-temperature heating + fast cooling dissociation claim. A second point of remark for the 1960 statement above is that it turns out to be in open conflict with the conclusions by Doty and Rice in two papers, one published in 1957 and the other one published as a ‘preliminary note’ in 1955 (Doty and Rice, Reference Doty and Rice1955). Their preliminary 1955 conclusion is that, upon heating a neutral saline DNA solution to 100 °C for 15 minutes, the product is ‘found to have the same molecular weight as the native DNA’ (Doty and Rice, Reference Doty and Rice1955). Such conclusion is further specified in 1957 to be inferred from light scattering studies, as the Authors write that, upon observing the effects of heating of four calf thymus DNA preparations along exposure times of 1 hour and more at temperatures from 89 °C up to 100 °C, ‘the molecular weight remains unchanged according to light scattering studies’ (Doty and Rice, Reference Doty and Rice1955). We will refer to the paradigm introduced in these last 1955 and 1957 papers by Doty and Rice as the 100 °C stable molecular weight claim. Although the Authors include bibliographical references to previous studies (Doty and Rice, Reference Doty and Rice1955), such as the study by Goldstein and Stern (Reference Goldstein and Stern1950) and Zamenhof et al. (Reference Zamenhof, Alexander and Leidy1953), which bring instead to the opposite conclusion of DNA molecules thermally fragmenting in aqueous solutions already at temperatures not higher than 81 °C, the 100 °C stable molecular weight claim is remarkable since they make no mention of the existence of such a macroscopic conflict with the previous literature. Even more remarkably, except for the 1955 preliminary note, no subsequent mention is made in Rice and Doty (Reference Rice and Doty1957) and Doty et al. (Reference Doty, Marmur, Eigner and Schildkraut1960) of Goldstein and Stern’s study among the referenced works, so that the trace of their fundamental contribution is lost.
Additional elements of perplexity rise from reading in Doty et al. (Reference Doty, Marmur, Eigner and Schildkraut1960) statements that appear to be in open conflict with both the high-temperature heating + fast cooling dissociation claim and the 100 °C stable molecular weight claim. For instance, the Authors report in Doty et al. (Reference Doty, Marmur, Eigner and Schildkraut1960) that heating pneumococcal DNA of molecular weight 8.2 million at 100 °C for 10 minutes in standard saline citrate and subsequently quickly cooling this material, they find a molecular weight of 2.0 million (see p. 471 therein). Even excluding, simplistically, any considerations of polydispersity, this evidence is neither compatible with the first claim (which would require a decrease of molecular weight by a factor of one-half) nor with the second claim (no molecular weight change).
The literature showing evidence of thermally induced DNA fragmentation and the characteristic temperatures above which this phenomenon is observed is examined in the next subsection. The discrepancies determined by the 1955 and 1957 papers by Doty and Rice with previous findings are specifically examined and critically reviewed in the subsequent main third section ‘Review of the experiments on DNA heating by Doty and Rice (Reference Doty and Rice1955, 1957)’ of the present study.
Pioneering pre-1961 studies on DNA heating not authored by Doty
Prosecuting the literature scan before 1955, results are found that imply significant elements of divergence related to the high-temperature heating + fast cooling dissociation claim and to the 100 °C stable molecular weight claim. This group of references is presented hereafter in progressive chronological order.
Evidence of viscosity drop and heat turning fibrous material into flocculent precipitate
Strong and consistent evidence of DNA thermal degradation resulting in the fragmentation into much smaller molecular products (thus incompatible with a hypothesis of orderly disassociation or with one of unchanged molecular weight) had clearly emerged in several papers between 1950 and 1960. Milestone results of experiments on thermal depolymerization showing this fragmentation evidence were described by Goldstein and Stern in 1950. The Authors report the following settling experimental observation: ‘Preliminary tests showed that a highly viscous aqueous solution of sodium desoxyribosenucleinate loses its viscosity when it is heated almost to the boiling point and then permitted to cool to room temperature. Upon adding the solution to 1.5 volumes of ethyl alcohol a flocculent precipitate is formed instead of the fibrous material yielded by “native” nucleic acid preparations’. Concerning viscosity, Figure 12 therein (reproduced in Figure 10) shows that a 0.1% solution of purified calf thymus DNA in a barbital buffer at pH 7.2, heated just 1 minute at 100 °C, experiments an irreversible drop of relative viscosity, from a value of 3.4 to a value below 1.4 (see Figure 10). Besides, the same figure shows a similar drop to a value, close to 1.4, is obtained by a 2 minutes heating at 90 °C.
Notably, Goldstein and Stern warn that an experiment that fails in detecting evidences of depolymerization (produced either sonically or thermally) is ultraviolet absorption spectrophotometry. Specifically, concerning changes upon heating in ultraviolet spectrum absorption of solutions of tetrasodium salt of DNA (therein indicated by the acronym STN), they report: ‘The examination in the Beckman spectrophotometer of a 0.048% STN solution in distilled water (after dilution to 0.008%) which had been heated for 15 minutes at 100 °C showed no change in the position of the maximum at 259 mμ or of the minimum at 231 mμ, although the relative viscosity had fallen from 3.11 to 1.35 as a result of this treatment. The rise in optical density from 1.28 to 1.46 at 259 mμ which was observed in this experiment may possibly be due to the fact that it was performed in the absence of a buffer system’.
Goldstein and Stern (Reference Goldstein and Stern1950) also warn (see section therein ‘Effect on absorption spectrum’) that when the optical density absorption spectrum is observed in the wavelengths range from 225 to 300 mμ, changes are detected only if the solvent is distilled water (‘unbuffered’ solution) while in the buffered solutions, no changes are observed. Such findings find confirmation in a study by Blout and Asadourian (Reference Blout and Asadourian1954) showing that the intensity of ultraviolet absorption of the sodium salt of DNA is dependent on the ionic strength. The intensity of absorption is highly pH dependent, in the absence of salt, in the pH range 3 to 12. These and other results therein reported, concerning various heating tests between 60 and 100 °C, lead the Authors to the conclusive observation: ‘The depolymerization of deoxyribonucleic acid by thermal treatment is of special interest in view of the high-temperature coefficient and, hence, large energy of activation, observed in the range between 60 and 100 °C (see Figure 12 therein). While this phenomenon is similar to the heat inactivation and denaturation of proteins (cf. ref. 22), there exist important differences. Thus, the nucleic acid molecules appear to be split into many small fragments on heating while the thermal denaturation of proteins, as a rule, does not lead to a significant alteration of their molecular weight, although in some instances aggregation will occur under these conditions (cf. ref. 22). This would seem to indicate that the bond strength of the sugar-phosphate links in the polynucleotide chain is smaller than that of the peptide bonds in proteins’.
In the same year, Miyaji and Price (Reference Miyaji and Price1950) found confirmation of the viscosity drop induced by heating. They also study the effect of NaCl addition coming to the following conclusion: ‘The viscosity of aqueous solutions of sodium thymonucleate is reduced both by heating and by addition of sodium chloride and other salts. If, however, the nucleate solution is heated in the presence of a sufficiently high concentration of salt, there is no further decrease in viscosity beyond that induced by the salt. The protective effect of the salt is reversible, for if the salt is removed by dialysis from the heated nucleate-salt mixture, the residual aqueous solution of nucleate again suffers a marked reduction in viscosity on heating’. They also find the singular phenomenon above 85 °C that ‘At temperatures over 85 °C, mixtures of nucleate and salt sometimes yielded a small amount of white precipitate’.
Miyaji and Price highlight the importance of discriminating whether the drop in viscosity is due to either (1) fragmentation of the DNA molecule or (2) to coiling of the DNA molecule with reduction of molecular radius yet in the absence of fragmentation, or even to a combination of the two phenomena.
Evidence of thixotropy induced by heating
Zamenhof and Chargaff (Reference Zamenhof and Chargaff1950) found that heating a 0.3 percent solution of DNA at 86 °C for 90 minutes makes the specific viscosity, $ {\eta}_{\mathrm{sp}} $
, drop from 30.3 to 3.9. They find that the solution degraded by heating can repolymerize but show that a DNA preparation degraded by heat (similar to the degradation produced by other agents such as acid and alkali) acquires a marked thixotropy (i.e., reduction of viscosity determined by forced flow and viscosity recovery as the forced flow is arrested). They also show, conversely, that an intact DNA preparation exhibits no thixotropy since its viscosity remains unaltered upon subjecting it to forced flow. They observe that this effect of induced thixotropy is irreversible since it cannot be removed by repolymerization. They conclude that their experiments show that ‘original preparations of desoxypentose nucleic acids possess unique physical properties (non-thixotropic viscosity, regular temperature-viscosity relationship) which, once lost, cannot be regained by repolymerization’. They specify that such phenomena of irreversible acquisition of thixotropy ‘were observed with desoxypentose nucleic acid preparations from calf thymus and from yeast, depolymerized not only by acid or alkali but also by heat’. Also, with Goldstein and Stern, they are among the first who ‘extend the concept of irreversible denaturation from the field of proteins to that of another group of macromolecules, the nucleic acids’ and likewise remark the irreversible character of the transformations produced in DNA by heating.
$ {\eta}_{\mathrm{sp}} $
, drop from 30.3 to 3.9. They find that the solution degraded by heating can repolymerize but show that a DNA preparation degraded by heat (similar to the degradation produced by other agents such as acid and alkali) acquires a marked thixotropy (i.e., reduction of viscosity determined by forced flow and viscosity recovery as the forced flow is arrested). They also show, conversely, that an intact DNA preparation exhibits no thixotropy since its viscosity remains unaltered upon subjecting it to forced flow. They observe that this effect of induced thixotropy is irreversible since it cannot be removed by repolymerization. They conclude that their experiments show that ‘original preparations of desoxypentose nucleic acids possess unique physical properties (non-thixotropic viscosity, regular temperature-viscosity relationship) which, once lost, cannot be regained by repolymerization’. They specify that such phenomena of irreversible acquisition of thixotropy ‘were observed with desoxypentose nucleic acid preparations from calf thymus and from yeast, depolymerized not only by acid or alkali but also by heat’. Also, with Goldstein and Stern, they are among the first who ‘extend the concept of irreversible denaturation from the field of proteins to that of another group of macromolecules, the nucleic acids’ and likewise remark the irreversible character of the transformations produced in DNA by heating.
Evidence of vanishing of transforming activity paired with viscosity drop
A biological confirmation of the simultaneous onset, at heating temperatures higher than $ {T}_{\mathrm{td}} $
= 81 °C, of irreversible viscosity drop phenomena paired with biological inactivation phenomena was reported by Zamenhof, Alexander, and Leidy in 1953. The Authors extract and purify DNA from a culture of Hemophilus influenzae that has resistance to streptomycin. They add dilutions of these aqueous solutions of purified DNA from streptomycin-resistant colonies to bacterial suspensions obtained from cultures derived from strains characterized by initial absence of resistance to streptomycin, under controlled 37 °C temperature and time. Subsequently, they add streptomycin (SM) and detect, by observing the quantity of surviving bacteria, the degree of resistance to streptomycin induced in the non SM-resistant colonies by DNA addition. Thanks to dilutions they can also measure the degree of biological activity of the extracted DNA solutions.
$ {T}_{\mathrm{td}} $
= 81 °C, of irreversible viscosity drop phenomena paired with biological inactivation phenomena was reported by Zamenhof, Alexander, and Leidy in 1953. The Authors extract and purify DNA from a culture of Hemophilus influenzae that has resistance to streptomycin. They add dilutions of these aqueous solutions of purified DNA from streptomycin-resistant colonies to bacterial suspensions obtained from cultures derived from strains characterized by initial absence of resistance to streptomycin, under controlled 37 °C temperature and time. Subsequently, they add streptomycin (SM) and detect, by observing the quantity of surviving bacteria, the degree of resistance to streptomycin induced in the non SM-resistant colonies by DNA addition. Thanks to dilutions they can also measure the degree of biological activity of the extracted DNA solutions.
As well known, biology interprets this phenomenon of induced resistance as a parasexual phenomenon, known as Griffith bacterial transformation activity, thanks to which the bacterium that initially does not have resistance to streptomycin, upon entering in contact with the purified DNA solution «acquires» the genetic code contained in the DNA molecules thus receiving the necessary instructions to build the polysaccharide bacterial capsule that gives the increase in resistance to streptomycin, and transmits it to its own lineage. They perform part of their experiments with H. influenzae after subjecting the DNA extract to heating at a variable T temperature in a pH 7.4 buffer with 0.14 M NaC1 and 0.015 M sodium citrate (upon reporting the temperature to 23 °C before each activity assay). They find that viscosity and activity are practically unaffected by 1 hour heating to temperatures (T) as high as 76–81 °C while, in a temperature range (T) between 81 and 90 °C heating, induces a more than significant reduction and, by further increasing (T), they see a drop to practically zero of the phenomenon of bacterial transformation activity.
Points on the graph of Figure 1 by the Authors on page 379 (Zamenhof et al., Reference Zamenhof, Alexander and Leidy1953), concerning measures of relative bacterial transformative activity (in percentage), have been digitized; the resulting numerical values, converted from logarithmic scale, are reported in Table 1 herein. The values of Table 1 are plotted in Figure 1 herein, reporting on the x horizontal axis the heating temperature of DNA in °C and, on the ordinates, the percentage of residual bacterial transformation activity employing a linear scale in place of the logarithmic scale of the original figure.
Table 1. Numerical values obtained by digitalization of points in Figure 1 in Zamenhof et al. (Reference Zamenhof, Alexander and Leidy1953) concerning the stability of the transforming principle preparation to heat


Figure 1. Activity versus temperature after 1 hour heating, according to Figure 1 in Zamenhof et al. (Reference Zamenhof, Alexander and Leidy1953). Ordinates are represented by an ordinary linear scale in place of the logarithmic scale of the original figure.
The evidence found in Zamenhof et al. (Reference Zamenhof, Alexander and Leidy1953), clearly represented by Figure 1 herein, is that, upon subjecting a purified DNA aqueous solution to a preliminary heating/cooling cycle bringing it to a variable temperature (T) and back again to 23 °C, the residual bacterial transformation activity is stable when T ranges between 25 and 80.9 °C. When the heating temperature T reaches 81.4 °C, the transforming activity is reduced to 15%, and, by increasing the heating temperature, the activity continues to decay rapidly to zero, so that at 90 °C it is basically absent.
A further fundamental result in Zamenhof et al. (Reference Zamenhof, Alexander and Leidy1953) concerns the stability of DNA viscosity after heating. Upon measuring viscosity in the same pH 7.4 buffer at 23 °C, the Authors find that ‘the viscosity and the activity are practically unaffected by 1 hour heating to temperatures as high as 76–81 °C’.
Concerning the possibility that heating or acidity may just induce molecular contraction and not depolymerization Zamenhof et al. also write: ‘It has recently been suggested (22, 26, 27) that the decrease in viscosity of DNA solution upon mild H+ treatment is due to the change in asymmetry caused by the contracting of the molecule rather than by actual depolymerization. This may also be true for the mild heating. The contraction may be made possible by the breakage of labile bonds (such as hydrogen bonds) under the action of thermal oscillations (40, 41). At higher temperatures, actual depolymerization may occur (32)’.
Evidence of depolimerization by ultraviolet light measurements
Thomas, in his 1954 publication on the study of the ultraviolet absorption spectrum of neutral saline NaCl (unbuffered) solution of desoxyribonucleic acids (DNA) isolated from calf thymus, starfish (Asterias glacialis) testicles, and red frog (Rana temporaria) testicle, devotes an entire section, titled ‘Effets irreversibles de la temperature sur le spectre U.V.’, on the effects of heating on changes of optical density measures. Besides finding that this measure is strongly sensitive to the NaCl concentration, he plots the graphs of the function relating the absorption at 260 mμ versus the preheating temperature and he finds sudden increases of the optical density at temperatures ranging between 55 °C and 80 °C with intermediate plateau regions in which the absorption remains constant. For calf thymus DNA he finds a maximum upper limit for stability against depolymerization corresponding to a temperature around 80 °C, in agreement with Goldstein and Stern (although these authors are not quoted by Thomas).
It is worth observing that the detection by Thomas of changes in optical density as a function of heating temperature is also in agreement with the explanation by Goldstein and Stern since Thomas employs unbuffered solutions.
Detection of depolymerization by staining
Measurements indicating depolymerization of DNA are summarized by Kurnick (Reference Kurnick1954a) and recalled in the following list:
-
– reduction in viscosity;
-
– reduction in the rate of sedimentation in the ultracentrifuge;
-
– increase in ultraviolet absorption (detectable in unbuffered solutions);
-
– lowering of PH;
-
– formation of acid-soluble and dialyzable products.
Based on his previous study (Kurnick, Reference Kurnick1954b), where he showed that methyl green selectively stains only highly polymerized desoxyribonucleic acid and fails to stain, to any significant extent, depolymerized desoxyribonucleic acid and ribonucleic acid, Kurnick introduces a new methodology for studying depolymerization induced by heat (Kurnick, Reference Kurnick1954a). From experiments on calf thymus DNA, among which ultracentrifugation patterns of DNA solutions, with and without 0.02% methyl green, heated to 80° for 7 hours, and to 100° for 1 hour or 2 hours as well as on unheated DNA, he finds that ‘Heat and enzymatic depolymerization of DNA produce certain effects in common: both reduce the viscosity of the solution rapidly […], increase the ultraviolet absorption […] and reduce methyl green affinity’. He remarks that ‘These changes are maximal before any dialyzable, acid-soluble oligonucleotides are formed […] and nearly maximal before reduction in sedimentation rate appears’. He adds: ‘The products of heat and initial enzymatic digestion (and of sonic depolymerization) are large molecules which, as judged by their sedimentation velocity, are probably still quite asymmetric rods. This hypothesis is in better accord with the unaltered sedimentation rate (despite marked reduction in viscosity) than the alternative suggestion (citation of Creeth et al., Reference Creeth, Gulland and Jordan1947 and Conway and Butler, Reference Conway and Butler1952) that heat has produced collapsed molecules of the original molecular weights. Such collapsed molecules would show a great reduction in viscosity, but would also show considerable change in sedimentability’.
He conclusively provides an explanation of the heating degradation at 100 °C in terms of ‘bombardment by the solvent molecules’: ‘Thus, at l00°C, a molecule with very low intrinsic viscosity, but of a considerable size as characterized by its non-dialyzability, sedimentability, and affinity for methyl green […] is stable. This suggests that the increased bombardment by the solvent molecules at elevated temperature snaps the rigid molecule into still large units, but of such lesser size as to be stable when subjected to the bombardment characteristic of this temperature’.
From the background above on the studies on thermal depolymerization published between 1950 and 1954, it consistently emerges that heating at temperatures above 81°, or just above 81°, ordinarily produces depolymerization (or disaggregation) in purified DNA solutions. For completeness, it is worth adding that a residual possibly conceivable alternative justification explaining the drop in viscosity could be the hypothesis considered by Creeth et al. (Reference Creeth, Gulland and Jordan1947) of a coiling of the DNA molecule capable of ‘reducing the molecular asymmetry but not the molecular weight’. It should be pointed out, however, that such a coiling hypothesis is drawn in Conway and Butler (Reference Conway and Butler1952) to explain a decrease in viscosity observed after the addition of NaCl, occurring without production of titratable groups and that in Creeth et al. (Reference Creeth, Gulland and Jordan1947) no heating experiments are carried out.
Estimates of molecular weight from viscosity-sedimentation experiments
An important contribution comprehensively accounting for most of the previously published literature on the effect of DNA heating, confirming Goldstein and Stern’s conclusion on DNA fragmentation above 81°, is a physical chemical study by Dekker and Schachman (Reference Dekker and Schachman1954). This study, while essentially focused on the assessment of different investigated models for the possible macromolecular structure of DNA (among which also models differing from the Watson and Crick double helical chain (Watson and Crick, Reference Watson and Crick1953)), is important for the sake of understanding the effect of heating, since it reports a simple quantitative estimate of the molecular weight change before and after heating due to fragmentation, by a calculation from sedimentation and viscosity data before and after heating.
Dekker and Schachman do not exclude ab initio a possible coiling of the DNA molecule determined by heating and they are the first to point out that paired measurements of viscosity and sedimentation rate of dilute solutions of DNA and heated DNA could differentiate between a disorganization of the DNA molecule without a change in molecular weight (coiling), on one side, and a process in which there is a degradation into much smaller pieces, on the other side. Their key reasoning is that if, upon heating, the DNA molecule is divided into smaller fragments, the viscosity must decrease and the sedimentation coefficient must decrease as well, while, in case heating should produce just a coiling of the molecule, unlike viscosity the sedimentation must instead increase.
Based on their experimental measurements, the Authors make the fundamental observation which compels them to exclude a hypothesis of thermal coiling as they write: ‘The reduced viscosity of a 0.005 percent solution heated at pH 7 for 15 minutes at 100 °C. decreased from 30 (gm/100 cc)−1 to less than 1.0 (gm/100 cc)−1. Instead of an increase in the sedimentation rate, which would be expected from the amount of coiling necessary to produce such a large drop in viscosity, we found that measurements at 0.005 percent DNA showed that the heated material had a sedimentation coefficient of about 6S, whereas the unheated preparation had a value of nearly 20S. These experiments provide proof that the molecular weight of DNA changes from about 5 $ \times $
106 to 5
$ \times $
106 to 5 $ \times $
104 as a result of this mild heating procedure’. In the previous quotation, uppercase S indicates the Svedberg unit which corresponds to
$ \times $
104 as a result of this mild heating procedure’. In the previous quotation, uppercase S indicates the Svedberg unit which corresponds to $ s\times {10}^{-13} $
where
$ s\times {10}^{-13} $
where $ s $
stands here for seconds. It is also worth recalling that the reduced viscosity,
$ s $
stands here for seconds. It is also worth recalling that the reduced viscosity, $ {\eta}_{\mathrm{red}} $
, is related to the viscosity
$ {\eta}_{\mathrm{red}} $
, is related to the viscosity $ \eta $
through the following relations:
$ \eta $
through the following relations: $ {\eta}_{\mathrm{red}}={\eta}_{\mathrm{sp}}/c $
where
$ {\eta}_{\mathrm{red}}={\eta}_{\mathrm{sp}}/c $
where $ c $
is the concentration and
$ c $
is the concentration and $ {\eta}_{\mathrm{sp}} $
is the specific viscosity
$ {\eta}_{\mathrm{sp}} $
is the specific viscosity $ {\eta}_{\mathrm{sp}}={\eta}_r-1 $
, being
$ {\eta}_{\mathrm{sp}}={\eta}_r-1 $
, being $ {\eta}_r=\eta /{\eta}_0 $
the relative viscosity defined as the ratio of solution viscosity
$ {\eta}_r=\eta /{\eta}_0 $
the relative viscosity defined as the ratio of solution viscosity $ \eta $
to solvent viscosity
$ \eta $
to solvent viscosity $ {\eta}_0 $
. The intrinsic viscosity
$ {\eta}_0 $
. The intrinsic viscosity $ \left[\eta \right] $
is obtained by extrapolation of reduced viscosity against concentration at infinite dilution,
$ \left[\eta \right] $
is obtained by extrapolation of reduced viscosity against concentration at infinite dilution, $ c=0 $
, viz.:
$ c=0 $
, viz.: $ \left[\eta \right]=\underset{c\to 0}{\lim }{\eta}_{\mathrm{sp}}/c $
(Cox et al., Reference Cox, Overend, Peacocke and Wilson1958; Perry et al., Reference Perry, Chilton, Kirkpatrick, Perry, Chilton and Kirkpatrick1963).
$ \left[\eta \right]=\underset{c\to 0}{\lim }{\eta}_{\mathrm{sp}}/c $
(Cox et al., Reference Cox, Overend, Peacocke and Wilson1958; Perry et al., Reference Perry, Chilton, Kirkpatrick, Perry, Chilton and Kirkpatrick1963).
The proportion behind this simple quantitative estimate by Dekker and Schachman can be presented as follows. Denoting by $ M $
the average weight of the DNA molecule, or of its fragment produced upon heating (assuming here introductively and simplistically that all molecules or fragments have the same weight and molecular hydrodynamic radius
$ M $
the average weight of the DNA molecule, or of its fragment produced upon heating (assuming here introductively and simplistically that all molecules or fragments have the same weight and molecular hydrodynamic radius $ {r}_s $
), the following direct proportionality holds
$ {r}_s $
), the following direct proportionality holds
 $$ M\hskip0.4em \propto \hskip0.4em \left({r}_s\times s\times \eta \right), $$
where $ s $
is now the sedimentation constant,
$ s $
is now the sedimentation constant, $ \eta $
the viscosity, and
$ \eta $
the viscosity, and $ \hskip0.4em \propto \hskip0.4em $
is the symbol of direct proportionality. References for the proportion above, which is obtained by combining Svedberg’s equation (Svedberg, Reference Svedberg1938) with Stokes-Einstein’s equation, can be found in treatises of physical chemistry of macromolecules such as Barrow’s treatise (see, e.g., Barrow, Reference Barrow1966, Chap. 20 and, in particular, p. 659, Equation (23)). Fundamental more advanced investigations, contemporary to those years, based on careful consideration of the hydrodynamic Stokes’s law, empirical data for long-chain polymers, dimensionless analysis, and investigation of universal constant for flexible long chain polymers such as DNA can be found in Mandelkern et al. (Reference Mandelkern, Krigbaum, Sheraga and Flory1952) and related references.
$ \hskip0.4em \propto \hskip0.4em $
is the symbol of direct proportionality. References for the proportion above, which is obtained by combining Svedberg’s equation (Svedberg, Reference Svedberg1938) with Stokes-Einstein’s equation, can be found in treatises of physical chemistry of macromolecules such as Barrow’s treatise (see, e.g., Barrow, Reference Barrow1966, Chap. 20 and, in particular, p. 659, Equation (23)). Fundamental more advanced investigations, contemporary to those years, based on careful consideration of the hydrodynamic Stokes’s law, empirical data for long-chain polymers, dimensionless analysis, and investigation of universal constant for flexible long chain polymers such as DNA can be found in Mandelkern et al. (Reference Mandelkern, Krigbaum, Sheraga and Flory1952) and related references.
Dekker and Schachman’s estimate (Dekker and Schachman, Reference Dekker and Schachman1954) stems from the simplistic consideration that the hydrodynamic radius remains unchanged upon heating so that, denoting by subscripts $ N $
and
$ N $
and $ H $
the quantities relevant to native DNA and to DNA possibly fragmented by heating, respectively, one infers from Eq. (1) setting
$ H $
the quantities relevant to native DNA and to DNA possibly fragmented by heating, respectively, one infers from Eq. (1) setting $ {r_s}_N={r_s}_H $
:
$ {r_s}_N={r_s}_H $
:
 $$ \frac{M_N}{M_H}=\frac{{r_s}_N}{{r_s}_H}\times \frac{s_N}{s_H}\times \frac{\eta_N}{\eta_H}=1\times \frac{20}{6}\times \frac{30}{1}=100. $$
Shooter et al. (Reference Shooter, Pain and Butler1956) also dedicate a study to examining the effect of thermal degradation above 80 °C on DNA. Based on their experiments they propose some simple graphical models suggesting the effects of heating on DNA (see the reproduction in current Figure 2).

Figure 2. Suggested effect of heating, Figure 4 in Shooter et al. (Reference Shooter, Pain and Butler1956). (a) fraying out of single strands from main structure; (b) collapse of main structure about the more flexible parts of the molecule which are joined only by single strands of nucleotides; (c) molecule breaking up into smaller units. Reprinted from Shooter et al. (Reference Shooter, Pain and Butler1956, p. 501), Copyright (1956), with permission from Elsevier.
They conclude their study stating that after 15 minutes heating at 100 °C, DNA samples always produce thermal degradation. They remark that the extent of degradation and the distribution of the size and shape of the fragments produced depends on how DNA is prepared.
Evidence of irreversibility of heating degradation from titration analyses
Titration analyses although do not provide direct quantification of molecular weight decrease and direct evidence of possible onset of disruptive longitudinal sequence-breaking random fragmentation of DNA molecules, can detect however some irreversible features occurring during the heating process and the quantity of broken hydrogen bonds. For these reasons, part of these works on titration relevant to DNA heating are hereafter reviewed.
The study by Cavalieri and Rosenberg (Reference Cavalieri and Rosenberg1957) reports potentiometric titration analyses on DNA solutions using calomel and glass electrodes. The study ascertains the conditions under which hydrogen bonds in DNA can be cleaved reversibly by heat, and the conditions under which hydrogen bonds cleave spontaneously and irreversibly. Concerning the temperature at which irreversible phenomena are observed the Authors report: ‘A temperature is finally reached (about 70° in 0.017 M NaCl, for example) at which denaturation occurs without titrating any bases, and cannot be prevented by heating in buffers of any pH. In such cases, the original H-bonds of DNA must all be thermally and irreversibly cleaved’.
Cox and Peacocke (Reference Cox and Peacocke1956) prior to presenting their results on electrometric titration well summarize the contemporary debate on the stability of the molecular weight to heating: ‘When sodium deoxyribonucleate is heated in neutral aqueous solution, irreversible changes occur above a critical temperature which varies with the source of the deoxyribonucleate and its method of extraction. These irreversible changes, which often take place over a temperature range of only a few degrees, include a drop in the viscosity; an increase in the ultraviolet absorption; a displacement of the spectrophotometric titration curves; the appearance of new infrared absorption bands; changes in sedimentation constant; and displacement of the titration curves. Some investigators deduced a decrease in molecular weight from sedimentation and viscosity measurements after the nucleate had been heated in water (Dekker and Schachman, Reference Dekker and Schachman1954; Sadron, Reference Sadron1955), and in salt (Shooter et al., Reference Shooter, Pain and Butler1956), whereas others reported (Doty and Rice, Reference Doty and Rice1955; Sadron, Reference Sadron1955) no change in molecular weight after heating in the presence of sufficient sodium chloride’ (notice that, in the quotation above, text references originally reported in superscript format have been converted into the current squared brackets format adding also author and year). They summarize in Figure 2 therein that the percentage of ruptured hydrogen bonds in herring-sperm in a (0.15%, 0.05 M -NaCl) solution heated for 1 hour at 95 °C is 100%. Moreover, on the basis of these titration experiments the Authors infer evidence for ‘the random nature of the heat-denaturation process’.
We incidentally remark that the statement by Cox and Peacocke (Reference Cox and Peacocke1956), according to which Sadron (Reference Sadron1955) would report no change in molecular weight after heating in the presence of sufficient sodium chloride, appears to be incorrect as the data in this publication by Sadron show in all cases a decrease of the molecular weight after heating except for just one case where it is reported even an increment of molecular weight. This issue is examined in detail in section ‘Evidence from light scattering of DNA fragmentation upon heating’ dedicated to the light scattering measurements by Sadron on heated DNA.
Cox and Peacocke (Reference Cox and Peacocke1957) specify the limit of titration in detecting changes in molecular weight: ‘ionizing radiations invariably and heat, under certain conditions, also cause changes in molecular weight but this degradative aspect of their action will not be considered further here, if only for the reason that the titration curves can only just detect a release of one secondary phosphoryl end group in 50 nucleotides’.
Most importantly, Cox, Overend, Peacocke, and Wilson (Reference Cox, Overend, Peacocke and Wilson1955) in their publication on Nature, reaffirm that ‘it is only changes in the intrinsic viscosity which are of significance in the estimation of molecular size and shape’ and propose the employment of the following expression, usual for high weight polymers, relating intrinsic viscosity $ \left[\eta \right] $
to the viscosity-average molecular weight,
$ \left[\eta \right] $
to the viscosity-average molecular weight, $ {M}_v\hskip-0.2em : $
 $$ \left[\eta \right]=K{\left({M}_v\right)}^{\alpha }, $$
where $ K $
and
$ K $
and $ \alpha $
are constants for homologous polymers. Based on their experimental data the Authors compute
$ \alpha $
are constants for homologous polymers. Based on their experimental data the Authors compute $ \alpha =0.93 $
. Remarkably, agreement with this value is found by the same Doty and coworkers who later computed in 1960 from two DNA preparations from Diplococcus Pneumoniae DNA and Escherichia coli two determinations of
$ \alpha =0.93 $
. Remarkably, agreement with this value is found by the same Doty and coworkers who later computed in 1960 from two DNA preparations from Diplococcus Pneumoniae DNA and Escherichia coli two determinations of $ \alpha $
and
$ \alpha $
and $ K $
whose average value is
$ K $
whose average value is $ \alpha =0.923 $
and
$ \alpha =0.923 $
and $ K=3.28 $
. The exponent close to unity signifies that the relation between viscosity-average molecular weight and intrinsic viscosity is almost linear.
$ K=3.28 $
. The exponent close to unity signifies that the relation between viscosity-average molecular weight and intrinsic viscosity is almost linear.
Use of this formula with the intrinsic viscosity data, measured before and after a heating treatment, allows to compute the drops from the molecular weight of the unheated molecule $ {M}_N $
to the weight of the molecule after heating,
$ {M}_N $
to the weight of the molecule after heating, $ {M}_H $
, by the following formula:
$ {M}_H $
, by the following formula:
 $$ \frac{M_H}{M_N}={\left(\frac{{\left[\eta \right]}_H}{{\left[\eta \right]}_N}\right)}^{1/0.923}={\left(\frac{{\left[\eta \right]}_H}{{\left[\eta \right]}_N}\right)}^{1.083}. $$
On the basis of light-scattering experiments and viscosity measurements on DNA degraded by gamma rays, Peacocke and Preston (Reference Peacocke and Preston1958) improve the precision of the determination of coefficients $ \alpha $
and
$ \alpha $
and $ K $
in Eq. (3). They find a round value
$ K $
in Eq. (3). They find a round value $ \alpha =1.0 $
for the exponent and find
$ \alpha =1.0 $
for the exponent and find $ K=3.28. $
They also find that the weight-average molecular weight
$ K=3.28. $
They also find that the weight-average molecular weight $ {M}_w $
is related to intrinsic viscosity by:
$ {M}_w $
is related to intrinsic viscosity by:
 $$ \left[\eta \right]=4.26\times {\left({M}_w\right)}^{1.00}. $$
Most importantly, they find a remarkable consistency of the value $ {M}_w $
obtained from Eq. (5) with countercheck values obtained by light scattering measures, so that Eq. (5) can be considered a reliable choice for determining molecular weight from intrinsic viscosity, substitutive of light scattering measurements.
$ {M}_w $
obtained from Eq. (5) with countercheck values obtained by light scattering measures, so that Eq. (5) can be considered a reliable choice for determining molecular weight from intrinsic viscosity, substitutive of light scattering measurements.
Employing the data reported by Shooter et al. (Reference Shooter, Pain and Butler1956) concerning measurements before and after 15 minutes heating at 100 °C on different samples and also in the absence of salt (see Table I therein), the viscosity-based average weight of the heated DNA molecules is computed from Eq. (4) to range between 1.45% and 5.01% of the average weight before heating, what signifies a depolymerization in considerably shorter fragments.
Models for random degradation matching experimental data
Kinetic molecular models provide a valuable mean for computing the number of scissions (fragmentations in shorter segments) that the DNA molecule undergoes during a heating experiment and the rate of fragmentations, that is the number of fragmentations per unit of time, based on diagrams of molecular weight plotted versus time.
Peacocke and Preston (Reference Peacocke and Preston1958), proceeding from viscosity and light scattering experiments on DNA samples degraded after exposure at different doses of gamma rays, find that internucleotide phosphodiester bonds in DNA are ruptured by a random fragmentation process. Fragmentation is the process which divides the molecule into shorter segments of lower molecular weight. They experimentally find for DNA an almost quadratic relation (exponent 1.85) between the radiation dose $ R $
and the intrinsic viscosity
$ R $
and the intrinsic viscosity $ \left[\eta \right] $
instead of the linear relation characteristic of single-strand polymers. From such fundamental difference, they infer that in DNA (and in any other similar double-stranded polymer) the fragmentation of the molecule in a fragmentation process must be generated by a double breakage mechanism. This mechanism consists of the breakage of two intra-chain longitudinal bonds each located at two facing nucleotides situated at the same longitudinal position of the molecule but belonging to opposite strands. This mechanism is mathematized in the context of molecular weight distributions (Charlesby, Reference Charlesby1954). In this context, the distinction is made between the number-average molecular weight
$ \left[\eta \right] $
instead of the linear relation characteristic of single-strand polymers. From such fundamental difference, they infer that in DNA (and in any other similar double-stranded polymer) the fragmentation of the molecule in a fragmentation process must be generated by a double breakage mechanism. This mechanism consists of the breakage of two intra-chain longitudinal bonds each located at two facing nucleotides situated at the same longitudinal position of the molecule but belonging to opposite strands. This mechanism is mathematized in the context of molecular weight distributions (Charlesby, Reference Charlesby1954). In this context, the distinction is made between the number-average molecular weight $ {M}_n $
(which is the arithmetic mean of the weights) and the weight-average molecular weight
$ {M}_n $
(which is the arithmetic mean of the weights) and the weight-average molecular weight $ {M}_w $
(which is the weighted arithmetic mean in which the molecular weights themselves are taken as the averaging weights). For a uniform distribution
$ {M}_w $
(which is the weighted arithmetic mean in which the molecular weights themselves are taken as the averaging weights). For a uniform distribution $ {M}_w={M}_n $
while for a random distribution (i.e., a distribution generated from random fracture of an infinite chain)
$ {M}_w={M}_n $
while for a random distribution (i.e., a distribution generated from random fracture of an infinite chain) $ {M}_w=2{M}_n $
.
$ {M}_w=2{M}_n $
.
The considerations of Peacocke and Preston are conveniently summarized hereafter in the format of proportionality relations. The weight-average molecular weight $ {M}_w $
and number-average molecular weight
$ {M}_w $
and number-average molecular weight $ {M}_n $
are related to the number of fragmentations
$ {M}_n $
are related to the number of fragmentations $ F $
per original number-average molecule:
$ F $
per original number-average molecule:
 $$ F=\frac{{\left({M}_w\right)}_0}{\left({M}_w\right)}-1=\frac{{\left({M}_n\right)}_0}{\left({M}_n\right)}-1, $$
where the 0 subscript indicates the original molecular weight of the molecule before fragmentation starts. We recall that in special cases for a higher number of molecules and fractures ( $ F\gg 1\Big) $
relation above can be represented as the proportionality relation:
$ F\gg 1\Big) $
relation above can be represented as the proportionality relation:
 $$ F\hskip0.4em \propto \hskip0.4em \frac{1}{M_n}. $$
For degradation by radiation of single-strand polymer chains it is ordinarily expected that the probability of single chain break $ {p}_s $
and the radiation dose
$ {p}_s $
and the radiation dose $ R $
are related to fragmentation by:
$ R $
are related to fragmentation by:
 $$ F\hskip0.4em \propto \hskip0.4em {p}_s\hskip0.4em \propto \hskip0.4em R $$
what should imply from (7) that $ \frac{1}{M_n}\hskip0.4em \propto \hskip0.4em R $
. Peacocke and coworkers find instead, experimentally, that after a transitory range of exposition, the proportionality holds:
$ \frac{1}{M_n}\hskip0.4em \propto \hskip0.4em R $
. Peacocke and coworkers find instead, experimentally, that after a transitory range of exposition, the proportionality holds: $ \frac{1}{M_n}\hskip0.4em \propto \hskip0.4em {R}^2 $
. They explain in terms of probability distributions such evidence, unusual for single-stranded polymers, to be the consequence of a fragmentation process in which a fragmentation is produced when two intra-chain scissions at opposite strands in two facing nucleotides occur (or in two proximal nucleotides). The probability of this double-step process is shown to follow the proportionality
$ \frac{1}{M_n}\hskip0.4em \propto \hskip0.4em {R}^2 $
. They explain in terms of probability distributions such evidence, unusual for single-stranded polymers, to be the consequence of a fragmentation process in which a fragmentation is produced when two intra-chain scissions at opposite strands in two facing nucleotides occur (or in two proximal nucleotides). The probability of this double-step process is shown to follow the proportionality $ {p}_D\hskip0.4em \propto \hskip0.4em {p}_s^2 $
, so that, owing to the previous proportionality relations, one has:
$ {p}_D\hskip0.4em \propto \hskip0.4em {p}_s^2 $
, so that, owing to the previous proportionality relations, one has:
 $$ F\hskip0.4em \propto \hskip0.4em {p}_D\hskip0.4em \propto \hskip0.4em {p}_s^2\hskip0.4em \propto \hskip0.4em {R}^2. $$
Owing to the previous equation and to (7) one finally has for DNA and any double-stranded polymer the theoretical prediction:
 $$ \frac{1}{M_n}\hskip0.4em \propto \hskip0.4em {R}^2\hskip0.5em \mathrm{or}\ \mathrm{equivalently}\hskip0.5em \frac{1}{\sqrt{M_n}}\hskip0.4em \propto \hskip0.4em R. $$
It is important to highlight the difference between the previous relation (10) and the corresponding relation for single-stranded polymers which reads instead:
 $$ \frac{1}{M_n}\hskip0.4em \propto \hskip0.4em R. $$
Peacocke and Preston find that, for gamma-rays degradation of DNA, Eq. (10) is closely respected and consider this as evidence that the fragments ensuing from gamma-ray degradations are always double-stranded.
The Authors also investigate the effect on the molecular weight of heat degradation (100 °C along 15 minutes in a 0.1 M NaCl solution) applied to fragments obtained by previous gamma-ray degradation. Their data shows this thermal treatment yields a decrease in molecular weight, but the Authors underline that quantitative appreciation of the entity of molecular weight decrease and number of fractures is made difficult by the ‘the known tendency for the polynucleotide chains to remain entangled, in spite of the removal of hydrogen bonding, and for separated chains to re-aggregate on cooling’.
A kinetic statistical model for random degradation of a two-stranded polymer, specifically devised by Applequist (Reference Applequist1961) to analyze DNA degradation, provides a more detailed description of the kinetics of double fracture proposed by Peacocke and Preston. This model by Applequist accounts for independent probabilities of intrachain fractures (termed P-bonds by the Author) and crosslinking hydrogen bonds (H-bonds).
Denoting by $ p $
the fraction of broken P-bonds, by
$ p $
the fraction of broken P-bonds, by $ q $
the fraction of broken H-bonds, and by
$ q $
the fraction of broken H-bonds, and by $ p^{\prime } $
the probability that a pair of facing nucleotides is followed by a double chain break, they compute that at the beginning of the degradation process, when almost all P-bonds are unbroken, the relation holds:
$ p^{\prime } $
the probability that a pair of facing nucleotides is followed by a double chain break, they compute that at the beginning of the degradation process, when almost all P-bonds are unbroken, the relation holds:
 $$ {p}_D=\frac{\left(1+q\right){p}_s^2}{\left(1-q\right)}. $$
This relation is a more explicit determination of the proportionality relation highlighted by Peacocke and Preston and contained in Eq. (9). By further introducing the simplest assumption that P-bonds are broken by a first-order rate process, namely, $ 1-p=\left(1-{p}_0\right)\bullet {e}^{-\mathrm{kt}} $
corresponding in the early stages of degradation when
$ 1-p=\left(1-{p}_0\right)\bullet {e}^{-\mathrm{kt}} $
corresponding in the early stages of degradation when $ \mathrm{kt}\ll 1 $
to the linearized law
$ \mathrm{kt}\ll 1 $
to the linearized law $ p={p}_0+\left(1-{p}_0\right)\bullet \mathrm{kt} $
, they find that the linear relation:
$ p={p}_0+\left(1-{p}_0\right)\bullet \mathrm{kt} $
, they find that the linear relation:
 $$ {\left(\frac{M_{w0}}{M_w}\right)}^{1/2}=1+\frac{1-{p}_0}{p_0}\mathrm{kt} $$
excellently fits the asymptotic trend in experimental data $ {M}_w(t) $
obtained from enzymatic degradation (Schumaker et al., Reference Schumaker, Richards and Schachman1956), acidic degradation (Thomas and Doty, Reference Thomas and Doty1956), and thermal degradation (Doty et al., Reference Doty, Marmur, Eigner and Schildkraut1960). The data for thermal degradation is reported together with the fit provided by Eq. (13) (divided by
$ {M}_w(t) $
obtained from enzymatic degradation (Schumaker et al., Reference Schumaker, Richards and Schachman1956), acidic degradation (Thomas and Doty, Reference Thomas and Doty1956), and thermal degradation (Doty et al., Reference Doty, Marmur, Eigner and Schildkraut1960). The data for thermal degradation is reported together with the fit provided by Eq. (13) (divided by $ {\left({M}_{w0}\right)}^{1/2} $
) in Figure 3a,b, respectively.
$ {\left({M}_{w0}\right)}^{1/2} $
) in Figure 3a,b, respectively.
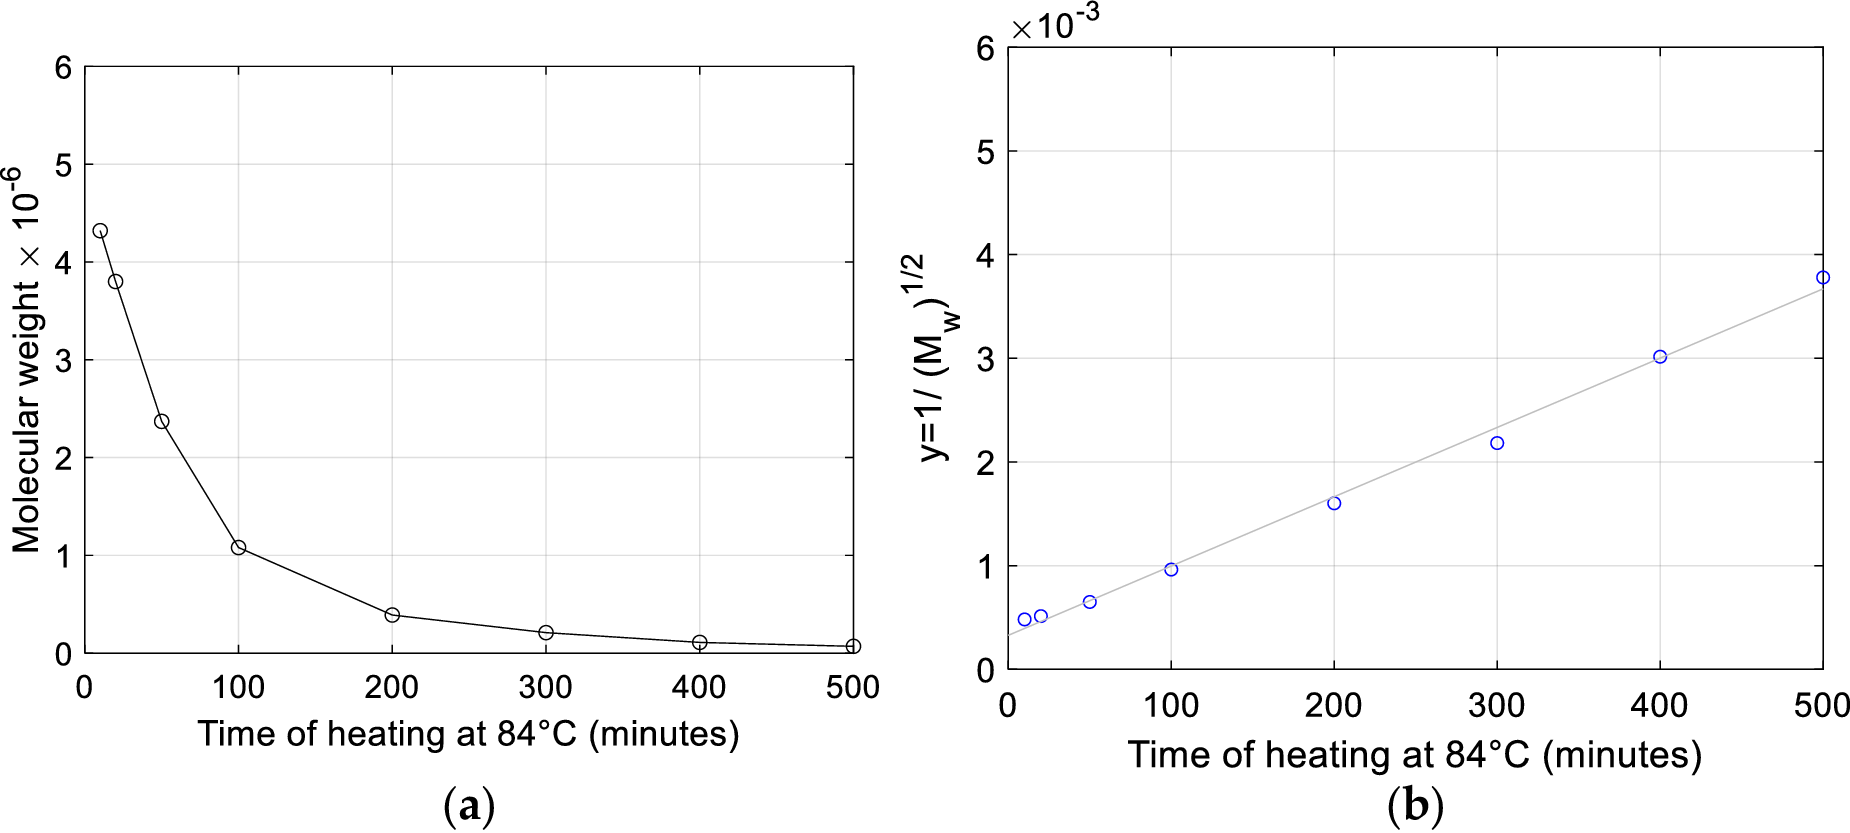
Figure 3. (a) Thermal degradation of diplococcus pneumoniae DNA; data digitized from Doty et al. (Reference Doty, Marmur, Eigner and Schildkraut1960). (b) Same data represented in the format of Eq. (13) and corresponding least-square linear fit.
This very close fit constitutes a strong proof that the DNA remains actually two-stranded during the thermal degradation process investigated by Doty et al. (Reference Doty, Marmur, Eigner and Schildkraut1960). This observation is pivotal for the focus of our study for three reasons:
-
1) Fragmentation rules out also the plausibility of the 100 °C stable molecular weight claim.
-
2) Doty et al. (Reference Doty, Marmur, Eigner and Schildkraut1960), based on the circumstance that one of their determination of the molecular weight of the DNA heated at 84° is approximately decreased by a factor of two (from 10.5 million to 5.0 million), advance the claim that ‘with aggregation eliminated and depolymerization taken into account it can be said that strand separation did occur in the very early stages of the exposure to the elevated temperature’. Conversely, the fit in Figure 3b shows the two-stranded character of the heated DNA and points to the clear evidence that the continuous fall of molecular weight is the result of progressive fragmentation into pieces that substantially remain two-stranded, so that the molecular weight halving recorded by Doty et al. is only fortuitously in agreement with the value of ½, as remarkably first pointed out by Applequist (Reference Applequist1961). In this respect it is worth acknowledging that also Doty et al. (Reference Doty, Marmur, Eigner and Schildkraut1960) in the statement above mention the necessity to account for ‘depolymerization’, thus duly excluding the possibility that halving of molecular might correspond to separation of intact single strands.
-
3) The elucidation of the substantial two-stranded character of the material produced by heating, besides confuting the 100 °C dissociation claim, as advanced by Doty et al. in the same paper (Doty et al., Reference Doty, Marmur, Eigner and Schildkraut1960), raises the question of the very meaningfulness of heating denaturation for the purpose of strand separation.
A second important highlight in the contribution by Applequist is the role of the initial induction relatable to the presence of an initially uniform distribution of molecular weights and the determination based on the data by Shumaker et al. of the presence of initially broken P-bonds corresponding to $ {p}_0=1.57\times {10}^{-2} $
. This numerical determination will be recalled in the discussion of section ‘What really happens during DNA thermal fragmentation?’.
$ {p}_0=1.57\times {10}^{-2} $
. This numerical determination will be recalled in the discussion of section ‘What really happens during DNA thermal fragmentation?’.
An examination of the type of intra-strand bond breakage is reported in the fourth main section ‘Discussion on the structural resilience of DNA chains after reiterated PCR cycles’ based on a closer review of the insightful analysis by Dekker and Schachman (Reference Dekker and Schachman1954).
Evidence from light scattering of DNA fragmentation upon heating
This subsection reviews determinations of DNA degradation by heating via light-scattering experiments reported in publications other than those by Doty and Rice of 1955 and 1957, which are instead more closely reviewed in the dedicated third main section ‘Review of the experiments on DNA heating by Doty and Rice (Reference Doty and Rice1955, Reference Rice and Doty1957)’.
Peacocke and Preston (Reference Peacocke and Preston1958) also perform light scattering measurements on DNA degraded by combined exposure to gamma rays and heating at 100 °C for 15 minutes. They confirm the observation of a decrease in molecular weight but highlight that the observation of the effect of heating degradation in larger DNA molecules is less pronounced and emphasize that the interpretation of the entity of this decrease is affected by the observed tendency of the polynucleotide chains to remain entangled, despite the removal of hydrogen bonding, and by the tendency of separated chains to re-aggregate on cooling, which has been recalled above.
Sadron performed measurements of molecular weights by light scattering after heating alone (in absence of gamma-rays exposure) and reported his findings in several publications between 1955 and 1959 (Sadron, Reference Sadron1955, Reference Sadron1959; Freund et al., Reference Freund, Pouyet and Sadron1958). In the 1955 biochemistry congress proceedings (see addendum on page 134 therein) he reports the effect of heating at 100 °C for 15 minutes on two DNA preparations of initial molecular weight $ {M}_0=6.0\times {10}^6 $
. The weights he determines by light scattering on heated DNA at different NaCl concentrations show that DNA weight is always reduced as a confirmation that DNA is the more degraded the less is the NaCl content.
$ {M}_0=6.0\times {10}^6 $
. The weights he determines by light scattering on heated DNA at different NaCl concentrations show that DNA weight is always reduced as a confirmation that DNA is the more degraded the less is the NaCl content.
In particular, the table on the 1955 addendum on page 134 by Sadron (Reference Sadron1955) reports that just 15 minutes heating in the absence of salt brings the molecular weight from $ 6\times {10}^6 $
to
$ 6\times {10}^6 $
to $ 0.28\times {10}^6 $
and
$ 0.28\times {10}^6 $
and $ 0.35\times {10}^6 $
. In just one experiment with 1 M NaCl, he finds, in one of the two preparations, a weight increment to an average value
$ 0.35\times {10}^6 $
. In just one experiment with 1 M NaCl, he finds, in one of the two preparations, a weight increment to an average value $ M=7.0\times {10}^6 $
. Later, Freund et al. (Reference Freund, Pouyet and Sadron1958) reported tests of calf thymus DNA (CV71) in 1 M NaCl solutions where they obtain by light scattering for the unheated preparation the molecular weight
$ M=7.0\times {10}^6 $
. Later, Freund et al. (Reference Freund, Pouyet and Sadron1958) reported tests of calf thymus DNA (CV71) in 1 M NaCl solutions where they obtain by light scattering for the unheated preparation the molecular weight $ {M}_0=7.4\times {10}^6 $
. They measure by light scattering the molecular weight
$ {M}_0=7.4\times {10}^6 $
. They measure by light scattering the molecular weight $ M $
in a 0.01 M NaCl solution after thermal degradation produced by heating at temperatures of 75°, 80°, 85°, and 98 °C during a variable time
$ M $
in a 0.01 M NaCl solution after thermal degradation produced by heating at temperatures of 75°, 80°, 85°, and 98 °C during a variable time $ \theta $
. They find that by heating at temperatures of 80°, 85°, and 98 °C the ratio
$ \theta $
. They find that by heating at temperatures of 80°, 85°, and 98 °C the ratio $ R=M/{M}_0 $
as a function of
$ R=M/{M}_0 $
as a function of $ \theta $
first increases, reaches a maximum, and then drops to a residual value
$ \theta $
first increases, reaches a maximum, and then drops to a residual value $ R=0.047 $
corresponding to
$ R=0.047 $
corresponding to $ M={M}_2=350000 $
. The point data in the original figure have been digitized and those corresponding to temperatures of 85 °C and 98 °C are reported in Figure 4 herein. The only correction applied to the digitized number is that minutes have been rounded to the closest simple fractions of one hour (multiples of 5 minutes) and that ordinates reached at the horizontal asymptote have been rounded to the value 0.047 explicitly reported by Freund et al. (Reference Freund, Pouyet and Sadron1958).
$ M={M}_2=350000 $
. The point data in the original figure have been digitized and those corresponding to temperatures of 85 °C and 98 °C are reported in Figure 4 herein. The only correction applied to the digitized number is that minutes have been rounded to the closest simple fractions of one hour (multiples of 5 minutes) and that ordinates reached at the horizontal asymptote have been rounded to the value 0.047 explicitly reported by Freund et al. (Reference Freund, Pouyet and Sadron1958).

Figure 4. Ratio $ R=M/{M}_0 $
versus heating time
$ R=M/{M}_0 $
versus heating time $ \theta $
. Datapoints digitized from Figure 1 in Freund et al. (Reference Freund, Pouyet and Sadron1958). Only data for 98 °C and 85 °C are reported.
$ \theta $
. Datapoints digitized from Figure 1 in Freund et al. (Reference Freund, Pouyet and Sadron1958). Only data for 98 °C and 85 °C are reported.
The Authors find that the higher is the heating temperature the higher is the maximum, as shown in Figure 4. This figure shows that heating at 98 °C brings this maximum above 1.4 and then makes $ R $
suddenly drop at approximately 10 minutes to a value below 0.35. It is also seen that at 15 minutes the interpolation reaches 10% of the native weight. This measure brings further quantitative straightforward evidence of the sudden fragmentation that the DNA molecule undergoes when heated at temperatures above 90 °C.
$ R $
suddenly drop at approximately 10 minutes to a value below 0.35. It is also seen that at 15 minutes the interpolation reaches 10% of the native weight. This measure brings further quantitative straightforward evidence of the sudden fragmentation that the DNA molecule undergoes when heated at temperatures above 90 °C.
DNA heating experiments in the presence of different electrolytes
Hamaguchi and Geiduschek (Reference Hamaguchi and Geiduschek1962) perform a broad analysis of thermal stability of DNA in aqueous solution in the presence of many different electrolytes and under many different pH conditions and temperature ranges. They confirm that the thermal stability of DNA has a relatively broad maximum at pH 7–8 in 0.1 M NaCl and that in any concentration of any of the many electrolytes therein investigated the upper bounds of the temperature threshold of thermal stability can be never above 92.6 °C (see Table I and Figure 4 therein), irrespective of the electrolytes content and type.
Review of the experiments on DNA heating by Doty and Rice (Reference Doty and Rice1955, Reference Rice and Doty1957)
The arguments relevant to the effects of DNA heating, and their interpretation, contained in the 1955 short communication by Doty and Rice ‘The denaturation of desoxypentose nucleic acid’ deserve the utmost attention since, to the authors’ knowledge, this paper is chronologically the first record where it can be read of the 100 °C stable molecular weight claim for DNA. This is in neat disagreement with the big picture consistently emerging from the studies analyzed in the scientific background section about DNA undergoing thermal depolymerization when the threshold of 81 °C is surpassed, or even at lower temperatures in less stable conditions. In Doty and Rice (Reference Doty and Rice1955), it is reported indeed that, after heating a neutral saline solution to 100 °C for 15 minutes the product is found ‘to have the same molecular weight as the native DNA’.
This third section enucleates the experimental evidence reported in Doty and Rice (Reference Doty and Rice1955) relevant to the effect of DNA heating and contains an analysis of the interpretation given by Doty and Rice to such experimental evidence aimed at understanding if, and how, new settling measurements are reported by Doty and Rice in this 1955 study able to reverse the previous overall experimental–theoretical picture on the phenomenon of DNA fragmentation on heating above 80°.
A critical scientific review is also contextually carried out of results and interpretations by Doty and Rice following the contemporary scientific debate on the consequences of DNA heating. To this end, important contributions by K.V. Shooter, R.H. Pain, J.A.V. Butler, P. Alexander, K.A. Stacey, and C. Sadron are also examined in this chapter in more detail.
As Doty and Rice (Reference Doty and Rice1955) is a preliminary note, it is incomplete of exhaustive information on relevant materials and methods. The lacking information can be however sourced from the subsequent 1957 publication by Rice and Doty referred to as the continuation of such preliminary note. By joining the information contained in Doty and Rice (Reference Doty and Rice1955) and Rice and Doty (Reference Rice and Doty1957), it is known that the tested samples are of calf thymus DNA and that the results reported in Doty and Rice (Reference Doty and Rice1955) are obtained from the sample designated in Rice and Doty (Reference Rice and Doty1957) as SB-11 ‘prepared according to Simmons Method B’.
The Authors inform that the relevant ‘preparative procedure involves multiple extractions of minced thymus in saline-citrate (0.015 M sodium citrate and 0.15 M NaCl) by blending and centrifuging to obtain a sediment containing the nucleoprotein’. Notably, the Authors specify that ‘30% sodium p-xylene sulfonate is used to deproteinize the nucleoprotein’.
The three fundamental measurements employed by Doty and Rice for determining the molecular weight are the following:
-
– sedimentation measurements by ultracentrifuge;
-
– viscosity measurements by a capillary viscometer;
-
– light scattering measurements.
The evaluation of molecular weight from these combined sedimentation and viscosity measurements by Doty and Rice is examined first in the next section. Next, determinations of molecular weight from light scattering measurements by the same Authors are examined in subsection ‘DNA molecular weight from light scattering’.
Molecular weight from combined sedimentation/viscosity measurements and the scientific debate among Doty, Shooter, and coworkers
The data in Doty and Rice (Reference Doty and Rice1955) which Doty and Rice report in possible support the 100 °C stable molecular weight claim are collected in Table 2.
Table 2. Experimental sedimentation/viscosity measurements reported by Doty and Rice (Reference Doty and Rice1955) are employable to infer molecular weight in native and heated DNA

Data relevant to preparation coded ‘SB-11’ in Rice and Doty (Reference Rice and Doty1957).
Concerning quantities in Table 2 and their units, it is worth recalling what follows. Quantity [η] in Table 2 is the intrinsic viscosity: the specific increase in relative viscosity, $ \Delta \eta /{\eta}_0 $
, determined by adding a quantity of DNA associated with a concentration increment
$ \Delta \eta /{\eta}_0 $
, determined by adding a quantity of DNA associated with a concentration increment $ \Delta \rho $
to the solvent (of viscosity
$ \Delta \rho $
to the solvent (of viscosity $ {\eta}_0 $
), divided by
$ {\eta}_0 $
), divided by $ \Delta \rho $
. Accordingly,
$ \Delta \rho $
. Accordingly, $ \left[\eta \right]=\frac{\Delta \eta }{\eta_0\bullet \Delta \rho } $
and, as
$ \left[\eta \right]=\frac{\Delta \eta }{\eta_0\bullet \Delta \rho } $
and, as $ \Delta \rho $
is in grams per deciliter, [
$ \Delta \rho $
is in grams per deciliter, [ $ \hskip-0.5em \eta $
] is in reciprocal units of deciliters/gram. The solvent of Doty and Rice is a saline-citrate solvent (0.015 M sodium citrate and 0.15 M NaCl).
$ \hskip-0.5em \eta $
] is in reciprocal units of deciliters/gram. The solvent of Doty and Rice is a saline-citrate solvent (0.015 M sodium citrate and 0.15 M NaCl).
The sedimentation constant $ {s}_{20}^0 $
is a rate of sedimentation measured by the ultracentrifuge experiment methodology developed by Svedberg (Cecil and Ogston, Reference Cecil and Ogston1948a). Indicating by
$ {s}_{20}^0 $
is a rate of sedimentation measured by the ultracentrifuge experiment methodology developed by Svedberg (Cecil and Ogston, Reference Cecil and Ogston1948a). Indicating by $ r $
the radial coordinate in the axial symmetric setup of the ultracentrifuge, the centripetal acceleration
$ r $
the radial coordinate in the axial symmetric setup of the ultracentrifuge, the centripetal acceleration $ a $
is a radial field varying as
$ a $
is a radial field varying as $ a=r{\omega}^2 $
, where
$ a=r{\omega}^2 $
, where $ \omega $
is the angular velocity. The rate
$ \omega $
is the angular velocity. The rate $ \frac{dr}{dt} $
is measured by an optical system. Through so-called schlieren photography which essentially returns diagrams of changes in refractive index that typically have a «striped» pattern (‘schlieren’ = strip from German) and that inform about the change in concentration as a function of time and radial coordinate
$ \frac{dr}{dt} $
is measured by an optical system. Through so-called schlieren photography which essentially returns diagrams of changes in refractive index that typically have a «striped» pattern (‘schlieren’ = strip from German) and that inform about the change in concentration as a function of time and radial coordinate $ r $
. If the centrifugal field is strong enough to cause the molecules or particles to sediment with measurable velocity,
$ r $
. If the centrifugal field is strong enough to cause the molecules or particles to sediment with measurable velocity, $ v=\frac{dr}{dt} $
, the sedimentation constant is then
$ v=\frac{dr}{dt} $
, the sedimentation constant is then $ s=\frac{1}{r{\omega}^2}\frac{dr}{dt} $
.
$ s=\frac{1}{r{\omega}^2}\frac{dr}{dt} $
.
The principle of measurement in centrifuge is that the rate of sedimentation increases with the mass of the particle and with the intensity of acceleration. Tracing a parallel with a falling object of mass $ M $
immersed in atmosphere and a uniform gravitational field, it is known that due to the presence of air friction, the object deviates from the Galilean prediction of uniformly accelerated motion with gravitational acceleration
$ M $
immersed in atmosphere and a uniform gravitational field, it is known that due to the presence of air friction, the object deviates from the Galilean prediction of uniformly accelerated motion with gravitational acceleration $ g $
and reaches after a transitory time a steady velocity. The frictional force
$ g $
and reaches after a transitory time a steady velocity. The frictional force $ {F}_f $
, directed upwards, in a simplest description, is proportional to the velocity
$ {F}_f $
, directed upwards, in a simplest description, is proportional to the velocity $ v $
of the falling object so that
$ v $
of the falling object so that $ {F}_f=b\bullet v $
. As theoretically predicted by the force balance (gravitational force = frictional force;
$ {F}_f=b\bullet v $
. As theoretically predicted by the force balance (gravitational force = frictional force; $ {F}_a={F}_f $
;
$ {F}_a={F}_f $
; $ M\bullet a=b\bullet v $
) and empirically confirmed, the final velocity reached by the object increases with the object mass
$ M\bullet a=b\bullet v $
) and empirically confirmed, the final velocity reached by the object increases with the object mass $ M $
and with acceleration
$ M $
and with acceleration $ a $
which for the gravitational field is uniform in space and equal to the terrestrial gravitational acceleration constant
$ a $
which for the gravitational field is uniform in space and equal to the terrestrial gravitational acceleration constant $ g $
:
$ g $
: $ a=g $
. The mass is accordingly computed as
$ a=g $
. The mass is accordingly computed as $ M=\frac{b\bullet v}{a} $
or
$ M=\frac{b\bullet v}{a} $
or $ \hskip0.4em \propto \hskip0.4em \frac{v}{a} $
. As recalled, the main difference between the acceleration field of the centrifuge set-up and the gravitational field is that rotation implies a circular relative motion field with acceleration increasing with the radius by
$ \hskip0.4em \propto \hskip0.4em \frac{v}{a} $
. As recalled, the main difference between the acceleration field of the centrifuge set-up and the gravitational field is that rotation implies a circular relative motion field with acceleration increasing with the radius by $ a=r{\omega}^2 $
so that acceleration is no longer uniform as in the example of the falling object. The DNA molecules, heavier than the solvent, by inertia, will appear in the non-inertial rotor reference frame to be subject to a radial motion component directed toward the periphery of the centrifuge. This motion component may be causally interpreted as the consequence of not being sufficiently «pushed» in centripetal direction by the pressure gradient field that is generated in the solvent in response to the centripetal acceleration generated by the rotor. Through a special focus lenses measurements of the concentration along the radial direction are obtained from measurements of light absorption changes and/or refraction changes. Records are taken of the «strips» produced by the different optical properties of these moving «solute clouds». From these striped diagrams, it is possible to measure concentration changes along the radius and, in turn, evaluate the speed
$ a=r{\omega}^2 $
so that acceleration is no longer uniform as in the example of the falling object. The DNA molecules, heavier than the solvent, by inertia, will appear in the non-inertial rotor reference frame to be subject to a radial motion component directed toward the periphery of the centrifuge. This motion component may be causally interpreted as the consequence of not being sufficiently «pushed» in centripetal direction by the pressure gradient field that is generated in the solvent in response to the centripetal acceleration generated by the rotor. Through a special focus lenses measurements of the concentration along the radial direction are obtained from measurements of light absorption changes and/or refraction changes. Records are taken of the «strips» produced by the different optical properties of these moving «solute clouds». From these striped diagrams, it is possible to measure concentration changes along the radius and, in turn, evaluate the speed $ dr/ dt $
. The higher the
$ dr/ dt $
. The higher the $ \frac{dr}{dt} $
rate of sedimentation of this «dust», at the same acceleration
$ \frac{dr}{dt} $
rate of sedimentation of this «dust», at the same acceleration $ a=r{\omega}^2 $
(and therefore at the same angular velocity of rotation
$ a=r{\omega}^2 $
(and therefore at the same angular velocity of rotation $ \omega $
and radial distance
$ \omega $
and radial distance $ r $
in the blender), the greater is the mass
$ r $
in the blender), the greater is the mass $ M $
of the DNA molecule or molecule fragment by the proportion
$ M $
of the DNA molecule or molecule fragment by the proportion $ M\hskip0.4em \propto \hskip0.4em \frac{dr/ dt}{a} $
. The final raw quantitative measurement obtained from this experiment is the sedimentation constant
$ M\hskip0.4em \propto \hskip0.4em \frac{dr/ dt}{a} $
. The final raw quantitative measurement obtained from this experiment is the sedimentation constant $ s=\frac{1}{r{\omega}^2}\frac{dr}{dt} $
whereby the direct proportionality holds
$ s=\frac{1}{r{\omega}^2}\frac{dr}{dt} $
whereby the direct proportionality holds $ \hskip0.4em \propto \hskip0.4em s $
. Experiments are performed to extrapolate the limit
$ \hskip0.4em \propto \hskip0.4em s $
. Experiments are performed to extrapolate the limit $ {s}^0 $
of
$ {s}^0 $
of $ s $
at zero concentration (zero superscript), so that direct interaction between molecules can be excluded. If account is also taken of the temperature which can change the solvent viscosity and a reference temperature of 20 °C is employed, the symbol
$ s $
at zero concentration (zero superscript), so that direct interaction between molecules can be excluded. If account is also taken of the temperature which can change the solvent viscosity and a reference temperature of 20 °C is employed, the symbol $ {s}_{20}^0 $
is used to refer to such quantity. Ultracentrifuge sedimentation analysis of DNA containing a detailed report of observed sedimentation boundaries is presented by Cecil and Ogston (Reference Cecil and Ogston1948a, Reference Cecil and Ogston1948b). Also, to the authors’ knowledge, the first reported molecular weight measurements for DNA, based on the application of combined viscosity-sedimentation methods, were by Krejci et al. (Reference Krejci, Sweeny and Hambleton1949).
$ {s}_{20}^0 $
is used to refer to such quantity. Ultracentrifuge sedimentation analysis of DNA containing a detailed report of observed sedimentation boundaries is presented by Cecil and Ogston (Reference Cecil and Ogston1948a, Reference Cecil and Ogston1948b). Also, to the authors’ knowledge, the first reported molecular weight measurements for DNA, based on the application of combined viscosity-sedimentation methods, were by Krejci et al. (Reference Krejci, Sweeny and Hambleton1949).
Concerning the ultracentrifuge sedimentation experiments, Rice and Doty (Reference Rice and Doty1957) report two important information:
-
• When DNA solutions are exposed to 100 °C for 15 minutes the hypersharp sedimentation profile is lost and ‘two differently sedimenting species in solutions’ appear.
-
• Such a polydisperse character of the heated solution, in the same words as Rice and Doty, ‘posed a difficult problem’ and induced the Authors to erroneously attribute a sedimentation constant of 30 $ S. $
In fact, they also report: ‘Dr. K. V. Shooter and Professor J. A. V. Butler have examined our sample SB-11 by ultraviolet optics in the ultracentrifuge and found that the distribution of sedimentation coefficients broadened but remained single-peaked at 21
$ \mathrm{S} $
when heated at 100 °C for 15 min. at a concentration of 10 mg./dl’ (see Shooter et al., Reference Shooter, Pain and Butler1956).
$ S. $
In fact, they also report: ‘Dr. K. V. Shooter and Professor J. A. V. Butler have examined our sample SB-11 by ultraviolet optics in the ultracentrifuge and found that the distribution of sedimentation coefficients broadened but remained single-peaked at 21
$ \mathrm{S} $
when heated at 100 °C for 15 min. at a concentration of 10 mg./dl’ (see Shooter et al., Reference Shooter, Pain and Butler1956).


The scientific debate between Doty and Rice and Shooter et al. deserves attention. Measurements by Shooter et al. (Reference Shooter, Pain and Butler1956) are conveniently reported in Table 3 since the Authors re-execute both sedimentation and viscosity measurements for sample SB-11 (in the acknowledgment the donation by Prof. Paul Doty is mentioned) investigating the effect of 15 mins heating at 100 °C and achieve increased accuracy for sedimentation measurements. Increased accuracy is achieved since the Authors employ a preferable lower 0.01% concentration instead of 0.035% of the samples examined in Rice and Doty (Reference Rice and Doty1957) and operate optical measurements in the ultra-violet range where they had shown that heterogeneity with respect to sedimentation coefficient is more easily observed. By comparing Tables 2 and 3 it is seen that reduced intrinsic viscosity values are the same in Shooter and Butler (Reference Shooter and Butler1955) and Rice and Doty (Reference Rice and Doty1957), while a value of 20.0 $ S $
is more accurately measured for the sedimentation constant after heating, thus identifying and correcting the experimental error recognized by Doty and Rice and recalled above.
$ S $
is more accurately measured for the sedimentation constant after heating, thus identifying and correcting the experimental error recognized by Doty and Rice and recalled above.
Table 3. Sedimentation/viscosity measurements by Shooter et al. (Reference Shooter, Pain and Butler1956) in native and heated samples of 0.01% DNA preparation SB-11
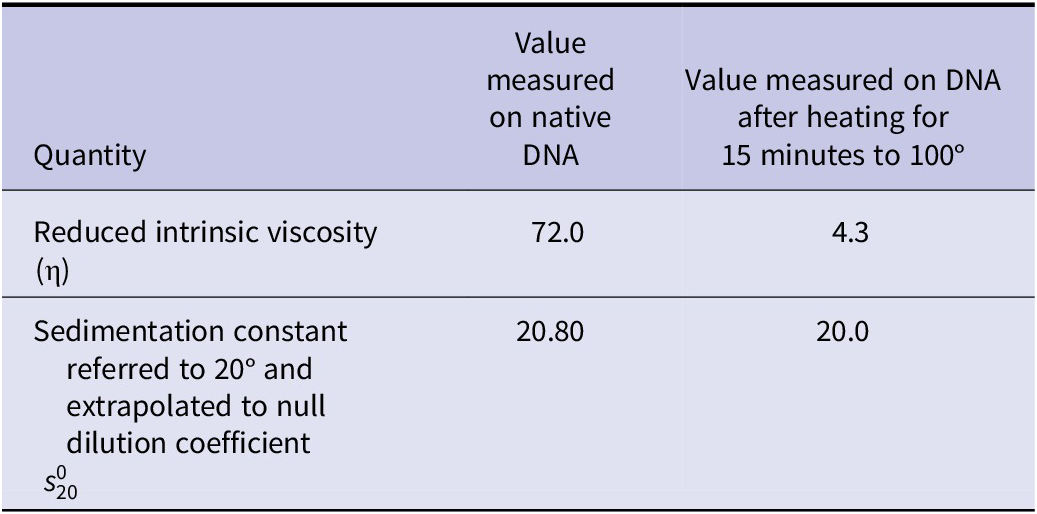
Units are the same as Table 2.
Shooter et al. (Reference Shooter, Pain and Butler1956) finalize their study on the effect of DNA heating and their countercheck of Doty and Rice measurements by concluding that ‘The results given suggest that in all cases the samples of DNA are degraded on heating but that the extent of the degradation and the distribution of size and shape of the fragments produced depends upon the way in which the DNA has been prepared’. It is important to remark that this conclusion is achieved in Shooter et al. (Reference Shooter, Pain and Butler1956) upon testing sedimentation constants and viscosities of four DNA preparations (TNA 7, TNA 15, TNA 23, and SB-11) under multiple concentrations, in the presence and absence of the protective effect of NaCl. The Authors emphasize that sedimentation constant decreases in all samples except for samples TNA16 and SB-11 for which it remains unchanged. They remark that despite the unchanged sedimentation constant the apparent molecular weight is reduced in all cases. They have the merit of highlighting the possible fallacies in deducing the molecular weight from combined sedimentation and viscosity measurements. Fallacies may arise from the reaggregation of the fragments when heating is performed at higher concentrations. Indeed, in one case, they found that heating the TNA23 solution at 0.05% concentration at 100 °C for 15 minutes makes the sedimentation constant increase from 27 to 36 Svedberg units. This measurement shows that particles appear to have possibly even increased their mass, an effect that may be explained only by reaggregation. They also observe for all DNA preparations that the ‘spread of sedimentation coefficients is changed, there being an increase of material with both high and low sedimentation coefficients’. Such result is readily interpreted as evidence of the production, by 15 minutes heating, of both fragments of lower molecular weight and aggregations of fragments of higher molecular weight.
Shooter et al. highlight that preparations TNA 23 and SB-11 are obtained, in particular, by detergent methods (it is worth recalling that SB-11, donated by Doty, has been prepared employing sodium p-xylene sulfonate) pointing to the risk that higher sedimentation constants may be preparation artifacts due to the use of detergent methods while lower sedimentation constants might be artifacts due to purification procedures employing enzyme methods which have a depolymerizing effect.
Next, in their 1957 publication containing the reply to Shooter et al. countercheck, Rice and Doty do not make considerations on the evidence that fragments reaggregation readily explains the increase in sedimentation constant from 21 to 30 $ S $
of Table 2 that they had published in their 1955 preliminary note. On the other hand, Shooter et al. had shown that heating at 0.05% concentration, a value close to the 0.035% concentration employed by Rice and Doty, makes the sedimentation constant of TNA 23 increase from 27 to 36
$ S $
of Table 2 that they had published in their 1955 preliminary note. On the other hand, Shooter et al. had shown that heating at 0.05% concentration, a value close to the 0.035% concentration employed by Rice and Doty, makes the sedimentation constant of TNA 23 increase from 27 to 36 $ S $
.
$ S $
.
Doty and Rice reference the empirically well-established relation of Krigbaum, Flory, Mandelkern, and Sheraga which is the following:
 $$ \frac{s^0{\left[\eta \right]}^{\frac{1}{3}}}{M^{\frac{2}{3}}}=\frac{K\left(1-\overline{v}\rho \right)}{\eta_0N}. $$
In Eq. (14), $ K $
is a universal constant which has the same value irrespective of molecular weight, temperature, and solvent and depends only on the flexibility of the molecular chain. Its value ranges between
$ K $
is a universal constant which has the same value irrespective of molecular weight, temperature, and solvent and depends only on the flexibility of the molecular chain. Its value ranges between $ {K}_{\mathrm{flex}}=2.5\bullet {10}^6 $
for a flexible coiled molecule and
$ {K}_{\mathrm{flex}}=2.5\bullet {10}^6 $
for a flexible coiled molecule and $ {K}_{\mathrm{stiff}}=3.6\bullet {10}^6 $
for ellipsoids of increasing axial ratio,
$ {K}_{\mathrm{stiff}}=3.6\bullet {10}^6 $
for ellipsoids of increasing axial ratio, $ {\eta}_0 $
is the solvent viscosity,
$ {\eta}_0 $
is the solvent viscosity, $ N $
is Avogadro’s number,
$ N $
is Avogadro’s number, $ \rho $
is the density of the solution, and
$ \rho $
is the density of the solution, and $ \overline{v} $
is the partial specific volume. All quantities on the right-hand side of Eq. (14) are constants, or can be treated as such, in the experiments under examination.
$ \overline{v} $
is the partial specific volume. All quantities on the right-hand side of Eq. (14) are constants, or can be treated as such, in the experiments under examination.
Equation (14) permits a more accurate determination of molecular mass. It can be applied to examine Doty and Rice data of Table 2 and to investigate the scientific substantiation of their key argument: that is, to investigate whether changes induced by 15 mins heating at 100 °C can be explained exclusively by calling into question a possible coiling or change in the molecule flexibility, excluding any molecular weight change, or if compelling evidence exists of molecular fragmentation from data of Tables 2 and 3.
Subscripts N and H are used below in a way similar to Eq. (2) of subsection ‘Estimates of molecular weight from viscosity-sedimentation experiments’ above to indicate values relevant to native and heated DNA. Assuming, first, that $ K $
is not influenced by heating, so that it takes the same value
$ K $
is not influenced by heating, so that it takes the same value $ K $
for the heated and unheated material, one infers from Eq. (14):
$ K $
for the heated and unheated material, one infers from Eq. (14):
 $$ \frac{M_N}{M_H}=\sqrt{{\left(\frac{s_N^0}{s_H^0}\right)}^3\times \frac{\eta_N}{\eta_H}}. $$
Hence, from Doty and Rice (Reference Doty and Rice1955) data we compute under this assumption of unchanged flexibility:
 $$ \frac{M_N}{M_H}=\sqrt{{\left(\frac{21}{30}\right)}^3\times \frac{72}{4,3}}=2.39, $$
which states that, after heating, the molecules are more than two times smaller, on average. It is understood, however, that Shooter et al. have elucidated that the sedimentation $ 30\;S $
appears to be an erroneous measurement artifact.
$ 30\;S $
appears to be an erroneous measurement artifact.
Moreover, by taking into account the correction of the erroneous measurement evidenced by Shooter et al., one further computes:
 $$ \frac{M_N}{M_H}=\sqrt{{\left(\frac{20}{20}\right)}^3\times \frac{72}{4,3}}=4.09, $$
so that, after heating, the molecules are, on average, about 4 times smaller.
If one wishes to defend further the claim of Doty and Rice, appealing to the residual argument that the increase in sedimentation constant might only be due to coiling of the molecule (putting apart the already reasonably clear evidence of fragments reaggregation) one can employ $ {K}_{\mathrm{stiff}}=3.6\bullet {10}^6 $
for the native material and
$ {K}_{\mathrm{stiff}}=3.6\bullet {10}^6 $
for the native material and $ {K}_{\mathrm{flex}}=2.5\bullet {10}^6 $
for the heated material. One can thus write:
$ {K}_{\mathrm{flex}}=2.5\bullet {10}^6 $
for the heated material. One can thus write:
 $$ \frac{s_N^0{\left[{\eta}_N\right]}^{1/3}}{M_N^{2/3}}=\frac{K_{\mathrm{stiff}}\left(1-\overline{v}\rho \right)}{\eta_0N}, $$
 $$ \frac{s_H^0{\left[{\eta}_H\right]}^{1/3}}{M_H^{2/3}}=\frac{K_{\mathrm{flex}}\left(1-\overline{v}\rho \right)}{\eta_0N}, $$
so that from (18) and (19) one infers:
 $$ \frac{M_N}{M_H}=\sqrt{{\left(\frac{s_N^0}{s_H^0}\frac{K_{\mathrm{flex}}}{K_{\mathrm{stiff}}}\right)}^3\times \frac{\eta_N}{\eta_H}}. $$
Hence employing the available experimental data one would compute:
 $$ \frac{M_N}{M_H}=\sqrt{{\left(\frac{20}{20}\times \frac{2.5}{3.6}\right)}^3\times \frac{72}{4,3}}=2.368. $$
It is thus seen that, even appealing to such a coiling hypothesis, fragmentation remains a compelling evidence matching with the ‘two sedimenting species’ recorded by Rice and Doty.
DNA molecular weight from light scattering
The previous subsection ‘Molecular weight from combined sedimentation/viscosity measurements and the scientific debate among Doty, Shooter and coworkers’ has shown the absence of any evidence from combined sedimentation and viscosity measurements supporting the possibility that native DNA molecules can avoid fragmentation and remain thermally stable above 85 °C with the specific buffer solutions subject to testing. The same subsection has also shown the existence of consistent and redundant evidence of such fragmentation above 85 °C. The present section shows that one arrives at the same conclusion even when results coming from light scattering measurements are carefully examined.
Light scattering deserves attention for several reasons:
-
• it is the third and last measurement technique reported in Rice and Doty (Reference Rice and Doty1957) on the basis of which it is claimed therein that no fragmentation occurs above 85 °C in the DNA molecules (if not, admittedly, only after a heating period of 15 minutes and more) since it is claimed, from light scattering results therein reported, that no significant change in molecular weight occurs on thermal denaturation;
-
• among the methods available for the determination of the size and shape of macromolecules, light-scattering in 1954 was considered the method giving more nearly correct values for the molecular weight and the radius of gyration by several researchers (Reichmann et al., Reference Reichmann, Rice, Thomas and Doty1954; Rowen and Norman, Reference Rowen and Norman1954; Alexander and Stacey, Reference Alexander and Stacey1955) actively working on DNA molecular characterization and by Sadron (Reference Sadron1955, Reference Sadron1959);
-
• it is the tool which brought the remarkable result that DNA purified from different biological sources such as calf thymus, herring sperm, bacteria, and bacteriophage (Reichmann et al., Reference Reichmann, Rice, Thomas and Doty1954; Rowen and Norman, Reference Rowen and Norman1954; Alexander and Stacey, Reference Alexander and Stacey1955) has always the same molecular weight of about
$ 6\times {10}^6 $
when the extraction and purification methods are the same.

It is thus understood that if light scattering is properly employed for determining the molecular weights of native DNA and of molecules after potentially fragmenting treatments, such as heating, acid treatment, or depolymerizing enzymes, it can be a mean for quantitative verification of different hypotheses on possible depolymerization or coiling of the molecule.
Clearly, we anticipate that, as we have already remarked in the previous sections of this survey, in examining the effect of these treatments, it is fundamental to properly discern four possible situations:
-
s1) the possibility that the molecules remain with unchanged weight and unchanged size;
-
s2) the case of a reduction in size of the molecule due to a real fragmentation into parts of lower molecular weight;
-
s3) the case of a merely ostensible reduction in size which is due instead to just a coiling of the molecule with unchanged molecular weight;
-
s4) the case specular to case s2) and elucidated by Shooter et al. (Reference Shooter, Pain and Butler1956) in which, a depolymerizing action (such as heating or acid treatment), yields, in the presence of a not sufficiently low concentration of DNA, a reaggregation of fragments producing aggregates showing an ostensible measurable effect which may be misinterpreted as the indication of the production of a material having a higher molecular weight (this is the case, we recall, of the increase of the sedimentation coefficient for preparation TNA 23 at 0.005% concentration rising from 27 Svedberg units (before heating) to 36 Svedberg units (Shooter et al., Reference Shooter, Pain and Butler1956).
Brief notes on the fundamentals of light scattering
Before examining Rice and Doty’s light scattering results, a brief introduction is reported of the measurement principle and measurement technique of the light scattering method and of the related turbidimetry method.
Fundamental advancements to optical methods of turbidity and light-scattering have been contributed by Debye (Reference Debye1944, Reference Debye1946, Reference Debye1947) and by Zimm (Reference Zimm1948a, Reference Zimm1948b). In brief, the essential physical principle of these optical techniques applied to molecules in solution, as first described by Debye (Reference Debye1944), is based on the following relation expressing the turbidity $ \tau $
of diluted solutions as a function of the refractive index of the solvent,
$ \tau $
of diluted solutions as a function of the refractive index of the solvent, $ {\mu}_0 $
, of the refractive index
$ {\mu}_0 $
, of the refractive index $ \mu $
of the solution, of the wave-length
$ \mu $
of the solution, of the wave-length $ \lambda $
, and of the number
$ \lambda $
, and of the number $ n $
of molecules per
$ n $
of molecules per $ {\mathrm{cm}}^3 $
:
$ {\mathrm{cm}}^3 $
:
 $$ \tau =\frac{32{\pi}^3}{3}\frac{{\mu_0}^2{\left(\mu -{\mu}_0\right)}^2}{\lambda^4}\frac{1}{n}. $$
If $ {\mu}_0 $
for the solvent is known,
$ {\mu}_0 $
for the solvent is known, $ n $
can thus be measured, in the first instance, on the basis of two experiments, a first one giving
$ n $
can thus be measured, in the first instance, on the basis of two experiments, a first one giving $ \mu $
and a second one giving
$ \mu $
and a second one giving $ \tau $
. Once
$ \tau $
. Once $ n $
is determined, the mass of the particle
$ n $
is determined, the mass of the particle $ u $
and its molecular weight
$ u $
and its molecular weight $ M $
follow from the concentration
$ M $
follow from the concentration $ c $
as
$ c $
as $ u=c/n $
and
$ u=c/n $
and $ M= cN/n $
, being as usual
$ M= cN/n $
, being as usual $ N $
Avogadro’s number. For practical purposes, the quantity
$ N $
Avogadro’s number. For practical purposes, the quantity $ K=\tau /(Mc) $
is introduced by Debye. This quantity, on account of Eq. (22) and of relation
$ K=\tau /(Mc) $
is introduced by Debye. This quantity, on account of Eq. (22) and of relation $ nM= cN $
, achieves the expression:
$ nM= cN $
, achieves the expression:
 $$ K=\frac{32{\pi}^3}{3}\frac{{\mu_0}^2}{N{\lambda}^4}\frac{{(\mu -{\mu}_0)}^2}{c^2}. $$ $ K $
is thus for turbidity, in a first approximation, a refraction constant which, once determined, permits to compute
$ K $
is thus for turbidity, in a first approximation, a refraction constant which, once determined, permits to compute $ M $
as
$ M $
as $ M=\tau / Kc $
or, equivalently:
$ M=\tau / Kc $
or, equivalently:
 $$ \frac{K\bullet c}{\tau }=\frac{1}{M}. $$
However, Debye discusses in 1947 that, for solutions of high-polymer substances, such as the case of DNA, even at high dilutions $ K $
cannot be treated as a constant with respect to concentration
$ K $
cannot be treated as a constant with respect to concentration $ c $
but is found to be a function
$ c $
but is found to be a function $ K(c) $
of the concentration
$ K(c) $
of the concentration $ c $
, and the same occurs for turbidity
$ c $
, and the same occurs for turbidity $ \tau $
which is similarly a function
$ \tau $
which is similarly a function $ \tau (c) $
of concentration. He advises to employ the linear interpolation:
$ \tau (c) $
of concentration. He advises to employ the linear interpolation:
 $$ \frac{K(c)\bullet c}{\tau (c)}=\frac{1}{M}+2B\bullet c, $$
in which $ B $
is a constant depending on the solvent so that in the limit of zero concentration,
$ B $
is a constant depending on the solvent so that in the limit of zero concentration, $ c\to 0 $
, Eq. (24) is recovered and
$ c\to 0 $
, Eq. (24) is recovered and $ M $
is computed. This corresponds to the following two-dimensional plot extrapolation:
$ M $
is computed. This corresponds to the following two-dimensional plot extrapolation:
-
• the refraction term
$ K $
and the dilution
$ \tau $
are determined for different concentrations
$ {c}_1,{c}_2,{c}_3,\dots $
obtaining several determinations
$ K\left({c}_1\right),K\left({c}_2\right),K\left({c}_3\right),\dots $
and
$ \tau \left({c}_1\right),\tau \left({c}_2\right),\tau \left({c}_3\right),\dots $
; -
• from these determinations the left-hand side of Eq. (25) as a function of the independent variable
$ c $
,
$ L(c)=K(c)\bullet c/\tau (c), $
is interpolated (in Debye, Reference Debye1946, in particular, the method of least squares is employed); -
• function
$ L(c) $
is extrapolated to zero concentration obtaining the limit
$ \underset{c\to 0}{\lim }L(c)=\underset{c\to 0}{\lim}\frac{K(c)\bullet c}{\tau (c)} $
; this limit is equal to the limit of the right-hand side
$ \underset{c\to 0}{\lim}\left(\frac{1}{M}+2B\bullet c\right)=1/M $
; -
• eventually, this method graphically provides the molecular weight
$ M $
as the intercept at
$ c=0 $
of curve
$ L(c) $
.


The method described so far for determining $ M $
only involves measurement of the turbidity
$ M $
only involves measurement of the turbidity $ \tau $
and not of light scattered at different angles. For larger thread-like polymerized molecules, such as DNA, a more refined measurement technique which is based on the additional information obtainable from measurement of the angular distribution of the scattered light is further devised by Debye (Reference Debye1947). Debye derives a fundamental analytical relation for the intensity
$ \tau $
and not of light scattered at different angles. For larger thread-like polymerized molecules, such as DNA, a more refined measurement technique which is based on the additional information obtainable from measurement of the angular distribution of the scattered light is further devised by Debye (Reference Debye1947). Debye derives a fundamental analytical relation for the intensity $ I $
of scattered light as a function of the angle
$ I $
of scattered light as a function of the angle $ \theta $
between the primary beam and the scattered beam. The function
$ \theta $
between the primary beam and the scattered beam. The function $ I\left(\theta, c\right) $
, accounting for such dependency upon
$ I\left(\theta, c\right) $
, accounting for such dependency upon $ \theta $
and upon the concentration
$ \theta $
and upon the concentration $ c $
of solute in each experiment, is theoretically elaborated by Debye through an averaging procedure accounting for all conceivable particle configurations (since the particles are statistically free to rotate and fluctuate in the optical model). The expression of
$ c $
of solute in each experiment, is theoretically elaborated by Debye through an averaging procedure accounting for all conceivable particle configurations (since the particles are statistically free to rotate and fluctuate in the optical model). The expression of $ I\left(\theta, c\right) $
resulting from this theoretical elaboration depends on the employed model for the particle. Debye presents specific analytical expressions for particles modeled as having spherical or ellipsoidal shape and, additionally, considers a third model (a so-called random coil model, essentially devised for schematizing the optical behavior of polymers) in which thread polymers are schematized as a flexible number of links, each one able to rotate freely. Debye finds that, for this set of molecular models (random coils, spherical shapes, or ellipsoidal shapes), the relevant function
$ I\left(\theta, c\right) $
resulting from this theoretical elaboration depends on the employed model for the particle. Debye presents specific analytical expressions for particles modeled as having spherical or ellipsoidal shape and, additionally, considers a third model (a so-called random coil model, essentially devised for schematizing the optical behavior of polymers) in which thread polymers are schematized as a flexible number of links, each one able to rotate freely. Debye finds that, for this set of molecular models (random coils, spherical shapes, or ellipsoidal shapes), the relevant function $ I\left(\theta, c\right) $
turns out to be conveniently expressed in a relatively simpler analytical closed form of the following type:
$ I\left(\theta, c\right) $
turns out to be conveniently expressed in a relatively simpler analytical closed form of the following type: $ I\left({\sin}^2\left(\theta /2\right),c\right) $
, that is, by an analytical expression in which
$ I\left({\sin}^2\left(\theta /2\right),c\right) $
, that is, by an analytical expression in which $ {\sin}^2\left(\theta /2\right) $
is the first independent variable. A convenient alternate series expansion expression of function
$ {\sin}^2\left(\theta /2\right) $
is the first independent variable. A convenient alternate series expansion expression of function $ I\left(\theta, c\right) $
, applicable to a variety of molecular shapes and typologies and under some respects analogous to Eq. (12), is contextually elaborated by Debye one year later. A more explicit expansion of this form is also presented by Zimm (Reference Zimm1948a, see Equation (26) therein). Zimm’s series expansion yields a determination of the molecular weight
$ I\left(\theta, c\right) $
, applicable to a variety of molecular shapes and typologies and under some respects analogous to Eq. (12), is contextually elaborated by Debye one year later. A more explicit expansion of this form is also presented by Zimm (Reference Zimm1948a, see Equation (26) therein). Zimm’s series expansion yields a determination of the molecular weight $ M $
from light scattering measurements at different angles and is similarly applicable to different particle models. The first three terms of this expansion are:
$ M $
from light scattering measurements at different angles and is similarly applicable to different particle models. The first three terms of this expansion are:
 $$ \frac{K\bullet c}{I\left(\theta, c\right)}=\frac{1}{M}\bullet \frac{1}{P\left(\theta \right)}+2{A}_2\bullet c+f\left(\theta \right)\bullet {c}^2+\dots . $$
In the previous relation, $ I\left(\theta, c\right) $
is the intensity of the excess scattering (over that of the solvent alone) at a given concentration,
$ I\left(\theta, c\right) $
is the intensity of the excess scattering (over that of the solvent alone) at a given concentration, $ P\left(\theta \right) $
is a probability function such that
$ P\left(\theta \right) $
is a probability function such that $ P(0)=1 $
,
$ P(0)=1 $
, $ {A}_2 $
is a constant independent from
$ {A}_2 $
is a constant independent from $ \theta $
and
$ \theta $
and $ c $
, and
$ c $
, and $ f\left(\theta \right) $
is a term independent from
$ f\left(\theta \right) $
is a term independent from $ c. $
Owing to these properties, it is seen that extrapolation of the left-hand term in Eq. (19) at zero concentration and zero angle
$ c. $
Owing to these properties, it is seen that extrapolation of the left-hand term in Eq. (19) at zero concentration and zero angle $ \theta $
gives again the reciprocal of the molecular weight:
$ \theta $
gives again the reciprocal of the molecular weight:
 $$ {\left(\frac{K\bullet c}{I\left(\theta, c\right)}\right)}_{\begin{array}{c}c\to 0\\ {}\theta \to 0\end{array}}=\frac{1}{M}. $$
Debye also shows (1947) that the slope of the plots (as a function of $ c $
) in proximity of
$ c $
) in proximity of $ c=0 $
defined by coefficient
$ c=0 $
defined by coefficient $ 2{A}_2 $
in Eq. (26) defines the square of the average size of the particle in terms of distance from its center of gravity (also termed radius of gyration by some authors (Doty and Bunce, Reference Doty and Bunce1952; Alexander and Stacey, Reference Alexander and Stacey1955)). For clarity in the employed terminology, it is recalled that the function
$ 2{A}_2 $
in Eq. (26) defines the square of the average size of the particle in terms of distance from its center of gravity (also termed radius of gyration by some authors (Doty and Bunce, Reference Doty and Bunce1952; Alexander and Stacey, Reference Alexander and Stacey1955)). For clarity in the employed terminology, it is recalled that the function $ \frac{K\bullet c}{I\left(\theta, c\right)} $
is also called by Alexander and Stacey (Reference Alexander and Stacey1955) and by Doty and Bunce (Reference Doty and Bunce1952) ‘reciprocal reduced intensity’ and the Zimm plots are also denominated reciprocal reduced intensity plots.
$ \frac{K\bullet c}{I\left(\theta, c\right)} $
is also called by Alexander and Stacey (Reference Alexander and Stacey1955) and by Doty and Bunce (Reference Doty and Bunce1952) ‘reciprocal reduced intensity’ and the Zimm plots are also denominated reciprocal reduced intensity plots.
The accuracy of the extrapolation procedure stated by Eq. (27) is understood to be critical for the accuracy of the determination of the molecular weight. The extrapolation is operatively carried out by graphical construction of a grid-like plot (denominated Zimm plot) in the plane having the quantity $ {\sin}^2\left(\theta /2\right) $
on the horizontal axis and the quantity
$ {\sin}^2\left(\theta /2\right) $
on the horizontal axis and the quantity $ K\bullet c/I\left(\theta, c\right) $
on the vertical axis.
$ K\bullet c/I\left(\theta, c\right) $
on the vertical axis.
For the problem of interest, which is the determination of the weight of the DNA molecule by light scattering, the construction of a Zimm plot has been well exemplified and explained by Alexander and Stacey (Reference Alexander and Stacey1955) who, aside to Doty and coworkers, have been among the first researchers performing such a measure. Figure 5 is a reproduction of the plot performed by Alexander and Stacey for determining the molecular weight of herring sperm DNA at PH 6.8. On the horizontal axis of the graph in Figure 5 it can be read $ {\sin}^2\left(\theta /2\right)+2000\bullet c $
since the addition of the term
$ {\sin}^2\left(\theta /2\right)+2000\bullet c $
since the addition of the term $ 2000\bullet c $
is simply a mean for graphically shifting in the horizontal direction the curves, function of
$ 2000\bullet c $
is simply a mean for graphically shifting in the horizontal direction the curves, function of $ {\sin}^2\left(\theta /2\right) $
, obtained at each constant value for
$ {\sin}^2\left(\theta /2\right) $
, obtained at each constant value for $ c $
. The intercept at
$ c $
. The intercept at $ c=0 $
is seen to be
$ c=0 $
is seen to be $ \frac{1}{M}=1.7\bullet {10}^{-7} $
and from this value the result
$ \frac{1}{M}=1.7\bullet {10}^{-7} $
and from this value the result $ M=5.9\bullet {10}^6 $
is computed by these Authors. Observe that the slope of the horizontal segments of the plot represents the sensitivity of this method to the solute concentration and that the property of these segments of being almost horizontal in the vicinity of the intercept with the vertical axis ensures the independence of evaluation of the molecular weight from the concentration employed in the experiments.
$ M=5.9\bullet {10}^6 $
is computed by these Authors. Observe that the slope of the horizontal segments of the plot represents the sensitivity of this method to the solute concentration and that the property of these segments of being almost horizontal in the vicinity of the intercept with the vertical axis ensures the independence of evaluation of the molecular weight from the concentration employed in the experiments.

Figure 5. Figure 1 in Alexander and Stacey (Reference Alexander and Stacey1955). Zimm plot for determining the molecular weight of herring sperm DNA at PH 6.8. Used with permission of Portland Press, Ltd. from Alexander and Stacey (Reference Alexander and Stacey1955), Copyright (1984), permission conveyed through Copyright Clearance Center, Inc.
We briefly recall now the light scattering results that Doty and coworkers published in the years 1953–1957. With these data, Doty supports two claims:
-
• the claim of unchanged DNA molecular weight upon acidification to pH 2.6 (Reichmann et al., Reference Reichmann, Bunce and Doty1953);
-
• the claim of unchanged DNA molecular weight after 15 minutes heating at 100 °C (Rice and Doty, Reference Rice and Doty1957).
A fundamental digression on the detection of DNA acidic degradation by light scattering with a confutation
Although the central object of discussion of this subsection is on possible evidences from the light scattering measurements by Doty and Rice of the molecular weight stability of DNA to heating, a brief digression on the close examination of the light scattering data relevant to the assessment of stability upon pH 2.6 acidification of DNA, presented by Reichmann et al. (Reference Reichmann, Bunce and Doty1953), is carried out hereafter to duly highlight possible sources of fallacious, or diverging, interpretation of data from light scattering. Such a digression is revealed to be important by the existence of an ongoing debate in the thread of publications (Alexander and Stacey, Reference Alexander and Stacey1955; Chargaff, Reference Chargaff, Chargaff and Davidson1955; Rice and Doty, Reference Rice and Doty1957), concerning the question of whether the molecular weight of DNA changes or not after acidification at pH 2.6 in aqueous solution with 0.2 M NaCl. Such debate is very instructive for discerning in heating degradation the situations s1), s2), s3), and s4) enumerated at the beginning of the present subsection ‘DNA molecular weight from light scattering’.
The apparatus employed by Reichmann et al. (Reference Reichmann, Bunce and Doty1953) for light-scattering experiments is not described in detail, as the reader is referred to (Doty and Bunce, Reference Doty and Bunce1952) where it is specified that measurements were made by a Brice-Speiser photometer.
Reichmann et al. (Reference Reichmann, Bunce and Doty1953) perform two sets of light scattering experiments for determining the molecular weight of calf thymus DNA in 0.2 M NaCl, at pH 6.5 and at pH 2.6 obtaining the two Zimm plots in Figure 6, reproducing Figure 1 by Reichmann et al. These Authors interpret these plots as the evidence of unchanged molecular weight, ostensibly given by the common intercept attained by these grids in the limit of zero angle and zero concentration.

Figure 6. Zimm plots presented by Reichmann et al. (Reference Reichmann, Bunce and Doty1953) for determining the molecular weight of calf thymus DNA in 0.2 M NaCl at pH 6.5 and 2.6. As reported, tested concentrations vary from 0.005 to 0.05 mg./cc. Used with permission of Interscience Publishers, Inc. from Reichmann et al. (Reference Reichmann, Bunce and Doty1953), Copyright (1946), permission conveyed through Copyright Clearance Center, Inc.
Reichmann et al. pair this possible evidence of stable molecular weight with the interpretation that the fall in viscosity would be the result of a contraction of the coiled molecule as the solution is acidified. They do not consider any possibility of the effect of disaggregation and reaggregation evidenced by Shooter et al. (Reference Shooter, Pain and Butler1956). However, this conclusion of stable molecular weight under pH 2.6 has been challenged by contrary evidence shown by Alexander and Stacey who employed the same method of light scattering to analyze the behavior of this molecule in a broader set of similar experiments. The light-scattering analyses of DNA by these Authors are characterized by a specific view toward possible evidence of depolymerization and toward the delicate discernment of antagonist effects due to fragmentation and fragments reaggregation highlighted in the previous subsection ‘Molecular weight from combined sedimentation/viscosity measurements and the scientific debate among Doty, Shooter and coworkers’. In this study, the Authors examine DNA depolymerization due to acid treatment under conditions similar to those of Reichmann et al. (Reference Reichmann, Bunce and Doty1953) while encompassing a countercheck of particle weight and particle size at different pH values and even in the presence of renetraulization. Their results relevant to the analysis of possible depolymerization due to acidification down below pH 2.6 are recalled hereafter.
The apparatus for the light scattering experiments by Alexander and Stacey is described in Alexander and Stacey (Reference Alexander and Stacey1955) and is similar in design to the one used by Carr and Zimm (Reference Carr and Zimm1950). Also, the experimental conditions examined by these Authors and by Reichmann et al. are readily comparable (solutions of 0.10 to 0.2 M NaCl).
In examining and confronting the experimental results, it is convenient to introductively recall that evidence of acid depolymerization below pH 5 in terms of viscosity reduction and decreased sedimentation has been already highlighted by Cecil and Ogston (Reference Cecil and Ogston1948b) who had reported that at pH 3.5 ‘Treatment with acid leads to the formation of two fractions, one of which is relatively homogeneous and resembles the original material except that it is altered by reprecipitation. The formation of the heterogeneous component is probably the result of disaggregation. The changes brought about at pH 3.5 proceed to a limit, and no further important change follows subsequent neutralization. Reprecipitation of the neutralized solution causes a further large change, the homogeneous component disappearing and a gel-forming material appearing in its place: this change is likely to be due to a re-aggregation’. Evidence in terms of viscosity reduction and of decreased transformation activity in bacteria similarly pointing toward depolymerization has been also reported by Zamenhof et al. (Reference Zamenhof, Alexander and Leidy1953) (with a different buffer) and is synthesized in the following Figure 7 taken from such reference.

Figure 7. Effects of pH on viscosity and transforming activity according to experiments by Zamenhof et al. (Reference Zamenhof, Alexander and Leidy1953). Datapoints digitized from Figure 2 therein. Dots: measured viscosity; crosses: measured transforming activity; for further details on buffer composition refer to the original publication.
The data showing the effect of molecular weight decrease, as determined by the Zimm plot, and showing a spurious molecular weight increase due to fragments reaggregation, are shown in Table 4 and Figure 8 (data and image taken from Alexander and Stacey, Reference Alexander and Stacey1955).
Table 4. Influence of acid treatment on the weight and shape of DNA in solution as determined by light scattering measurements by Alexander and Stacey (Reference Alexander and Stacey1955)
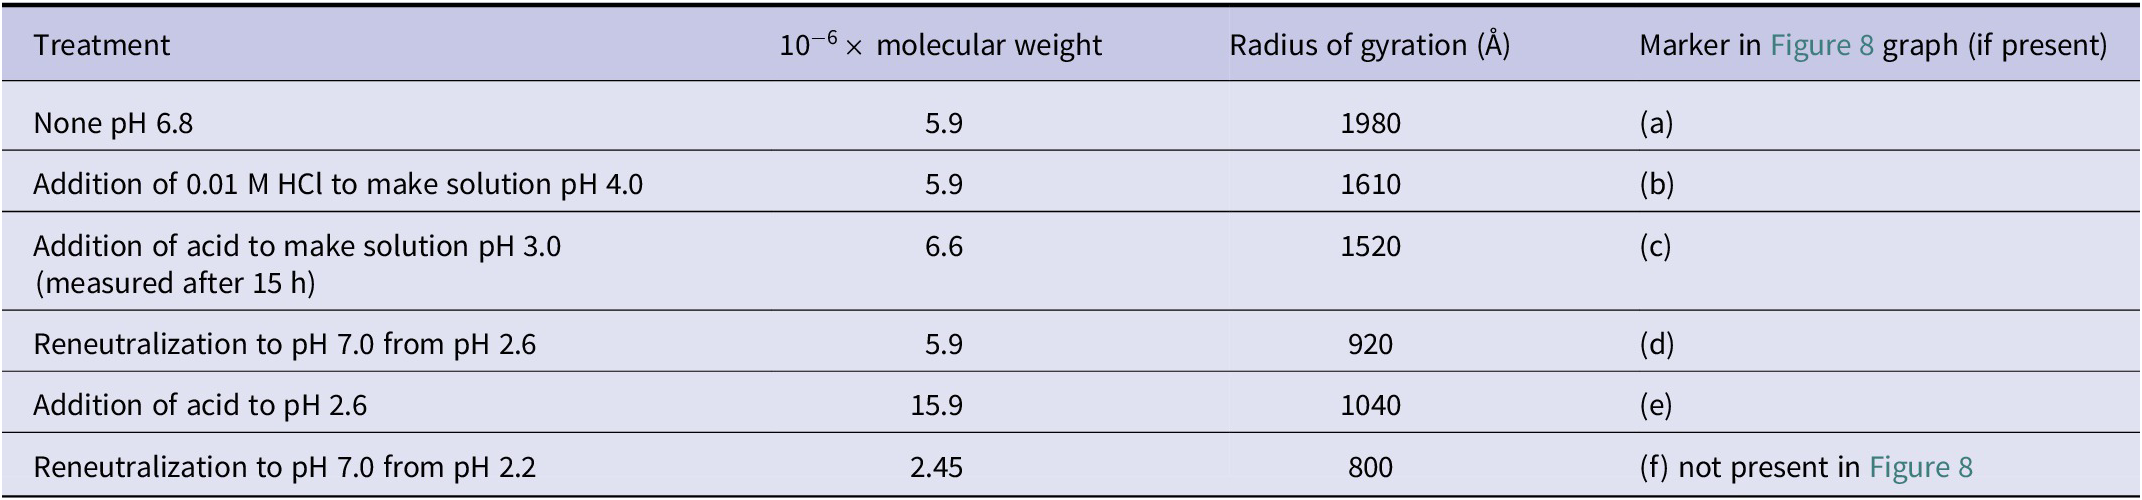

Figure 8. Reciprocal reduced intensity plots after different acid and neutralization treatments, according to experiments by Alexander and Stacey (Reference Alexander and Stacey1955). Datapoints and lines digitized from Figure 3 therein. (a) No treatments, pH 6.8; (b) pH 4.0; (c) pH 3.0; (d) pH 7.0 after re-neutralization from pH 2.6; (e) pH 2.6. See also corresponding values in Table 4 herein. In the original source, only the curve corresponding to the extrapolation to $ c\to 0 $
is plotted and not the entire Zimm grids. pH labels and arrows on the right side are the only addition to the data points and lines of the original figure.
$ c\to 0 $
is plotted and not the entire Zimm grids. pH labels and arrows on the right side are the only addition to the data points and lines of the original figure.
We recall that, as the intercept gives $ 1/M $
, when the intercepts of the curves in Figure 8 are lifted up after a treatment, the molecular weight of the particle (or of the aggregate of particles) decreases. The opposite is true when the intercept decreases: the weight of the particle increases (as observed by the Authors this phenomenon can result from aggregation revealed by the observed precipitation). The curves are best examined following the sequence of incremental acidification
$ 1/M $
, when the intercepts of the curves in Figure 8 are lifted up after a treatment, the molecular weight of the particle (or of the aggregate of particles) decreases. The opposite is true when the intercept decreases: the weight of the particle increases (as observed by the Authors this phenomenon can result from aggregation revealed by the observed precipitation). The curves are best examined following the sequence of incremental acidification $ (a)\to (b)\to (c)\to (e) $
and next considering the re-neutralization
$ (a)\to (b)\to (c)\to (e) $
and next considering the re-neutralization $ (e)\to (d) $
from pH 2.6 to pH 7.0. What is seen is that in step
$ (e)\to (d) $
from pH 2.6 to pH 7.0. What is seen is that in step $ (a)\to (b) $ $ M $
remains the same. Next in step (b)
$ M $
remains the same. Next in step (b) $ \to (c) $
, from pH 4.0 to pH 3.0, the lowering of the intercept corresponds to an increase of
$ \to (c) $
, from pH 4.0 to pH 3.0, the lowering of the intercept corresponds to an increase of $ M $
from 5.9
$ M $
from 5.9 $ \bullet {10}^6 $
to 6.6
$ \bullet {10}^6 $
to 6.6 $ \bullet {10}^6 $
. This increase can be interpreted as a first sign of fragmentation and reaggregation. Such a picture is confirmed in step
$ \bullet {10}^6 $
. This increase can be interpreted as a first sign of fragmentation and reaggregation. Such a picture is confirmed in step $ (c)\to (e) $
where pH is lowered from pH 3.0 to pH 2.6 and
$ (c)\to (e) $
where pH is lowered from pH 3.0 to pH 2.6 and $ M $
rises from 6.6
$ M $
rises from 6.6 $ \bullet {10}^6 $
to 15.9
$ \bullet {10}^6 $
to 15.9 $ \bullet {10}^6 $
showing a clear sign of reaggregation. The evidence that aggregation is reduced comes from step
$ \bullet {10}^6 $
showing a clear sign of reaggregation. The evidence that aggregation is reduced comes from step $ (e)\to (d) $
(from pH 2.6 to pH 7.0) when
$ (e)\to (d) $
(from pH 2.6 to pH 7.0) when $ M $
is lowered back again to 5.9, possibly giving the fallacious feeling of the molecule being undegraded since 5.9 is the same molecular weight of the best-preserved DNA samples. Any misinterpretation is ruled out by examining data in the last row of Table 4 showing that reneutralization to pH 7.0 from pH 2.2 yields a molecular weight of 2.45.
$ M $
is lowered back again to 5.9, possibly giving the fallacious feeling of the molecule being undegraded since 5.9 is the same molecular weight of the best-preserved DNA samples. Any misinterpretation is ruled out by examining data in the last row of Table 4 showing that reneutralization to pH 7.0 from pH 2.2 yields a molecular weight of 2.45.
Concerning the completeness of the dataset of measurements behind Figure 8, it is important to remark that the authors report to have performed the extrapolation by ordinarily testing the solution at different concentration (as required by the proper execution of the grid-plot methodology devised by Debie and Zimm) although only the curves corresponding to the extrapolation to $ c\to 0 $
are plotted by Alexander and Stacey in their figures and not the entire Zimm grids (this for avoiding data superposition and for permitting clear readability to the reader).
$ c\to 0 $
are plotted by Alexander and Stacey in their figures and not the entire Zimm grids (this for avoiding data superposition and for permitting clear readability to the reader).
Altogether the data by Alexander and Stacey (Reference Alexander and Stacey1955) recalled in Table 4 and Figure 8 herein disproof the claim by Reichmann et al. (Reference Reichmann, Bunce and Doty1953) that the DNA molecule recovers its original size and shape upon the pH being returned to pH 6.5 from pH 2.6 and the fallacious explanation that the large decreases in viscosity observed by several researchers upon adding acid to DNA solutions are due primarily to the contraction of the DNA molecules, the contribution of degradation being only secondary.
Referring to media more acid than pH 3.0 the Authors explicitly report the following evidence: ‘In more media, there was a rapid aggregation until precipitation occurred. At pH 2.6 apparently stable aggregates with molecular weights of about 15 $ \times $
106 were produced (Figure 3). This material is polydisperse and no significance can be attached to this numerical value since the weight-average molecular weight varies somewhat with slight changes in experimental conditions in this pH range’ (Alexander and Stacey, Reference Alexander and Stacey1955).
$ \times $
106 were produced (Figure 3). This material is polydisperse and no significance can be attached to this numerical value since the weight-average molecular weight varies somewhat with slight changes in experimental conditions in this pH range’ (Alexander and Stacey, Reference Alexander and Stacey1955).
It is thus recognized that the evidence obtained by Alexander and Stacey (Reference Alexander and Stacey1955) which has been herein recalled provides five elements of understanding:
-
▪ it rules out the possibility of DNA not being fragmented at pH 2.6 under the experimental conditions considered by Reichmann et al. (Reference Reichmann, Bunce and Doty1953);
-
▪ it confirms by the independent method of light scattering, also for the acidic treatment (not yet for heating), the effect of disaggregation and reaggregation highlighted by Shooter et al. (Reference Shooter, Pain and Butler1956), among others, by ultracentrifuge and viscosity analysis of heated DNA, previously recalled in the subsection of the scientific background titled ‘Evidence of viscosity drop and of heat turning fibrous material into flocculent precipitate’;
-
▪ it invalidates the hypothesis drawn by the group of Doty that the decrease in viscosity can be justified by the sole effect of contraction of the coiled DNA molecule;
-
▪ it confirms the existing evidence for acidic degradation with disaggregation and reaggregation already at pH 3.5 found by Cecil and Ogston (Reference Cecil and Ogston1948b) recalled above;
-
▪ most importantly, it points out the tangible risk of possible fallacious misdetection of increased molecular weight, or even of unchanged molecular weight, by light scattering in the presence of a limited set of data.
Questioned light-scattering evidence by Rice and Doty of stable molecular weight at 100° (with a second confutation)
Once the elements of knowledge in the bullet list above are acquired, the examination of the light scattering data by Rice and Doty (Reference Rice and Doty1957) on DNA subjected to heating at 94 °C and 100 °C can be carried out in an unbiased way able to separate the ‘wheat from the chaff’, that is, of separating a fallacious evidence of increased or stable molecular weight in front of an incomplete set of measurements. These results are presented hereafter.
For information on the methods and apparatus employed for the light scattering experiments, Rice and Doty refer to the experimental methods reported in Reichmann et al. (Reference Reichmann, Rice, Thomas and Doty1954). In this last publication, the apparatus is not described in detail and outer reference is made again to Reichmann et al. (Reference Reichmann, Bunce and Doty1953) and, transitively, to Doty and Bunce (Reference Doty and Bunce1952). In this last publication, as already recalled, it is specified that the light scattering measurements were made by a Brice-Speiser photometer. The Authors report that a saline-citrate solvent (0.015 M sodium citrate and 0.15 M NaCl) had been used in all light scattering experiments. The concentration of DNA solutions is reported to be of ‘about 6 mg/dl’ corresponding to 0.06 mg/cc. The employed DNA sample is again the one coded SB-11.
The study by Rice and Doty proceeds from the premise referred to the publication by Reichmann et al. (Reference Reichmann, Bunce and Doty1953) that: ‘When dissolved in 0.2 M NaCl, DNA can be exposed to PH values as low as 2.6 for several hours without significant chemical degradation’. Such a premise has been just shown in the previous subsection ‘A fundamental digression on the detection of DNA acidic degradation by light scattering with a confutation’ to be disproved by Alexander and Stacey (Reference Alexander and Stacey1955) showing that what had been detected at pH 2.6 are joint phenomena of fragmentation and reaggregation, in confirmation of Cecil and Ogston’s (Reference Cecil and Ogston1948b) early findings and of the multiplicity of evidences so far collected in the subsections titled ‘The pivotal papers of Doty et al. of the years 1955–1960’ and ‘Evidence of viscosity drop and of heat turning fibrous material into flocculent precipitate’ of the scientific background.
The data which Rice and Doty claim would show that heating at 100 °C during 15 minutes leaves the molecular weight unchanged are contained in Figure 5 therein. Such figure has been digitized and reproduced in current Figure 9b.

Figure 9. Figures 4 and 5 in Rice and Doty (Reference Rice and Doty1957). Angular distribution of scattered light for calf thymus DNA sample SB-11: (a) Measurements at 25° after the sample is heated at 94° during 0, 15, 30, 60, and 120 minutes. (b) Measurements at 25 °C after the sample is heated at 100 °C for 0, 15, 35, 60, and 120 minutes. Reprinted (adapted) with permission from Rice and Doty (Reference Rice and Doty1957), Copyright (1957), American Chemical Society.
Concerning the completeness of the dataset of measurements behind Figure 9, it is important to remark on the following key circumstance. The Authors report that ‘the molecular weight can be obtained from measurements at a single concentration’ and employ the value of 0.06 mg/cc, so that they do report of not having performed measurements at different solute concentrations and report of not having performed an ordinary extrapolation procedure with respect to concentration to obtain these curves. This choice appears to be non-compliant with the standard Zimm-plot methodology (devised by Reference ZimmZimm, 1948b and Debye, Reference Debye1947 and described in the subsection ‘Brief notes on the fundamentals of light scattering’ above) ordinarily applied, for instance, by Alexander and Stacey (Reference Alexander and Stacey1955) with the graphical construction shown in Figure 5 herein and ordinarily applied to obtain the plots in Figure 8. The non-compliant methodology deployed by Rice and Doty to obtain the plots and the molecular weight determination in Figure 9 can be promptly criticized based on the following consideration. From Figure 6 herein, which reproduces the complete Zimm plot extrapolation concerning a previous similar light scattering experiment by the same group of Doty over a similar DNA sample tested at pH 2.6 (Reichmann et al., Reference Reichmann, Bunce and Doty1953, Figure 1 therein), it is seen that the employment of one concentration, in place of the ordinary construction of the complete Zimm grids, is prone to considerable error. Actually, owing to the apparent variability of the curves upon concentration (see the subvertical curves therein intercepting the filled dots) by passing, for instance, from 0.005 to 0.05 mg./cc, the use of the single arbitrarily selected value of 0.06 mg/cc, indicated by the Authors, is prone to arbitrarily affect the particular point where the curve at the selected concentration intercepts the vertical axis. This approach is clearly prone to yielding a considerably large experimental error or even room for arbitrariness in selecting the concentration. Stated differently, if the curve reported by the Authors were to be determined at a different concentration – say of 0.005 mg/cc – it cannot be excluded that the intercept on the vertical axis and the corresponding determination for the molecular weight would have been considerably different. The criticality just highlighted deprives this measure of intersubjectivity and points to the necessity of rejecting this measure as scientific evidence supporting the 100 °C stable molecular weight claim.
It is worth to point out that, after having recalled and remarked in subsection ‘Molecular weight from combined sedimentation/viscosity measurements and the scientific debate among Doty, Shooter and coworkers’ the absence of scientific probative value of the arguments by Rice and Doty from sedimentation-viscosity measures in support of their 100 °C stable molecular weight claim, the light scattering data reproduced in the plots of Figure 9a,b remained the last possible surviving evidence from those contributed by Rice and Doty (Reference Rice and Doty1957) in support of such claim. It is also worth recalling that, as reviewed in subsection ‘Evidence from light scattering of DNA fragmentation upon heating’, all light scattering experiments on DNA heated at elevated temperatures, from all retrievable scientific publications of the decade 1950–1960 on such argument, show consistent and coherent evidence disproving the 100 °C stable molecular weight claim. Also, to the authors’ knowledge, there exists no other element of evidence from light scattering published in the literature of the decade 1950–1960 in possible support of the 100 °C stable molecular weight claim.
In the light of the considerations above and of the elements highlighted in subsection ‘Pioneering pre-1961 studies on DNA heating not authored by Doty’ of the scientific background, the confutation provided in the present subsection of a measurement of stable molecular weight from the light-scattering data of Doty and Rice brings to an end the review of the papers by Doty possibly supporting such claim and brings to zero the number of unconfuted elements of evidence in possible support of the 100 °C stable molecular weight claim.
Discussion on the structural resilience of DNA chains after reiterated PCR cycles
A summary of evidence of DNA thermal disruption
Upon having disproved in the third section ‘Review of the experiments on DNA heating by Doty and Rice (Reference Doty and Rice1955, Reference Rice and Doty1957)’ both claims by Doty and Rice of high-temperature heating + fast cooling dissociation and 100 °C stable molecular weight, we can summarize into the following statement the coherent picture emerging from the scope of the literature on thermal degradation of DNA (published between 1950 and 1960 and comprehensively reviewed in sections ‘Scientific background’ and ‘Review of the experiments on DNA heating by Doty and Rice, Reference Doty and Rice1955, Reference Rice and Doty1957’). Independent research, conducted by independent researchers using independent experimental methods, consistently and redundantly confirm Goldstein and Stern’s first observation, both qualitatively and quantitatively: if an aqueous solution of intact DNA molecules is heated between 81 °C and 100 °C, even for a few minutes, extensive sequence-breaking irreversible longitudinal fragmentation is produced and may be followed by reaggregation upon cooling. This evidence will be briefly referred to as DNA thermal disruption evidence.
As reviewed, the most compelling qualitative and directly perceivable empirical evidence of polidispersity and degradation is detected by Goldstein and Stern by direct visual observation of the native fibrous material turning into a flocculent precipitate when DNA is heated almost to the boiling point and then permitted to cool to room temperature. Similarly, Zamenhof and Chargaff describe that heating at 86° for 90 minutes yields a material which is thixotropic whereas unheated DNA solutions are not, and that heated DNA upon cooling does not return to preheating condition and becomes a gel-like material.
Precise indication of degradation after heating times closer to those provided for by PCR (ranging between 1 and 5 minutes per cycle) is reported in both works by Dekker and Schachman and by Shooter, Pain, and Butler: already after 15 minutes heating, irreversible drop of viscosity to a value close to that of the solvent alone occur associated with other evident phenomena such as spread of the sedimentation profiles with appearance of distinguishable species in solution and clear evidence of degradation and reaggregation of fragments.
These perceptive and qualitative evidence of thermal disruption were quantitatively shown in subsection ‘Molecular weight from combined sedimentation/viscosity measurements and the scientific debate among Doty, Shooter and coworkers’ of this review to be an undeniable fact even for the most stable preparations obtained by detergent methods, such as SB-11 tested by Doty, Rice, Shooter, Pain, and Butler, and even appealing to a possible ancillary influence of coiling contributing to the decrease in viscosity.
A specific quantitative determination of the number of fragmentations undergone by DNA after one or few minutes heating can be obtained from the relative viscosity versus time data and experimental conditions (in a barbital buffer) reported by Goldstein and Stern (see Figure 10a which is a reproduction of the original 1950-dated Figure 12).

Figure 10. Thermal depolymerization of 0.1% calf thymus DNA. (a) Figure 12 by Goldstein and Stern (Reference Goldstein and Stern1950), used with permission of John Wiley & Sons – Books, from Goldstein and Stern (Reference Goldstein and Stern1950), Copyright (1946). (b) Digitization of the same figure. (c) Corresponding plot of intrinsic viscosity versus time of heating computed from Eq. (18).
Readily employable tools for approximately evaluating the average molecular weight of the fragments (customarily employed by Cox, Overend, Peacocke, and Wilson in 1955 as well as by Doty, Marmur, Eigner, and Schildkraut in 1960) are the almost linear relation with the intrinsic viscosity $ \left[\eta \right] $
:
$ \left[\eta \right] $
: $ M\hskip0.4em \propto \hskip0.4em {\left[\eta \right]}^{1.083} $
or the fully linear relation obtained by Peacocke and Preston (Reference Peacocke and Preston1958) and reported in Eq. (5).
$ M\hskip0.4em \propto \hskip0.4em {\left[\eta \right]}^{1.083} $
or the fully linear relation obtained by Peacocke and Preston (Reference Peacocke and Preston1958) and reported in Eq. (5).
From data on relative viscosity in Figure 10a,b the intrinsic viscosity can be computed. In particular, Cox et al. (Reference Cox, Overend, Peacocke and Wilson1958) find, for a given DNA preparation from experiments at different concentrations, a linear relation between reduced viscosity and concentration (in g/ml.) representable in the following form:
 $$ {\eta}_{\mathrm{red}}(c)=\left[\eta \right]+{k}^{\prime}\bullet {\left[\eta \right]}^2\bullet c, $$
in which the experimentally determined value $ {k}^{\prime }=0.77 $
consistently matches with the value proper to extended chain molecules obtained by Simha (Reference Simha1949).
$ {k}^{\prime }=0.77 $
consistently matches with the value proper to extended chain molecules obtained by Simha (Reference Simha1949).
Relation (28) can be employed to compute the intrinsic viscosity from the relative viscosity. Actually, from (28) and recalling the relations among reduced, specific, and relative viscosity ( $ {\eta}_{\mathrm{red}}={\eta}_{\mathrm{sp}}/c $
and
$ {\eta}_{\mathrm{red}}={\eta}_{\mathrm{sp}}/c $
and $ {\eta}_{\mathrm{sp}}={\eta}_r-1\Big) $
we obtain:
$ {\eta}_{\mathrm{sp}}={\eta}_r-1\Big) $
we obtain:
 $$ {\eta}_{\mathrm{sp}}={\eta}_r-1=\left[\eta \right]\bullet c+{k}^{\prime}\bullet {\left[\eta \right]}^2\bullet {c}^2. $$
Terms in Eq. (29) can be ordered in the usual format for second-order algebraic equations introducing the relative viscosity:
 $$ {k}^{\prime }{c}^2\bullet {\left[\eta \right]}^2+c\bullet \left[\eta \right]-{\eta}_r+1=0. $$
The intrinsic viscosity $ \left[\eta \right] $
as related to
$ \left[\eta \right] $
as related to $ {\eta}_r $
is thus computed as the positive solution of Eq. (30), viz.:
$ {\eta}_r $
is thus computed as the positive solution of Eq. (30), viz.:
 $$ \left[\eta \right]\left({\eta}_r\right)=\frac{1}{2{k}^{\prime }{c}^2}\left(-c+\sqrt{c^2-4\bullet {k}^{\prime }{c}^2\bullet \left(1-{\eta}_r\right)}\right). $$
The plots of intrinsic viscosity versus time resulting from the elaboration of data in Figure 10b via function (31) and corresponding to $ c=0.001 $
and
$ c=0.001 $
and $ {k}^{\prime }=0.77 $
are reported in Figure 10c.
$ {k}^{\prime }=0.77 $
are reported in Figure 10c.
The intrinsic viscosity of the unheated solution is $ {\left[\eta \right]}_N=12.31 $
and the intrinsic viscosity of the solution after 1 minute heating at 100 °C is
$ {\left[\eta \right]}_N=12.31 $
and the intrinsic viscosity of the solution after 1 minute heating at 100 °C is $ {\left[\eta \right]}_{100{}^{\circ},1\min }=2.16 $
. These values can be used to compute from the most accurate viscosity-mass relation (5), obtained by Peacocke and Preston (Reference Peacocke and Preston1958), the (weight-average) molecular weight drop based on viscosity measurements:
$ {\left[\eta \right]}_{100{}^{\circ},1\min }=2.16 $
. These values can be used to compute from the most accurate viscosity-mass relation (5), obtained by Peacocke and Preston (Reference Peacocke and Preston1958), the (weight-average) molecular weight drop based on viscosity measurements:
 $$ \frac{{\left({M}_w\right)}_{100{}^{\circ},1\min }}{{\left({M}_w\right)}_N}=\frac{{\left[\eta \right]}_{100{}^{\circ},1\min }}{{\left[\eta \right]}_N}=\frac{2.16}{12.31}=0.17\cong \frac{1}{6}. $$
The experiments by Goldstein and Stern thus permit to compute that 1 minute heating at 100 °C determines the division of the initial molecule into segments whose average length can be closely rounded to the simple integer fraction of one-sixth and Eq. (6) permits to compute the corresponding average number of sequence-breaking fragmentations
 $$ F=\frac{{\left({M}_w\right)}_N}{{\left({M}_w\right)}_{100{}^{\circ},1\min }}-1=\frac{{\left({M}_n\right)}_N}{{\left({M}_n\right)}_{100{}^{\circ},1\min }}-1\cong 5. $$
This number of fragmentations per 1 minute corresponds to $ 5\times 15=75 $
fragmentations during a heating time of 15 minutes by assuming the number of fragmentations per minute to be a constant (in reality, this assumption yields an optimistic lower bound of fragmentations since the reviewed statistical models by Peacocke and Preston and by Applequist show that the number of full fragmentations is a quadratic function of time). It can be readily controlled that such a number of 75 fragmentations well fits with the determinations obtained for the longer time of 15 minutes heating by Shooter, Pain, and Butler and by Dekker and Schachman, as well as by Sadron (all results reviewed in the previous sections). The results of these authors show the production of fragments whose average weight ranges between 5% and 1% of the initial molecular weight of the molecule before heating (corresponding to 20 and 100 average number of fragmentations).
$ 5\times 15=75 $
fragmentations during a heating time of 15 minutes by assuming the number of fragmentations per minute to be a constant (in reality, this assumption yields an optimistic lower bound of fragmentations since the reviewed statistical models by Peacocke and Preston and by Applequist show that the number of full fragmentations is a quadratic function of time). It can be readily controlled that such a number of 75 fragmentations well fits with the determinations obtained for the longer time of 15 minutes heating by Shooter, Pain, and Butler and by Dekker and Schachman, as well as by Sadron (all results reviewed in the previous sections). The results of these authors show the production of fragments whose average weight ranges between 5% and 1% of the initial molecular weight of the molecule before heating (corresponding to 20 and 100 average number of fragmentations).
It is worth recalling that cooling after fragmentation is also a remarkable disordering factor since many works herein reviewed, describe, upon DNA cooling, evidence of fragment reaggregation and formation of a gel-like dispersion (see in particular the works by Shooter and coworkers) or even the formation of aggregates of molecular weight even higher than the original one.
What really happens during DNA thermal fragmentation?
Before attempting an answer, in the light of the bulk of the available data herein reviewed on the physical and chemical behavior of DNA subject to heating, to the opening question of this review (i.e., ‘To what extent the integrity of the sequential information of nucleotides is affected when the DNA solutions in the buffer conditions provided for by PCR is accordingly subjected to heating and cooling cycles of 95 °C or 100 °C as described by Mullis and Faloona?’) it is convenient to gain a few closer insights on the longitudinal sequence-breaking mechanism of DNA during thermal fragmentation. These insights will permit, based on simple arithmetical considerations, a computation of lower bounds of the number of fragments produced under PCR heating conditions in a sequence of nucleotides assumed initially intact.
Before attempting any calculation, it is however necessary to understand if the sequence-breaking rupture by heating alone involves either phosphodiester covalent bond breakages or the opening of labile hydrogen bonds, or even if both the circumstances have to be contemplated. By paraphrasing the title of the review by Chargaff (Reference Chargaff1968) titled ‘What Really Is DNA?’, the further question can be hence formulated ‘What really happens during DNA thermal fragmentation?’
Perhaps the simplest and most effective explanation of thermal disruption of DNA in an aqueous solution was early well depicted by the words of Kurnick as the disruptive effect of the ‘bombardment by the solvent molecules’.
A remarkable work which specifically and comprehensively examined this issue early in 1954 is the proceeding of the National Academy of Sciences of the United States of America authored by Dekker and Schachman (Reference Dekker and Schachman1954). These Authors, upon collecting a considerable body of evidence from light-scattering, ultracentrifugation, diffusion, viscosity, streaming birefringence, electron microscopy, titration, and other end-group studies such as dye binding, show sufficient evidence to cast doubt on the adequacy of a model made up of only two contiguous uninterrupted polynucleotide strands. Proceeding from the postulate that phosphodiester bonds cannot be thermally disrupted below 100 °C by heating alone, Dekker and Schachman show that, if compliance with all data from experimental evidence on DNA degradation by several agents is sought, it is mandatory to consider a modification of the Watson and Crick model of the DNA macromolecular structure to explain its division in shorter segments and, specifically, it is necessary to introduce an hypothesis on the presence of some sparse weaker and thermally labile longitudinal bonds, perhaps of hydrogen type, so as to consider that the true length of uninterrupted phosphodiester chains contained in an individual strand does not coincide with the full length of the strand. Specifically, they investigate the presence of: ‘either secondary forces, like hydrogen bonds, holding smaller molecular entities into some well-organized structure, or easily hydrolyzed covalent bonds, such as deoxyribosyl-1-phosphates, spaced at roughly periodic intervals along the main chains’. They show that a model more compatible with all data therein reviewed on DNA degradation is the interrupted two-strand aggregate sketched in Figure 11b corresponding to Watson & Crick’s double helical structure but composed of much smaller molecules held together in a specific configuration by hydrogen bonds between the purine and pyrimidine rings.

Figure 11. Sketch of two models for the macromolecular structure of DNA investigated by Dekker and Schachman (Reference Dekker and Schachman1954). (a) Watson and Crick’s model (helical structure is not represented in the sketch); (b) Dekker and Schachman’s model (helical structure is not represented in the sketch).
Proceeding from the consideration that it is highly improbable that a 15 minutes heating at 100 °C of DNA solution is capable of breaking phosphodiester bonds, Dekker and Schachman show that all evidence therein reviewed concur to bring to the conclusions that the observed features of thermal degradation can only be the result of the sole rupture of hydrogen bonds and that DNA is an aggregate of fragments of smaller molecular weight. They find corroboration of this model assumption from titration studies which can detect terminal phosphoryl groups giving good evidence for the existence of at least one terminal phosphate group for every 30 to 50 nucleotides (Lee and Peacocke, Reference Lee and Peacocke1951). On the same trend, other studies reviewed by Dekker and Schachman, based on rosaniline binding (Cavalieri and Angelos, Reference Cavalieri and Angelos1950), lead to estimating one terminal phosphoryl group for every 300 to 100 phosphorous atoms. Further studies therein reviewed on the action of magnesium ions on DNA bring to an analogous computation of one terminal group every 20 to 30 phosphorus atoms.
Interestingly enough, a further corroboration of this range of values can be now a posteriori recognized from the statistical analysis of enzymatic degradation performed by Applequist (Reference Applequist1961), 7 years after the publication by Dekker and Schachman (Reference Dekker and Schachman1954). Applequist computes the fraction $ {p}_0 $
of ‘seemingly already broken’ bonds on account of his double-strand random degradation model (reviewed in subsection ‘Models for random degradation matching experimental data’ of the scientific background) from the analysis of the kinetics of enzymatic degradation employing data later published in 1956 by Schumaker, Richards, and Schachman. The result of this computation is
$ {p}_0 $
of ‘seemingly already broken’ bonds on account of his double-strand random degradation model (reviewed in subsection ‘Models for random degradation matching experimental data’ of the scientific background) from the analysis of the kinetics of enzymatic degradation employing data later published in 1956 by Schumaker, Richards, and Schachman. The result of this computation is $ {p}_0=1.57\times {10}^{-2} $
. This value corresponds to approximately 1 interrupted P-bond every 64 nucleotides and hence to 1 terminal group every 32 nucleotides thus fitting well the range of data reported above. It is worth noticing, however, that in Applequist (Reference Applequist1961) the work by Dekker and Schachman (Reference Dekker and Schachman1954) is not quoted.
$ {p}_0=1.57\times {10}^{-2} $
. This value corresponds to approximately 1 interrupted P-bond every 64 nucleotides and hence to 1 terminal group every 32 nucleotides thus fitting well the range of data reported above. It is worth noticing, however, that in Applequist (Reference Applequist1961) the work by Dekker and Schachman (Reference Dekker and Schachman1954) is not quoted.
If the macromolecular interrupted-chains model by Dekker and Schachman was correct, it would readily explain the observations early reported by Goldstein e Stern of fragmentation after just one-minute heating, albeit such rupture would be allowed not by thermal ruptures in the sugar-phosphate links of the polynucleotide chain, yet by hydrogen bonds or by some other thermally labile and electrophoretically labile bonds.
In conclusion, to find a quantitative scientific answer (or at least a conservative estimate) on what is the effect in terms of molecular information integrity of the bombardment of the solvent molecule on the DNA molecule based on all empirical data collected in this study and proceeding from the undeniable evidence that the molecule is considerably segmented at high temperature even after just 1 minute, two hypotheses and two ensuing models must be comprehensive contemplated:
-
• (USH) standard Uninterrupted Strands Hypothesis: the molecule is made of two uninterrupted strands and the longitudinal sugar-phosphate bonds (P-bonds) can be ruptured at high temperatures;
-
• (ISH) Interrupted Strands Hypothesis by Dekker and Schachman: the P-bond cannot be ruptured even at high temperatures so that the segmentation is produced by initially weaker, or completely absent, longitudinal links which are found on every
$ j $
nucleotides with
$ j $
ranging between 40 and 600 and with 64 being a qualified number compatible with all estimation and range inferences from independent titration analyses, dye binding analyses, magnesium binding analyses, and enzymatic degradation analyses.


To appreciate the repercussions of the previously computed probability datum of an average of 5 fragmentations per 1 min 100 °C heating cycles (shortest heating time in PCR, repeated a minimum of 10 times) on the integrity of a given sequence of nucleobases, it is convenient to identify a sample test molecule model of given molecular weight. To this end, it is convenient to consider the same reference molecule of DNA considered by Dekker and Schachman of weight $ 5\times {10}^6 $
which is the best molecular value reported in their study and obtained from applications of the ‘mild’ method by Signer and Schwander’s for extracting calf thymus DNA. Recalling that the average molecular weight of the four nucleobases is equal to
$ 5\times {10}^6 $
which is the best molecular value reported in their study and obtained from applications of the ‘mild’ method by Signer and Schwander’s for extracting calf thymus DNA. Recalling that the average molecular weight of the four nucleobases is equal to $ \left(G+A+C+T\right)/4=\left(151+135+111+126\right)/4\cong 130 $
and that deoxyribose and phosphate group rounded weights are, respectively, 134 and 95, a weight of 720 per pair of nucleotides is obtained which corresponds to approximately 7000 pairs.
$ \left(G+A+C+T\right)/4=\left(151+135+111+126\right)/4\cong 130 $
and that deoxyribose and phosphate group rounded weights are, respectively, 134 and 95, a weight of 720 per pair of nucleotides is obtained which corresponds to approximately 7000 pairs.
In the USH hypothesis, a molecule of weight $ 5\times {10}^6 $
is thus composed of two strands of 7000 nucleotides each. In the ISH hypothesis, the evidence collected by Dekker and Schachman and the number of nucleotides above estimated on the basis of the number of detected end-groups lead these Authors to estimate between 300 to 500 terminal groups in a molecule of weight
$ 5\times {10}^6 $
is thus composed of two strands of 7000 nucleotides each. In the ISH hypothesis, the evidence collected by Dekker and Schachman and the number of nucleotides above estimated on the basis of the number of detected end-groups lead these Authors to estimate between 300 to 500 terminal groups in a molecule of weight $ 5\times {10}^6 $
, corresponding to a value ranging from 150 to 250 uninterrupted sub-chains (altogether in both strands) and, approximately, to an equal number of gaps/interruptions ranging from 150 to 250.
$ 5\times {10}^6 $
, corresponding to a value ranging from 150 to 250 uninterrupted sub-chains (altogether in both strands) and, approximately, to an equal number of gaps/interruptions ranging from 150 to 250.
Since in the ISH model, the most experimentally qualified number of nucleotides per sub-chain on the basis of the evidences reviewed herein and by Dekker and Schachman is 64, a most qualified single strand model, taking integer numbers, can be selected as being composed of 110 sub-chains ( $ 110\times 64=7040 $
nucleotides). We consider here, however, the example most favorable for the sake of molecular integrity corresponding to the lowest number of 75 ‘thermally unbreakable’ sub-chains made of 93 nucleotides each. This model is denominated interrupted-strand model ISH-93.
$ 110\times 64=7040 $
nucleotides). We consider here, however, the example most favorable for the sake of molecular integrity corresponding to the lowest number of 75 ‘thermally unbreakable’ sub-chains made of 93 nucleotides each. This model is denominated interrupted-strand model ISH-93.
Evidence shows that a cycle of heating followed by rapid cooling entails molecular fragmentation followed by possible reaggregation of fragments. A quantitative optimistic lower-bound estimate of the increment of the degree of disorder produced by such a fragmentation + reaggregation cycle can be obtained by a 1-dimensional sequential model in which the only information maintained is the sequence of nucleotides in the individual strands at the beginning and at the end of the heating/cooling cycle. Accordingly, any other degree of freedom of the molecule fragments (included rotation and translation) is excluded as well as the possibility of the formation, upon reaggregation, of a more topologically complex 3-dimensionally disordered arrangement, typical of colloidal aggregates, not describable by a sequential scheme. In such a simplest model, the datum of a lower bound of five complete double scissions with molecular segmentations per 1 minute heating at 100 °C (experimentally confirmed from Goldsten and Stern’s data), is taken as the basis for computation. In the abstraction considered, the sequence of nucleotides in an individual strand undergoes a shuffling rearrangement process characterized by five sequence openings.
For the USH model, this shuffling process consists of the following two steps:
-
Step 1. A scission step is represented as the random division of the initial ordered sequence of 7000 nucleotides into five sub-sequences each preserving the order of the contained nucleotide sub-sequences. This step can be also thought of as the cutting of a deck of 7000 cards into 5 subdecks.
-
Step 2. A permutation step in which the sequence of five sub-sequences resulting from Step 1 is subjected to a permutation which reassembles a new full sequence in which the order of each nested subsequence is left unchanged. Following the card deck analogy, this step corresponds to a permutation of the five subdecks obtained from cutting in Step 1 of the initial deck, and stacking the permuted subdecks to obtain a new deck of cards.
For the ISH-93 model, the shuffling model is the same as above, although uninterrupted phosphodiester sub-chains now replace the role of the individual cards of the USH shuffling model. Accordingly, shuffling consequent to five fragmentations consists of the following steps:
-
Step 1. A scission step is represented as the random division of the initial ordered sequence of 75 atomic (not divisible) sub-chains into five sub-sequences of sub-chains each preserving unaltered the order of the sub-chains; this step can be illustratively depicted as the ordered division of a deck of 75 cards into 5 subdecks.
-
Step 2. A permutation step in which the sequence of subsequences is reordered leaving the order of each nested subsequence unchanged.
The two models above provide an ‘optimistic’ quantitative estimate of the probability, for model USH, that a given sequence (or subsequence) of nucleotides of a certain length can preserve its integrity after a shuffling process or, analogously for the ISH-93 model, the probability that a given sequence (or subsequence) of sub-chains of nucleotides can preserve its integrity after a shuffling process representative of heating degradation.
These shuffling models provide a – very simplistic, yet very optimistic – quantitative answer to the question of what ‘really’ happens, for the sake of the integrity of molecular information, during DNA thermal fragmentation.
Considerations and computations on the basis of the specific number and duration of PCR heating cycles are carried out in the below section.
Implications of DNA thermal disruption evidence on PCR fidelity
Considerations on PCR buffers
Even if one resorts to appealing to a possible remedial protective action of the electrolytes in the PCR buffer reported by Mullis and Faloona, the data reported by Hamaguchi and Geiduschek (Reference Hamaguchi and Geiduschek1962) indicate that conditions provided for in the PCR buffer are prone to thermal instability at the PCR temperatures (of 95 °C and 100 °C) and that such conditions are less stable to thermal disruption than those of most of the DNA solutions employed in the many works herein reviewed. Moreover, data reported by Hamaguchi and Geiduschek (Reference Hamaguchi and Geiduschek1962) show that at any concentration of any of the many electrolytes therein investigated, upper bounds of thermal instability onset temperatures (defined as midpoints of thermal denaturation curves) cannot be, in any case, above 92.6 °C, so that a protective action of some electrolyte cannot be argued at 95 °C and 100 °C. To make matters worse, these data also show that thermal stability in sodium acetate (which is the prevalent solute in the PCR buffers) is even lower than in sodium chloride (see Table I therein) as the midpoint temperature of irreversible thermal denaturation curves viscometrically determined by these authors (which turns out to be always an upper bound of the temperature of thermal depolymerization onset) is lowered from 90.0 °C to 83.5 °C.
Most remarkably, the absence of NaCl in the PCR buffers deprives these solutions of the protective effect of salt against thermal degradation which the reviewed literature has shown to be fundamental.
Considerations on the known degrading effect of depurination by heating are not carried out but could be also taken into account. The addition of dithiothreitol (DTT) (the three isomer of 2,3-dihydroxy-1,4-dithiolbutane), which is a strong reducing agent, provided for in two PCR buffers (methods I and II) can be considered anything but a stabilizing component considering the capability of thiols of generating mercaptylated derivatives of DNA, as shown for instance by Tamm and Chargaff (Reference Tamm and Chargaff1953) employing phenylmethanethiol (benzyl mercaptan). The effect of addition of DTT is also not contemplated in the subsequent analyses.
Optimistic computations of the number of DNA fragmentations consequent to PCR heating
According to Mullis and Faloona (Reference Mullis and Faloona1987), PCR heating temperatures are 95 °C and 100 °C. The number of heating cycles in PCR multiplied by the duration of each heating process ranges approximately from a minimum overall time of exposure to heating of $ 10\times 1\;\mathrm{minute}=10 $
minutes (in methods I and II, prescribing addition of DTT) to maximum overall heating times higher than 40 minutes (in methods III, IV, V, and VI and in absence of DTT) and as high as
$ 10\times 1\;\mathrm{minute}=10 $
minutes (in methods I and II, prescribing addition of DTT) to maximum overall heating times higher than 40 minutes (in methods III, IV, V, and VI and in absence of DTT) and as high as $ 27\times 2=54 $
minutes in particular in method V.
$ 27\times 2=54 $
minutes in particular in method V.
The most promptly employable information for estimating the entity of fragmentation of PCR short heating cycles, among those herein reviewed, is represented by the five sequence-breaking fragmentations computed in the above subsection ‘A summary of evidence of DNA thermal disruption’ from Goldstein and Stern’s data on the viscosity drop consequent to 1 minute heating at 100 °C followed by cooling. We recall from the reviewed literature that the optimistical significance of this estimate from viscosity data in representing a reliable lower bound to the weight-average number of fragmentations and number-average number of fragmentations experimented by the distribution of DNA molecules during 1 minute heating at 100° is supported, among many others, by the following elements:
-
• ‘the random nature of the heat-denaturation process’ (Cox and Peacocke, Reference Cox and Peacocke1956);
-
• the knowledge that ‘it is only changes in the intrinsic viscosity which are of significance in the estimation of molecular size and shape’ reaffirmed, for instance, in Nature by Cox, Overend, Peacocke, and Wilson;
-
• the partial fragments reaggregation on cooling which determines a regain in viscosity (in part of thixotropic nature) so that what is actually determined by measuring a lower bound of the viscosity drop upon cooling of the heated solution is just a lower bound of the number of fragmentations really experimented by the molecule;
-
• the evidence, shown by Peacocke and Preston (Reference Peacocke and Preston1958) and by Applequist (Reference Applequist1961), that single-strand fragmentation is a first-order rate process and that the number of single-strand sequence-breaking ruptures by heating is linear with time all through the heating degradation.
-
• the evidence, shown by the same Authors, that the number of single-strand sequence-breaking ruptures by heating is much higher than the number of complete fragmentations of the molecule (requiring each a double longitudinal rupture), since it is a quadratic function of time.
Lower bound estimate of the probability of survival of a sequence of nucleotides after repeated heating/cooling 1 minute, 100 °C cycles
Based on the two models described in the above subsection ‘What really happens during DNA thermal fragmentation?’ (USH and ISH-93) and on the conservative assumption that one heating/cooling for 1 minute at 100 °C produces 5 fragmentations, a highly optimistic computation of the probability of survival (integrity preservation of molecular information) of a selected sequence of nucleotides contained in the main single-strand sequence after repeated cycles is carried out. As discussed above such a computation provides a lower bound of the degree of disordering and rupture experimented by a nucleotide sequence during such a cycle. We recall that:
-
• the USH model consists of the abstraction of uninterrupted strands of 7000 nucleotides assumed to have thermally labile longitudinal bonds;
-
• the ISH-93 model is an abstraction in which each strand is made of 75 sub-chains whose internal intranucleotide bonds are not thermally labile.
To perform a computation, the length of the sequence intended for PCR ‘amplification’ must be introduced. Mullis and Faloona (Reference Mullis and Faloona1987) write: ‘The sequence to be synthesized can be present initially as a discrete molecule or it can be part of a larger molecule.’
As far as the integrity of the full sequence is concerned, the computation is the same for the USH model and the ISH-93 model. Five random thermal longitudinal fragmentations occurring in 1 minute heating correspond to randomly dividing the main sequence into five subsequences each preserving its internal order of nucleotides. In the optimistic abstraction herein followed of cooling always being able to restore a sequential reaggregation of fragments, cooling corresponds to randomly reassembling these five ordered subsequences into one out of $ \left(5+1\right)!=720 $
new possible main sequences each obtainable as a random permutation, so that the probability of reobtaining the original full sequence is 1/720. Already after only 3 cycles, this probability becomes very low dropping to
$ \left(5+1\right)!=720 $
new possible main sequences each obtainable as a random permutation, so that the probability of reobtaining the original full sequence is 1/720. Already after only 3 cycles, this probability becomes very low dropping to $ \frac{1}{{\left(6!\right)}^3}=1/\left(2.6874\times {10}^{11}\right) $
. After the total number of 10 cycles provided for by PCR, corresponding to
$ \frac{1}{{\left(6!\right)}^3}=1/\left(2.6874\times {10}^{11}\right) $
. After the total number of 10 cycles provided for by PCR, corresponding to $ {n}_{\mathrm{Tfrag}}=10\times 5=50 $
overall fragmentations, the optimistic estimate of the probability of preserving the integrity of the molecule is
$ {n}_{\mathrm{Tfrag}}=10\times 5=50 $
overall fragmentations, the optimistic estimate of the probability of preserving the integrity of the molecule is $ 3.1097\times {10}^{-32} $
.
$ 3.1097\times {10}^{-32} $
.
The integrity of smaller contained sequences after 10 heating cycles is now examined. This issue is important, for instance, when the possible employment of PCR is intended by its users for searching for information possibly relatable to the gene expression of a protein. The length of the subsequence is indicated by $ {n}_{\mathrm{sub}} $
. A documented representative value of
$ {n}_{\mathrm{sub}} $
. A documented representative value of $ {n}_{\mathrm{sub}} $
can be set to
$ {n}_{\mathrm{sub}} $
can be set to $ {n}_{\mathrm{sub}}=1000 $
adopting, for instance, an optimistic lower bound of the typical lengths retrievable in public databases for the so-called spike protein (US National Center for Biotechnology Information, European Bioinformatics Institute, 2021).
$ {n}_{\mathrm{sub}}=1000 $
adopting, for instance, an optimistic lower bound of the typical lengths retrievable in public databases for the so-called spike protein (US National Center for Biotechnology Information, European Bioinformatics Institute, 2021).
For the USH model, denoting by $ {n}_T=7000 $
the total number of nucleotides, by
$ {n}_T=7000 $
the total number of nucleotides, by $ {n}_{\mathrm{sub}}=1000 $
the number of consecutive nucleotides of a subsequence, and by
$ {n}_{\mathrm{sub}}=1000 $
the number of consecutive nucleotides of a subsequence, and by $ {n}_{\mathrm{Tfrag}}=10\times 5=5 $
0 the total number of fragmentations after 10 cycles, the number of combinations by which the main sequence can be fragmented in 50 subsequences is computed as:
$ {n}_{\mathrm{Tfrag}}=10\times 5=5 $
0 the total number of fragmentations after 10 cycles, the number of combinations by which the main sequence can be fragmented in 50 subsequences is computed as:
 $$ {\displaystyle \begin{array}{rcl}{N}_m& =& \frac{n_T!}{\left({n}_T-{n}_{\mathrm{Tfrag}}\right)!{n}_{\mathrm{Tfrag}}!}=\frac{7000!}{\left(7000-50\right)!50!}\\ {}& =& \frac{7000\bullet 6999\bullet \dots \bullet 6952\bullet 6951}{50!},\end{array}} $$
where $ n! $
indicates the factorial of number
$ n! $
indicates the factorial of number $ n $
. The number of combinations by which the main sequence can be fragmented into 50 subsequences preserving the integrity of the main sequence is
$ n $
. The number of combinations by which the main sequence can be fragmented into 50 subsequences preserving the integrity of the main sequence is
 $$ {\displaystyle \begin{array}{c}{N}_{\mathrm{int}}=\frac{\left({n}_T-{n}_{\mathrm{sub}}\right)!}{\left({n}_T-{n}_{\mathrm{sub}}-{n}_{\mathrm{Tfrag}}\right)!{n}_{\mathrm{Tfrag}}!}=\frac{\left(7000-1000\right)!}{\left(7000-1000-50\right)!50!}=\\ {}=\frac{(6000)!}{(5950)!50!}=\frac{6000\bullet 5999\bullet \dots \bullet 5952\bullet 5951}{50!}.\end{array}} $$
The probability of preserving the integrity of the main sequence is thus computed to be:
 $$ {P}_{\mathrm{int}\mathrm{egr}}=\frac{N_{\mathrm{int}}}{N_m}=\frac{6000\bullet 5999\bullet \dots \bullet 5952\bullet 5951}{7000\bullet 6999\bullet \dots \bullet 6952\bullet 6951}\cong 0.00044. $$
The same computation can be carried out with the ISH-93 model in the same way by just converting in number of subchains elements (we recall, each sub-chain being composed of 93 nucleotides, see Table 5) the lengths of 7000 and 1000 in sub-tokens of 93, while the number of total fragmentations remains $ {n}_{\mathrm{Tfrag}}=10\times 5=5 $
0. Accordingly, one computes:
$ {n}_{\mathrm{Tfrag}}=10\times 5=5 $
0. Accordingly, one computes:
 $$ {n}_T:= \frac{n_T}{93}=\frac{7000}{93}\cong 75\hskip0.4em \mathrm{and}\hskip0.52em {n}_{\mathrm{sub}}:= \frac{n_{\mathrm{sub}}}{93}=\frac{1000}{93}\hskip0.4em \cong \hskip0.4em 11. $$
Table 5. Test molecule models USH, and ISH with equally spaced sub-chains of 56 and 93 nucleotides

The probability of preserving the integrity of the main sequence is thus computed to be for the ISH-93 model:
 $$ {P}_{\mathrm{int}\mathrm{egr}}=\frac{N_{\mathrm{int}}}{N_m}=\frac{64\bullet 63\bullet \dots \bullet 16\bullet 15}{75\bullet 74\bullet \dots \bullet 27\bullet 26}\hskip0.4em \cong \hskip0.4em 0.00000091, $$
so that computations elucidate that the ‘ISH-93 model’ at hand, although composed of longer sub-chains (hypothesized thermally unbreakable), turns out to be, as a matter of fact, less thermally stable, as far as the integrity of a sequence of 1000 nucleobases is concerned.
The above computations well exemplify and illustrate the remarkable proneness of PCR to entropy-related error determined by the presence of heating steps in such procedure, even more so if it is considered that all simplifying hypotheses introduced to arrive at such computations do have a lower-bound optimistic character, that is, they all contribute to the benefit of reducing the computed probability of disruption produced by the PCR heating cycles. The considerations above raise a serious concern toward longitudinal sequence-breaking degradation, even more so when the action of the randomizing effect of fragments reaggregation upon cooling is contemplated in addition to the randomization effect produced by thermal degradation at the end of each PCR heating cycle (ranging between 1 and 5 minutes). A critical factor related to this statement is the length of the sequence to be amplified and whether this sequence is larger than the sub-chain elements with uninterrupted phosphodiester bonds identified by Dekker and Schachman (Reference Dekker and Schachman1954). If the sequence to be amplified or to be detected is larger than the average length of the Dekker and Schachman sub-chains (93 in our simplified computations), as it is the case of a sequence of more than 100 nucleobases such as the length reported by NIH under the denomination spike protein, the probability of preserving integrity is thus computed to be very low.
In this regard, it is worth recalling that the abstraction of the physical phenomena of heating and cooling leading the computational models adopted for the calculations above have speculatively excluded the possibility of translation and rotation of the molecular fragments and the possibility of formation, upon reaggregation, of a more topologically complex-and more disordered nonsequential arrangement, like, for instance, a net.
Perhaps fewer words and fewer computations are necessary to represent to the reader the degree of disorder which can be achieved after just one heating–cooling cycle at 60 °C, by showing here in Figure 12 the electron micrograph taken by Williams (Reference Williams1952) of a sprayed 0.01% water solution of DNA prepared by the method by Schwander and Signer subjected to a process consisting of (1) freezing at −78 °C, (2) 60 °C heating for drying, and (3) rapid cooling.

Figure 12. Reproduction of Figure 1 by Williams (Reference Williams1952). (a) ‘Low-magnification ( $ \times \mathrm{13,500} $
) electron micrograph of a freeze-dried water solution of DNA. Three-dimensional character of specimen is well shown by the separation of fibers and their shadows in the region marked with an arrow. The horizontal fibers here are about 0.5 μ above substrate. Spherical particles are of polystyrene latex’. (b) ‘High magnification (
$ \times \mathrm{13,500} $
) electron micrograph of a freeze-dried water solution of DNA. Three-dimensional character of specimen is well shown by the separation of fibers and their shadows in the region marked with an arrow. The horizontal fibers here are about 0.5 μ above substrate. Spherical particles are of polystyrene latex’. (b) ‘High magnification ( $ \times \mathrm{100,000} $
) electron micrograph of DNA. Region indicated with an arrow shows fibril about 15 A in diameter’. Reprinted from Williams (Reference Williams1952, pp. 237–239), Copyright (1952), with permission from Elsevier Science and Technology Journals.
$ \times \mathrm{100,000} $
) electron micrograph of DNA. Region indicated with an arrow shows fibril about 15 A in diameter’. Reprinted from Williams (Reference Williams1952, pp. 237–239), Copyright (1952), with permission from Elsevier Science and Technology Journals.
It may be argued that Figure 12 may not be representative of the degree of disorder induced by PCR cycles because the DNA freeze-drying process, with 60 °C heating, leading to the micrograph of Figure 12 may have induced disordering factors that cannot be comparable with the effect in PCR of multiple 95 °C or 100 °C heating steps followed by quick cooling. It is undeniable that, while the milder 60 °C heating must have induced a significantly lower degradation, concentration and drying have a significant role in determining the picture of densely agglomerated fibers in Figure 12.
On the other hand, micrographs of the molecules in the material produced after DNA heating at 100 °C have been taken by Doty et al. (Reference Doty, Marmur, Eigner and Schildkraut1960). Figure 3 in the same paper shows the electron micrograph with a magnification factor $ \left(\times \mathrm{95,000}\right) $
of DNA molecules from a solution heated in saline-citrate at 100 °C for 10 minutes, and then diluted, slowly cooled, and dialyzed. Such micrograph shows longer molecules having all, with no exceptions, a cross-linked, non-sequential, topologically complex, and involuted structure, appearing in large part quite intricately coiled and, as observed by the Authors, with ‘irregular patches at the ends of cylindrical threads’. Figure 4 in Doty et al. (Reference Doty, Marmur, Eigner and Schildkraut1960) shows a micrograph obtained with exactly the same methodology with the only difference that the cooling step was instead performed quickly. The description given by the Authors is that the figure ‘shows only irregularly coiled molecules with clustered regions’. As this second micrograph has the same magnification factor as the first Figure 3, relevant to slowly cooled DNA, the lengths of the observable molecular threads in the two figures can be compared. By comparing the two figures, it is evident that the visible aggregates in Figure 4, besides being in some part clustered, are also much smaller in length and few individual thread-like fragments, even up to 20 times shorter than the thread-like structures of Figure 3, can be almost clearly discerned.
$ \left(\times \mathrm{95,000}\right) $
of DNA molecules from a solution heated in saline-citrate at 100 °C for 10 minutes, and then diluted, slowly cooled, and dialyzed. Such micrograph shows longer molecules having all, with no exceptions, a cross-linked, non-sequential, topologically complex, and involuted structure, appearing in large part quite intricately coiled and, as observed by the Authors, with ‘irregular patches at the ends of cylindrical threads’. Figure 4 in Doty et al. (Reference Doty, Marmur, Eigner and Schildkraut1960) shows a micrograph obtained with exactly the same methodology with the only difference that the cooling step was instead performed quickly. The description given by the Authors is that the figure ‘shows only irregularly coiled molecules with clustered regions’. As this second micrograph has the same magnification factor as the first Figure 3, relevant to slowly cooled DNA, the lengths of the observable molecular threads in the two figures can be compared. By comparing the two figures, it is evident that the visible aggregates in Figure 4, besides being in some part clustered, are also much smaller in length and few individual thread-like fragments, even up to 20 times shorter than the thread-like structures of Figure 3, can be almost clearly discerned.
Altogether the evidences recapitulated in this section, and in particular the ascertainment by Applequist (Reference Applequist1961) that the molecular weight halving reported by Doty et al. (Reference Doty, Marmur, Eigner and Schildkraut1960) is only ‘fortuitously in agreement’ with the value of ½, should recommend caution in verifying the true nature of the phenomena observed when slow cooling is applied after heating, as described by Doty et al. (Reference Doty, Marmur, Eigner and Schildkraut1960) (frequently referred to as ‘annealing’). Caution should be applied to verify whether these annealing phenomena truly consist of an ordered reformation of a two-stranded material from the association of two one-stranded chains, or also involve the other much less ordered combined fragmentation-aggregation phenomena, elucidated by the researches of Sadron and coworkers (Sadron, Reference Sadron1955; Reference Sadron1959; Freund et al., Reference Freund, Pouyet and Sadron1958) and Shooter et al. (Reference Shooter, Pain and Butler1956). As shown in this review, these phenomena are instead mainly ascribable to some combination of thermal degradation and possible aggregation/agglomeration, during the subsequent cooling stage, into clusters made of many shorter degraded two-stranded molecules of lower molecular weight.
The possible occurrence of these degradation and reaggregation phenomena should be considered also in the interpretation of data from experiments which have employed heat-denaturing processes inspired by those proposed by Doty et al. (Reference Doty, Marmur, Eigner and Schildkraut1960). One of these interpretative problems is raised, for instance, with the results presented by Hall and Spiegelman (Reference Hall and Spiegelman1961) who have applied heat-denaturing processes at 95 °C along 15 minutes to investigate the possible formation of helices pairings or helices complexes made of DNA and RNA looking forward to a confirmation of the interpretations suggested by previous X-ray diffraction studies (Rich and Davies, Reference Rich and Davies1956; Felsenfeld et al., Reference Felsenfeld, Davies and Rich1957; Rich, Reference Rich, By and Glass1957, Reference Rich1958, Reference Rich2006).
Summarizing, as elucidated by the elements of empirical evidence and by the conservative quantitative lower-bound predictions collected in the present section, it would not be an exaggeration to argue that achieving a faithful amplification, and even before detection, of a long nucleobase sequence after reiterated cooling and uncooling cycles of PCR, may appear to be as much plausible as pretending to faithfully reconstitute at the Ångströms scale a complete long celery stalk of the size of few thousands Ångströms from a soup of randomly aggregated and very similar vegetable fragments, with each fragment being dozens of times smaller in size. Such a duty would be burdensome enough for a nanoscale Maxwell’s demon with tweezers capable of seeing and reconstructing the searched nucleobase sequence, even more so in the absence of such a demon and by just reiterating the thermal bombardment by heating/cooling cycles.
Conclusions
The first part of the present study has examined and scrutinized fundamental published scientific studies concerning the effect of DNA heating under the conditions prescribed for every PCR cycle. This review has highlighted the evidence, consistently and redundantly emerging from all experimental results in all scientific documents examined in this study, that the heating step determines the onset of longitudinal sequence-breaking random fragmentation of DNA molecules.
In the second part of this study, on the basis of the reviewed experimental data and by adopting conservative mechanical hypotheses, predictions have been presented of lower bounds of the induced degree of disorganization in molecular sequences after one cycle and several cycles. The extent of the measured disruption induced by just one cycle under the heating conditions provided by PCR and the computed extent of the consequential degree of disorganization in nucleobase sequences produced after reiteration of these cycles bring to the evidence, obtained with probability very close to certainty, that PCR products consist of chaotically randomized sequences of nucleotides. The many elements of evidence highlighted in this study altogether induce us to consider to date still a conjecture the possibility of reading or amplifying genetic information which consists of larger nucleobase sequences taken from samples which have undergone thermal processes equal or similar to those prescribed by PCR. Concerns toward molecular integrity of sequences of any length may also be raised from the use in PCR of buffers containing reducing agents such as DTT and from possible thermal depurination, although these issues have not been herein specifically investigated and are left for possible future work.
In the light of the strong elements of qualitative and quantitative evidence collected in the present work, a preliminary, but very precise, answer may be given to the opening question: ‘To what extent is Polymerase Chain Reaction fully reliable?’
The results emerged from this study lead to the conclusion that a reliable affirmation about the products of all those methodologies claiming DNA amplification, which are based on heating at high temperatures under conditions equal or similar to those prescribed by the basic Mullis’ PCR protocols, is the following: these products almost unavoidably will mainly consist of aggregates of chaotically randomized sequences of nucleobases unless these methods do not remove at the root physical and chemical factors adverse to molecular longitudinal integrity.
The possibility of erroneous reports obtained with the basic PCR protocol should be carefully scrutinized by the scientific community also in due consideration of the evidence collected in this review.
Data availability statement
Data supporting the reported results can be found in the referenced publications.
Acknowledgments
The Network Inter-Library Document Exchange service (NILDE) of the Consiglio Nazionale delle Ricerche d’Italia, the United States National Academy of Sciences, and the National Institute of Health of the US Department of Health and Human Sciences are gratefully acknowledged for providing free access to bibliographical sources. Dr. Alexandra Elbakyan is gratefully acknowledged for the provision of additional scientific resources.
Author contribution
Conceptualization: R.S.; Data curation: R.S.; Formal analysis: R.S.; Methodology: R.S.; Validation: R.S., F.F.; Writing – original draft preparation: R.S.; Writing – review and editing: R.S., F.F. All authors have read and agreed to the published version of the manuscript.
Financial support
This research received no specific grant from any funding agency, commercial, or not-for-profit sectors.
Competing interest
The authors declare no conflict of interest.


