


1. Introduction
The mating system can greatly influence the genetic structure of populations. Crosses between relatives and selfing reduce multilocus heterozygosity (MLH) and increase gametic disequilibria in the resulting progenies (Hedrick, Reference Hedrick2000). At the population level, they also lead to a reduction of the effective size and an increase of inter-population differentiation. Moreover, demographic fluctuations (caused by variable ecological conditions) may result in transient bottlenecks that are expected to have the same effect on the population's diversity and differentiation (Cornuet & Luikart, Reference Cornuet and Luikart1996). Marine species with high fecundity and high early mortality such as oysters (Elm-oyster model; Williams, Reference Williams1975), are particularly prone to display large variance in reproductive success, because of gametic (gamete quality and sperm–egg interaction) and zygotic (zygotic competition and differential viability of genotypes) effects (Boudry et al., Reference Boudry, Collet, Cornette, Hervouet and Bonhomme2002), contributing to a reduction of their effective population size. Hence, many marine species have a combination of high fecundity and narrow conditions for spawning success that may lead to wide individual variation in realized reproductive success, such that an annual cohort is the result of only a few spawning events or individuals (Hedgecock, Reference Hedgecock and Beaumont1994).
The flat oyster, Ostrea edulis, an endemic European species, naturally occurs from Norway to Morocco in the North-Eastern Atlantic and in the whole Mediterranean Sea. It has been harvested for at least 6000 years (Goulletquer & Héral, Reference Goulletquer and Héral1997). However, overharvesting and, more recently, the successive occurrence during the 1960s of two protozoan diseases caused by Marteilia refringens and Bonamia ostreae drastically decreased its production. For example, the French production was reduced from 20 000 tonnes in the 1950s to 1 900 tonnes at present (FAO, 2007). Hence, the native European flat oyster is listed in the OSPAR (Oslo-Paris) Convention for the Protection of the Marine Environment of the North-Eastern Atlantic (species and habitat protection). In the context of potential restoration along European coasts (Laing et al., Reference Laing, Walker and Areal2005), it is important to assess the potential impact of hatchery-propagated stocks on the genetic variability and the effective population size of wild populations (Gaffney, Reference Gaffney2006). Therefore, information is needed about the genetic variability of hatchery-propagated stocks (Lallias et al., Reference Lallias, Lapègue, Boudry, King and Beaumont2010) and the structure and dynamics of wild populations to ensure the proper management of populations and aquaculture production.
The genetic structure of wild O. edulis populations has been analysed with microsatellite DNA (Launey et al., Reference Launey, Ledu, Boudry, Bonhomme and Naciri-Graven2002) and mitochondrial DNA (12S) markers (Diaz-Almela et al., Reference Diaz-Almela, Boudry, Launey, Bonhomme and Lapègue2004). Genetic differentiation based on mitochondrial data was 10-fold greater (F st=0·224; Diaz-Almela et al., Reference Diaz-Almela, Boudry, Launey, Bonhomme and Lapègue2004) than the one established on microsatellite data (F st=0·019; Launey et al., Reference Launey, Ledu, Boudry, Bonhomme and Naciri-Graven2002). This quantitative difference of a factor of 10 observed between the nuclear and mitochondrial F st was proposed to be attributable to a reduced female effective population size. This could be explained by several factors: (i) a biased effective sex-ratio towards males owing to the protandry of the species and the higher energy cost in oogenesis (Ledantec & Marteil, Reference Ledantec and Marteil1976), leading to a lower probability of becoming female. This is aggravated by the B. ostreae-caused disease (Culloty & Mulcahy, Reference Culloty and Mulcahy1996), which induces high mortalities within 2–3-year-old adults, (ii) a higher variance in female than male reproductive success (Boudry et al., Reference Boudry, Collet, Cornette, Hervouet and Bonhomme2002; Taris et al., Reference Taris, Boudry, Bonhomme, Camara and Lapègue2009). Other explanations are: (1) N ef is one-quarter of N e and (2) F st is proportional to (H S–H T) (H S being the average subpopulation Hardy–Weinberg heterozygosity and H T being the total population heterozygosity) and H S approached 1·0 in the microsatellites used (Hedrick, Reference Hedrick2005a).
Heterozygote deficiencies with regard to Hardy–Weinberg equilibrium expectations are common in marine bivalve populations (Zouros & Foltz, Reference Zouros and Foltz1984; Huvet et al., Reference Huvet, Boudry, Ohresser, Delsert and Bonhomme2000; Hare et al., Reference Hare, Allen, Bloomer, Camara, Carnegie, Murfree, Luckenbach, Meritt, Morrison, Paynter, Reece and Rose2006) and were reported in O. edulis for allozymes (Wilkins & Mathers, Reference Wilkins and Mathers1973; Saavedra et al., Reference Saavedra, Zapata, Guerra and Alvarez1987; Alvarez et al., Reference Alvarez, Zapata, Amaro and Guerra1989) and microsatellites (Launey et al., Reference Launey, Ledu, Boudry, Bonhomme and Naciri-Graven2002). Microsatellite markers are particularly prone to PCR artefacts such as the presence of null alleles and upper allele drop-out, which are responsible for the commonly observed heterozygote deficiencies. Moreover, a positive correlation between MLH and life history traits such as growth or survival was reported in O. edulis based on allozymes (Alvarez et al., Reference Alvarez, Zapata, Amaro and Guerra1989; Launey, Reference Launey1998) and microsatellite markers (Bierne et al., Reference Bierne, Launey, Naciri-Graven and Bonhomme1998). Two kinds of arguments were mentioned to explain heterozygote deficiencies and correlations heterozygosity-growth. The first hypothesis, overdominance, implies that selection acts directly on allozymic genotypes, questioning the allozyme's neutrality. This hypothesis was refuted by the evidence of the same phenomenon occurring with reputedly neutral markers like microsatellites (Bierne et al., Reference Bierne, Launey, Naciri-Graven and Bonhomme1998; Launey & Hedgecock, Reference Launey and Hedgecock2001). The second hypothesis, associative overdominance, stipulates that marker polymorphism is neutral but indirectly reflects variation in loci linked to fitness by genetic correlations. Genetic markers, whether allozymes or microsatellites, can therefore either represent neutral loci in gametic disequilibrium with physically close loci under selection (local effect) or represent neutral markers of the overall genomic heterozygosity (general effect, David et al., Reference David, Delay, Berthou and Jarne1995). Whether local or general, the associative overdominance hypothesis takes root in the characteristics of reproductive biology and dynamics of these species. Indeed, according to Bierne et al. (Reference Bierne, Launey, Naciri-Graven and Bonhomme1998), an instantaneous reduced effective population size can induce gametic disequilibrium between genetic markers and loci linked to fitness (local effect), whereas partial inbreeding can generate a variation in the global genomic heterozygosity between individuals (general effect). Li & Hedgecock (Reference Li and Hedgecock1998) in Crassostrea gigas and Hedgecock et al. (Reference Hedgecock, Launey, Pudovkin, Naciri, Lapègue and Bonhomme2007) in O. edulis highlighted the fact that, under local circumstances, the effective population size can be drastically reduced by a high variance in reproductive success, which could in turn generate a temporary gametic phase disequilibrium (reinforcing the associative overdominance hypothesis).
Variance in the individual reproductive success among parents has also been documented under experimental conditions using controlled crossing (e.g. Hedgecock & Sly, Reference Hedgecock and Sly1990; Hedgecock et al., Reference Hedgecock, Chow and Waples1992 and references therein; Petersen et al., Reference Petersen, Ibarra, Ramirez and May2008). The most direct evidence comes from studies of the Pacific oyster, C. gigas, in which changes in family representation in progenies resulting from factorial crosses were analysed using microsatellite markers for parentage analyses (Boudry et al., Reference Boudry, Collet, Cornette, Hervouet and Bonhomme2002; Taris et al., Reference Taris, Ernande, McCombie and Boudry2006). Their results showed large variance in parental contributions at several developmental stages, leading to a strong reduction of experiment-wide effective population size that could be attributed to four main factors: gamete quality, sperm–egg interaction, sperm competition and differential survival among families.
In order to document further the phenomena of variance in reproductive success both in natural- and hatchery-produced populations of O. edulis, we performed two complementary studies to answer two questions: (1) Is it possible to detect a variance in reproductive success which could result in a reduced effective population size? (2) How is this variance expressed temporally? To answer these questions, brooding females were firstly sampled in the wild and the number of males fertilizing each female estimated on the basis of microsatellite allele frequencies. Then, to get rid of drawbacks inherent to working with large natural populations and multiple environmental factors, parentage analyses were conducted under experimental conditions: successive cohorts were collected from a population of potential progenitors kept in the hatchery, whose genotypes were known, in order to infer a posteriori the relative contribution of each. The results of these two studies are discussed in the light of previous studies of wild- or hatchery-bred flat oysters.
2. Materials and methods
(i) Sampling and experimental design
First experiment – during summer 2001, 13 flat oysters, O. edulis, and the larvae present in their mantle cavity (i.e. brooding females) were collected when sampling individuals in Quiberon Bay (Brittany, France). This area represents a natural recruitment zone for this species. The sampling period extended from June to August:
• 26/06/2001: females F1 and F2
• 10/07/2001: females F4, F5, F6, F7 and F8
• 17/07/2001: females F9 and F10
• 08/08/2001: female F21
• 14/08/2001: females F22, F23 and F24
Second experiment – in November 2002, 62 adult oysters were sampled from a natural population in the same bay and transferred in raceways in the Ifremer experimental hatchery of La Tremblade (France). They were first anaesthetized with MgCl2 (Culloty & Mulcahy, Reference Culloty and Mulcahy1992) to get biopsies of the gills for microsatellite genotyping. They were then conditioned for spawning, by increasing the water temperature and food supply. Additional food consisted of three species of phytoplankton: Isochrysis galbana, Chaetoceros calcitrans and Tetraselmis suecica. Sieves were placed under the outflow pipe in order to collect larvae during the reproductive period (water flow: 150 litres/h). The term ‘cohort’ refers to larvae that were collected, just after their release, on these sieves. Sieves were checked daily to collect the larvae that were then kept in 70% ethanol for further genetic analysis. It is known that stocks of adult flat oysters produce larvae over an extended period, contrary to the cupped oysters which are mass spawners (Helm et al., Reference Helm, Bourne and Lovatelli2004).
(ii) Genotyping
DNA extraction for adult oysters (gill tissue) was performed by a classical phenol/chloroform method (Sambrook et al., Reference Sambrook, Fritsch and Maniatis1989). Eighty larvae per brooding female or per cohort were separated under a binocular lens in a Dolfuss tank, and individuals were put in a 0·2 ml Eppendorf tube with 4 μl of 70% ethanol. Larval DNA extraction was performed by evaporating ethanol and adding 50 μl of extraction buffer (1·5 ml of 10×PCR buffer, 75 μl of Tween 20, distilled water up to 15 ml) and 5 μl of proteinase K (10 mg/ml) (Taris et al., Reference Taris, Baron, Sharbel, Sauvage and Boudry2005). The larvae were incubated for 1 h at 55°C and 20 min at 100°C. Genomic DNA was kept at −20°C.
Four microsatellite loci were used: OeduJ12, OeduU2, OeduH15 and OeduT5 described in Launey et al. (Reference Launey, Ledu, Boudry, Bonhomme and Naciri-Graven2002). PCRs were performed in a 10 μl reaction mix containing 5 μl template DNA, 2·5 mM MgCl2, 0·1 mM dNTPs, 0·25 μM of each primer, 1 unit of Goldstar Licensed Polymerase (Eurogentec) and 1×polymerase buffer (supplied by the manufacturer). The primers were synthesized by MWG Biotech with each forward primer labelled with IRD-700 (OeduJ12 and OeduU2) or IRD-800 (OeduH15 and OeduT5). Amplifications were processed as follows: pre-denaturation (95°C, 5 min) followed by 30 cycles of denaturation/annealing of primers/polymerization (95°C, 20 s; T a, 20 s; 72°C, 20 s) and a final elongation step (72°C, 30 min). The annealing temperature T a of the primer pair was, respectively, 50°C for OeduJ12, OeduH15 and OeduU2 and 53°C for OeduT5. Variation in fragment size was visualized by 6·5% polyacrylamide denaturing gels run at 1 500 V, 40 W, 40 mA, at 50°C on a LICOR® DNA sequencer. Genotypes were scored with reference to individuals, whose alleles were of known size, and the resulting data were analysed with the Gene Profiler 4.0 software.
(iii) Genetic analysis
Microsatellite genetic polymorphism within the adult population and within each temporal cohort was measured as the mean number of alleles per locus, the observed (H o) and expected unbiased (H nb) heterozygosity (Nei, Reference Nei1978). Estimate of allelic richness (A) that uses rarefaction to correct unequal sizes (El Mousadik & Petit, Reference El Mousadik and Petit1996) was also performed per locus and sample with the program FSTAT version 2.9.3 (Goudet, Reference Goudet1995). A Friedman test was applied to detect differences in allelic richness among samples (Minitab 14.0): the adults and progeny cohorts were the treatments and the loci were the blocks. F-statistics described by Wright (Reference Wright1931) were computed according to Weir and Cockerham's estimators, using Genetix 4.1 software (Belkhir et al., 1996–Reference Belkhir, Borsa, Chikhi, Raufaste and Bonhomme2001). Deviations from the Hardy–Weinberg equilibrium (F is) were computed in the adult population and in each cohort. Moreover, genetic differentiations between adult population and cohorts were estimated using Wright's fixation index F st, estimated by θ (Weir & Cockerham, Reference Weir and Cockerham1984). The significance of departures from zero of F is and F st was assessed by 1000 permutations of the appropriate data (alleles within individuals for F is, individuals among populations for F st).
We used three different methods for estimating the effective number of breeders (N b): (1) the temporal moments method of Waples (Reference Waples1989), based on the changes of allelic frequencies between the adult population and each of the cohorts (NeEstimator 1.3 software; Peel et al., Reference Peel, Ovenden and Peel2004; http://www.dpi.qld.gov.au/28_6908.htm), (2) the excess heterozygosity method (NeEstimator 1.3 software) and (3) the linkage disequilibrium (LD) method (LDNe program; Waples & Do, Reference Waples and Do2008). For the LD method, the P crit value is the minimum frequency for alleles to be included in the analysis. We performed the analyses using a P crit value of 0·05 or 0·01. There is a trade-off between bias and precision: generally, the lower the P crit value, the more precise but also the more biased the N b estimates will be (Waples & Do, Reference Waples and Do2010).
(iv) Paternal analysis of larvae collected in brooding females
For the larvae collected in the mantle cavity of 13 wild brooding females, only mothers' genotypes and adult population allelic frequencies were available. Because of the size of the studied population, it was indeed impossible to sample all its individuals in order to obtain genotypes of all possible fertilizing males. To determine the number of males that contributed to the progeny of each female, two parental reconstruction software were used, one based on Bayesian statistics, the other on a combinatory approach. Both used multilocus genotypes of the known parent and offspring to reconstruct the genotypes of unknown fathers contributing to the progeny array.
The mean numbers of males having fertilized each of the 13 brooding females analysed, as well as the standard error over the 1000 iterations, were first estimated using PARENTAGE 1.0, a software based on Bayesian statistics developed by Ian Wilson (Emery et al., Reference Emery, Wilson, Craig, Boyle and Noble2001; http://www.mas.ncl.ac.uk/~nijw). In the input file, several priors concerning the distributions of offspring among males were stated:
• An equivalent contribution (each male contributes equally to the offspring)
• Number of fathers between 1 and 60
The mutation rate, accounting for assignation failures, was stated as equal to 0·02.
We also used GERUD 2.0 (Jones, Reference Jones2005), based on a combinatory approach, which does not rely on the choice of priors. First, paternal alleles were established by subtraction. Then, an exhaustive search was performed, which tried every possible combination of paternal genotypes. The program provided all possible combinations of the minimum number of fathers. When several combinations of paternal genotypes were consistent with the progeny array, the solutions were ranked by likelihood, based on the segregation of paternal alleles in the general population according to Mendelian expectations. As this approach is computationally intensive, it is restricted to progeny arrays with less than six fathers (Jones & Ardren, Reference Jones and Ardren2003). Therefore, it was computed only for females whose progeny presented a low number of alleles.
(v) Parentage analysis of temporal cohorts collected in the hatchery population
For the temporal cohorts collected in the hatchery, the genotypes of all potential progenitors are known, but not their sex as flat oysters are alternative hermaphrodites and can change sex during the same reproductive season (personal observations). First of all, exclusion probabilities, which correspond to the probability that a parent taken at random in a population can be excluded, were computed. It is of prime importance to compute the exclusion probability prior to any parentage analysis, to ensure that the set of molecular markers used is powerful enough to successfully achieve parentage analysis. Exclusion probabilities were computed for each locus separately (P El) and for all loci progressively combined (P CE) according to Chakraborty et al. (Reference Chakraborty, Meagher and Smouse1988):

where n is the number of alleles at locus l and pi is the frequency of the ith allele.
For L loci

Exclusion probabilities computed for the pool of 62 potential progenitors were 73·7, 94·5 and 98·3% for OeduJ12, OeduU2 and OeduT5, respectively. The combined exclusion probability obtained with the three loci was 99·9%.
For parentage assignment, the ‘Parental pair (sexes unknown)’ option of CERVUS 3.0 (Marshall et al., Reference Marshall, Slate, Kruuk and Pemberton1998; Kalinowski et al., Reference Kalinowski, Taper and Marshall2007) was used. It is a parental pair allocation program, based on a maximum likelihood approach. The statistic Delta is defined as the difference in logarithm of odds (LOD) scores between the most likely candidate and the second most likely candidate. In the simulation of parental analysis, the proportion of loci typed was 0·93, the simulated genotyping error was set at 0·01, the number of candidate parents was 62 and the proportion of candidate parents sampled was set at 100%. Critical values of Delta were determined for 80 and 95% confidence levels based on the simulations of 10 000 offspring.
3. Results
(i) Genetic and paternity analyses of the brooding females collected in a natural population
Genotypes at three to four microsatellite loci were determined for 80 larvae collected in each brooding female. Beforehand, the compatibility of maternal alleles was checked in each offspring; five females, respectively, F4, F6, F8, F23 and F24 showed some larvae whose genotypes were not compatible at locus OeduH15. In these cases, the five females were apparently homozygous; mismatching arose from the presence of homozygous larvae for an allele different from the one of the corresponding female. Null alleles were suspected; females were most likely heterozygous for a null allele thus making the larvae heterozygous exhibiting a paternal allele and the suspected maternal null allele. This has already been reported for this locus (Launey et al., Reference Launey, Ledu, Boudry, Bonhomme and Naciri-Graven2002). Consequently, genotypes at OeduH15 were recoded to take into account the segregation of a null allele, before performing the paternity analyses. The number of alleles per locus was assessed in each progeny array for each female. Locus OeduH15 presented a lower number of alleles, always below 12. The mean number of alleles per locus was highly variable, from 4·3 for F7 to 18·5 for F10 (Table 1).
Allelic polymorphism and paternity analysis of 13 brooding females sampled in a natural population (Brittany, France). Numbers of alleles (N a) per locus and the mean number of alleles are shown for 80 offspring of each female. n loci: the number of loci used for paternity analysis. Number of fathers (N f) contributing to each offspring has been determined by two software, PARENTAGE 1.0 (Bayesian method) and GERUD2.0 (parental reconstruction). Equivalent prior refers to the prior stating an equal contribution of males to the progeny. na: not available (number of alleles too high)

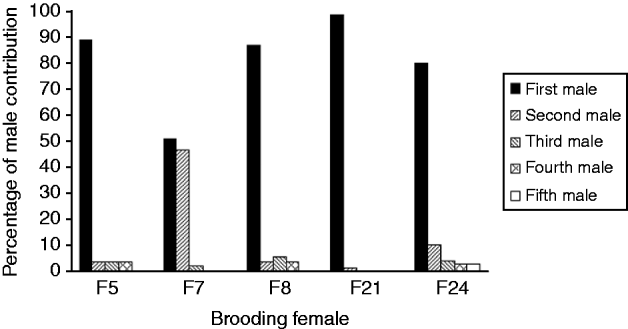
The mean number of male parents as determined with PARENTAGE 1.0 was highly variable among females, from 2 to more than 40 (Table 1). Software GERUD 2.0 was used for the five progeny arrays showing the lowest number of alleles: F5, F7, F8, F21 and F24. Minimum numbers of fertilizing males were obtained (Table 1), as well as the genotypes of males contributing to each array. Each paternal genotype was associated with the number of larvae compatible with this genotype. Paternal contributions showed a much skewed distribution, with some males contributing to 50–100% of the progeny assay (Fig. 1).
Variance of reproductive success between males, determined with a parental reconstruction software, GERUD2.0 (Jones, Reference Jones2005), for brooding females showing few alleles in their offspring. First male refers to the male with the highest contribution to the offspring, second male is the male with the second highest contribution. For each female, first to fifth males refer to different males.
(ii) Genetic diversity, differentiation and effective number of breeders of temporal cohorts collected in the hatchery
Six temporal cohorts were collected from the batch of adult oysters kept in the hatchery during a short period of time between 14 March 2003 and 30 March 2003, although the experiment was pursued until the end of June. These cohorts were named by the date of collection: 14, 17, 20, 22, 28 and 30/03/2003. The six cohorts were also pooled into a ‘Total cohort’, for analysis. Multilocus genotypes (at OeduJ12, OeduU2 and OeduT5) were determined for the adult population and for 80 larvae from each cohort. The population of potential progenitors consisted of 62 adults. The LD was computed for each pair of loci for the adults kept in the hatchery with the option 2 of the web-based version Genepop software (genepop@wbiomed.curtin.edu.au). No significant LD (P>0·63 for each combination) was observed in the population of progenitors: the three loci studied segregate independently.
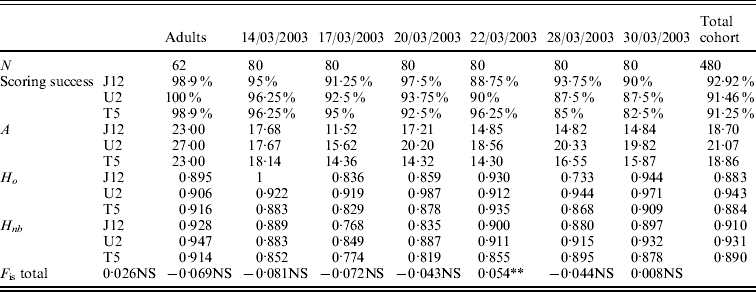
The values of allelic richness varied from 23·00 to 27·00 for the adult population depending on the locus (Table 2). For the six temporal cohorts collected, the values of allelic richness varied from 11·52 to 20·33 depending on the locus and the cohort. For the total cohort (six pooled cohorts), the allelic richness was 18·70 for OeduJ12, 21·07 for OeduU2 and 18·86 for OeduT5 (Table 2). Regarding the allelic richness across loci in the adult sample and the six cohorts, there were significant differences observed (Friedman test statistic S=13·30, df=6, P=0·04). The values of observed and expected heterozygosity were high, above 0·9 (Table 2). Deviations from the Hardy–Weinberg equilibrium (F is) were computed for the adults and the cohorts (Table 2). The global heterozygote deficiency was not significant for the population of progenitors. None of the heterozygote excesses observed in the cohorts was significant. The significant heterozygote deficiency observed for the cohort of 28/03/2003 (P<0·05) was attributable to locus OeduJ12 (P<0·001 for this locus after Bonferroni correction).
Genetic diversity, test for Hardy–Weinberg equilibrium for a population of 62 potential progenitors and six cohorts obtained in an experimental hatchery. Number of samples analysed (N), allelic richness (A), expected (H nb) and observed (H o) heterozygosity and F is estimates according to Weir & Cockerham (Reference Weir and Cockerham1984). Total cohort corresponds to the pooling of the six temporal cohorts. Significance of F is tested on 1000 permutations; NS corresponds to the non-significant values of P, *P<0·05; **P<0·01 and ***P<0·001
Genetic differentiations (F st values) were computed for each pair of samples (adult/cohort; cohort/cohort). All values were highly significant (P<0·001 or P<0·01). Genetic differentiation ranged from 0·7% (between cohorts 20/03/2003 and 22/03/2003) to 11·9% (between cohorts 14/03/2003 and 17/03/2003) (Table 3a). Genetic differentiations were also computed between the population of progenitors and the cohorts progressively pooled (Table 3b). With pooling, genetic differentiation became blurred, but was non-significant only when all six pooled cohorts were compared to the progenitors.
(a) Genetic differentiation between and within the population of potential progenitors and six cohorts obtained in an experimental hatchery. (b) Genetic differentiation between the population of potential progenitors and the six cohorts progressively pooled. F st values per population pair (Weir & Cockerham, Reference Weir and Cockerham1984) are expressed in percentage and their significance is tested by 1000 permutations: ***P<0·001; **P<0·01; *P<0·05; NS, non-significant
(a)


The effective number of breeders (N b) was computed for each temporal cohort, using three different methods. The N b estimates varied according to the method used, but were generally below 25. The excess heterozygosity method and the LD method (with a P crit value of 0·05) gave consistently lower N b estimates (Table 4). The temporal method and the LD method (using a P crit value of 0·01) gave very similar estimates. The cohort 17/03/2003 had the lowest N b. For the total cohort, the heterozygote excess and LD methods gave N b estimates ranging between 15 and 34, whereas N b estimate was 96 based on the temporal method (Table 4).
Estimated effective number of breeders N b for each cohort by temporal and heterozygote (H) excess methods (using NeEstimator 1.3 software) and the LD method (using LDNe program). Variance intervals are given in brackets. LD0·05: with lowest allele frequency used (P crit value) of 0·05; LD0·01: with P crit value of 0·01. Ng (Real) is the number of progenitors having contributed to each cohort, determined by parentage analysis with CERVUS 3.0 software (80% statistical confidence). Total cohort corresponds to the pooling of the six temporal cohorts

(iii) Parentage analysis of temporal cohorts collected in the hatchery
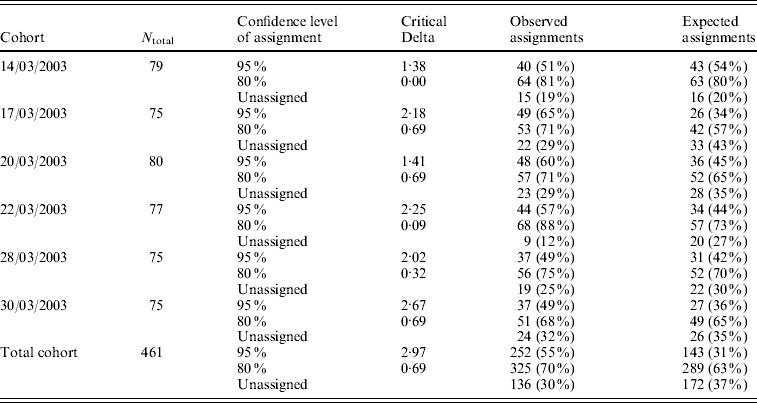
CERVUS 3.0 software was used to assign the most likely parental pair to each offspring of a progeny array. For each of the six temporal cohorts collected in the hatchery, the percentage of larvae that were assigned a parental pair ranged from 49 to 65% with a 95% statistical confidence, and from 68 to 88% with a 80% statistical confidence (Table 5). Out of 62 potential progenitors, 10 did not contribute, 15 contributed to only one cohort, 11 to two cohorts, 10 to three cohorts, 5 to four cohorts, 5 to five cohorts and 6 contributed to all 6 cohorts. Depending on the cohort, the number of contributing progenitors ranged from 19 (17/03/2003) to 28 (14/03/2003 and 28/03/2003) (Table 4).
Number of parentage assignments for six temporal cohorts collected in the hatchery, using CERVUS 3.0 software. N total: number of larvae included in the analysis (genotyped for at least 2 loci). The critical Delta scores and the expected number of parentage assignments were determined by the simulation of parentage analysis (see text)
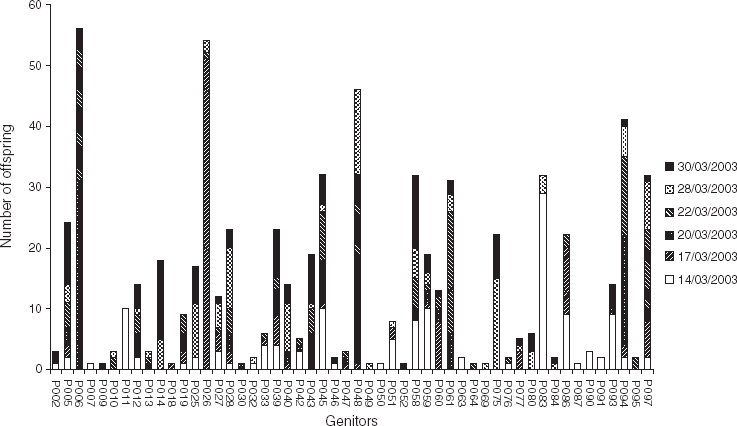
It is apparent from Fig. 2 that the total contribution of each progenitor, in terms of number of offspring, was very variable. For example, 10 progenitors contributed each to a single offspring (e.g. P007, P009 and P018), whereas four progenitors contributed each to more than 40 offspring (P006, P026, P048 and P094). Also, it can be noticed that some parents contributed to successive cohorts (e.g. P014, P075 contributed to 28/03/2003 and 30/03/2003), while others contributed to cohorts spaced in time. For example, P083 contributed to two cohorts spaced by 2 weeks: 14/03/2003 and 28/03/2003. The contribution of this individual to these two cohorts was confirmed by the segregation of rare alleles (exhibited by only this individual); hence, P083 exhibited a rare allele at locus OeduU2, which was found in some larvae of these cohorts. Segregation of such rare alleles was used to qualitatively check the succession of some individuals along the time found with CERVUS. The results were consistent: rare allele analysis revealed the contribution of P014 in 28/03/2003 and 30/03/2003; of P028 to five cohorts (from 17/03/2003 to 30/03/2003); of P045 in 14/03/2003; and of P061 in 20/03/2003 and 22/03/2003.
Total contribution of progenitors (in terms of number of offspring) to each of the six cohorts collected in an experimental hatchery. Parentage analysis was performed using a parental pair categorical allocation software, CERVUS 3.0 (Marshall et al., Reference Marshall, Slate, Kruuk and Pemberton1998; Kalinowski et al., Reference Kalinowski, Taper and Marshall2007), with an 80% statistical confidence.
Finally, there was a succession in the time of major contributing progenitors (Fig. 3). The main progenitor of 14/03/2003 was P083, contributing to more than 20% of the progeny. P026 contributed to almost 50% of the 17/03/2003 cohort, whereas P006 contributed to almost 30% of the 20/03/2003 cohort. For the last three cohorts, no progenitor had a contribution over 20%.
Percentage of contribution of each potential progenitor to each temporal cohort, visualizing the succession of major contributors over time. Parentage analysis was performed using a parental pair allocation software CERVUS 3.0 (Marshall et al., Reference Marshall, Slate, Kruuk and Pemberton1998; Kalinowski et al., Reference Kalinowski, Taper and Marshall2007), with 80% statistical confidence.

4. Discussion
The advent of molecular tools and methods for parentage analysis (reviewed in Jones et al., Reference Jones, Small, Paczolt and Ratterman2010) has greatly facilitated the genetic investigation of mating systems and the evaluation of patterns and determinants of reproductive success in aquatic organisms. Genetic methods have recently added much insight into the reproductive and parental care behaviour of several fish species by analysing the genetic parentage of broods collected in nature (Sefc et al., Reference Sefc, Mattersdorfer, Sturmbauer and Koblmüller2008; Tatarenkov et al., Reference Tatarenkov, Healey, Grether and Avise2008; Byrne & Avise, Reference Byrne and Avise2009). Moreover, genetic parentage analyses have been employed to gain a better understanding of the spawning behaviour and reproductive dynamics of captive fish broodstock held in commercial breeding tanks (Jeong et al., Reference Jeong, Gonzalez, Morishima, Arai and Umino2007; Herlin et al., Reference Herlin, Delghandi, Wesmajervi, Taggart, McAndrew and Penman2008; Blonk et al., Reference Blonk, Komen, Kamstra, Crooijmans and van Arendonk2009). Finally, high variance in reproductive success has previously been reported in bivalves, both in natural populations (Li & Hedgecock, Reference Li and Hedgecock1998; Hedgecock et al., Reference Hedgecock, Launey, Pudovkin, Naciri, Lapègue and Bonhomme2007; Arnaud-Haond et al., Reference Arnaud-Haond, Vonau, Rouxel, Bonhomme, Prou, Goyard and Boudry2008) and in experimental conditions (Boudry et al., Reference Boudry, Collet, Cornette, Hervouet and Bonhomme2002; Petersen et al., Reference Petersen, Ibarra, Ramirez and May2008). To our knowledge, only a few studies combine experimental studies with observations in natural populations.
(i) Comparison of natural population and experimental hatchery conditions
The first part of our study allowed the estimation of the effective number of individuals contributing as fertilizing males to the progeny of brooding females in natura. Paternity analyses revealed that this number was highly variable (from 2 to more than 40, Table 1). Our results also revealed a high variance of the relative contribution of each male within a female (Fig. 1). In the studied population, the number and spatial distribution of individuals was unknown, as well as the effective sex ratio or local environmental conditions. Therefore, no hypothesis could be put forward to explain why a particular female was (or was not) fertilized by a particular male, or to explain the variance in the relative contribution of the males; this highlighted the need to work under experimental conditions in a controlled environment to mimic what happens at the population level. The experimental part of the present study was therefore performed to describe mating among individuals in more detail. In this second part of our study, as individuals of similar size and physiological condition were kept under common environmental conditions (temperature and food input), we could expect that all oysters would become mature around the same time. Moreover, progenitors were moved daily inside the tank aiming to avoid spatial effect on fertilization caused by the direction of the water flow in the raceway. Thus, variance in reproductive success was expected to be low. Consequently, the variance in relative contributions observed within each cohort truly represented intrinsic capacities (physiology and genetics) of individuals to reproduce. A similar approach was successfully used in the lion-paw scallop (Petersen et al., Reference Petersen, Ibarra, Ramirez and May2008). Furthermore, a comparable experimental design was successfully used to study the hypothesis that reproductive success is randomly distributed within the spawning aggregations of Atlantic cod (Rowe et al., Reference Rowe, Hutchings, Skjaeraasen and Bezanson2008). This indicates that the experimental design might be of particular interest to understand better the behaviour of wild populations.
(ii) Variance in reproductive success and effective population size: implications
There is a relationship between reproductive biology (variance in reproductive success implying a low N e) and temporary disequilibrium (or markers-based heterosis). To explain heterozygote deficiencies and heterozygosity-growth correlations, the associative overdominance hypothesis postulates that selectively neutral markers are affected by selection operating on linked loci with effects on fitness. Genetic markers, whether allozymes or microsatellites, can therefore either represent neutral loci in gametic disequilibrium with physically close loci under selection (local effect) or represent neutral markers of the overall genomic heterozygosity (general effect, David et al., Reference David, Delay, Berthou and Jarne1995). The analysis of distorted segregation ratios in C. gigas confirms that these distortions are mainly attributable to selection against recessive deleterious mutations of fitness genes linked to these distorted markers (Launey & Hedgecock, Reference Launey and Hedgecock2001). David et al. (Reference David, Perdieu, Pernot and Jarne1997) suggest that even small levels of inbreeding can be sufficient to maintain disequilibrium between markers and fitness genes that causes the observed markers-associated heterosis. Moreover, the ratio N e/N can be drastically reduced by a high variance in reproductive success (Hedgecock, Reference Hedgecock and Beaumont1994; Launey & Hedgecock, Reference Launey and Hedgecock2001; Hedrick, Reference Hedrick2005b; Hedgecock et al., Reference Hedgecock, Launey, Pudovkin, Naciri, Lapègue and Bonhomme2007) that could generate temporary gametic disequilibrium and markers-associated heterosis.
This study highlighted the existence of variance in reproductive success as well as a locally reduced effective size in experimental (controlled) conditions. The two combined phenomena are compatible with the possibility of temporary gametic disequilibria, which favour the local effects hypothesis of associative overdominance. Moreover, variance in reproductive success highlighted in this study could be accentuated by variations in environmental conditions in the wild. Such a variance in reproductive success has been assessed previously in C. gigas by PCR-Single Strand Conformation Polymorphism (SSCP) (Li & Hedgecock, Reference Li and Hedgecock1998) and by microsatellites (Boudry et al., Reference Boudry, Collet, Cornette, Hervouet and Bonhomme2002). This variance can be explained by the asynchrony of maturation, as already observed some years in Brittany (France) with three successive spawns separated by about 2–3 weeks (Martin et al., Reference Martin, Littaye-Mariette, Langlade and Allenou1995).
The effective number of breeders (N b) is a fundamental parameter for the management of genetic resources and conservation biology, because it influences the magnitude of genetic drift in the closed population under scrutiny. It determines the rate of inbreeding (ΔF=1/2N b) and hence the rate of genetic variability loss in a population. In species with overlapping generations, however, the effective number of breeders per year (N b) can differ from the population's long-term effective size N e. This study demonstrated a limited effective number of breeders in the six temporal cohorts, generally below 25 (Table 4). However, N b (based on the temporal method) was computed between two successive generations and therefore equilibrium was not achieved. Moreover, it is important to notice that the effective sex ratio in the experimental population is unknown. Some features of the life history of oysters tend to limit the effective population size: a biased sex ratio and the fact that fertilization takes place in the mantle cavity which pleads in favour of fertilization by nearest neighbours (Saavedra et al., Reference Saavedra, Zapata, Guerra and Alvarez1987). Moreover, the analysis of genetic variability of a cohort collected early in the reproductive season in Sète in 1993 (Hedgecock et al., Reference Hedgecock, Launey, Pudovkin, Naciri, Lapègue and Bonhomme2007) demonstrated that spat collected was issued from a small number of progenitors (probably <20). This is in agreement with the fact that sexual maturation is not synchronous in this species (Ledantec & Marteil, Reference Ledantec and Marteil1976) and that reproductive success can be highly variable in time, at least at the beginning of the reproductive season when only a few individuals are mature.
The occurrence of such gametic disequilibria is temporary and therefore it is not always observed. These patterns of temporal genetic differentiation at the local scale were described as ‘chaotic genetic patchiness’ (Johnson & Black, Reference Johnson and Black1984; David et al., Reference David, Perdieu, Pernot and Jarne1997), because they are transient and do not represent a permanent structure. The ability of detecting them depends on the sampling window and time. Indeed, in the Hedgecock et al. (Reference Hedgecock, Launey, Pudovkin, Naciri, Lapègue and Bonhomme2007) study reported above, few individuals contributed to the recruited cohort probably because of the scarcity of oysters already mature at that time of the year. However, another similar study (Taris et al., Reference Taris, Boudry, Bonhomme, Camara and Lapègue2009) collected successive 15 days cohorts later in the season and showed neither genetic differentiation between adults and cohorts nor temporal structuring of the genetic diversity observed with nuclear markers. This suggests that several differentiated cohorts were integrated into a wide 15 days cohort, erasing genetic differentiation: the sampling window (15 days) was perhaps too wide. This previous result obtained in the wild is supported by the study of our experimental population where F st was computed between progenitors and successive cohorts, as well as pooled cohorts. A high genetic differentiation was found between the population of potential progenitors and the first cohort (F st 3%, P<0·001): this could be explained by a few individuals contributing to the cohort. As soon as successive cohorts were pooled, more and more progenitors contributed to these cohorts and hence genetic differentiation faded to cancel finally when all the cohorts were pooled (Table 3b). Therefore, the pool of successive cohorts appears to represent a random and representative set of alleles of the progenitor population. However, such a result is driven in a very large part by the limited power of the dataset, as F st is estimated on only three loci. From Table 2, we can see that the allelic richness is still quite a bit lower in the pooled cohorts than in the parents. The pooled cohorts certainly seem to constitute a more representative set than any of the individual cohorts, but it would probably still be found to be differentiated from the parents if more loci had been used. The detection of this phenomenon depends probably on the sampling window: for the cohort of Hedgecock et al. (Reference Hedgecock, Launey, Pudovkin, Naciri, Lapègue and Bonhomme2007), this window was 15 days in early spring. In this study, we showed the existence of a genetic differentiation at a smaller stepping time: between two successive cohorts spaced 2–3 days, different individuals contributed to the cohorts explaining the genetic differentiation observed.
We thank the technical team of Ifremer La Tremblade for their technical assistance, in particular Serge Heurtebise and Florence Cornette. Special thanks to Ian Wilson for his help with the PARENTAGE software. We would like to thank two anonymous referees for helpful comments on this manuscript.



