

Introduction
Ecological niche modeling (ENM) is a widely used technique developed by biologists for estimating species’ environmental requirements (i.e., abiotic niche attributes) by correlating known species occurrences with spatially explicit environmental characteristics (Guisan and Zimmerman Reference Guisan and Zimmerman2000; Guisan and Thuiller Reference Guisan and Thuiller2005; Elith and Leathwick Reference Elith and Leathwick2009; Peterson et al. Reference Peterson, Soberón, Pearson, Anderson, Martínez-Meyer, Nakamura and Araújo2011). This method allows biologists to test quantitative hypotheses of species’ interactions with their environment across space or into the near future or recent past. Over the last 25 years, ENM has been used to investigate species biogeography (e.g., Svenning and Svok Reference Svenning and Skov2004; Graham and Hijmans Reference Graham and Hijmans2006; Graham et al. Reference Graham, VanDerWal, Phillips, Moritz and Williams2010), conservation biology (e.g., Martínez-Meyer et al. Reference Martínez-Meyer, Peterson, Servín and Kiff2006; Tinoco et al. Reference Tinoco, Astudillo, Latta and Graham2009; Tittensor et al. Reference Tittensor, Baco, Brewin, Clark, Consalvey, Hall-Spencer, Rowden, Schlacher, Stocks and Rogers2009; Zang et al. Reference Zang, Zhou, Chen, Slik, Cannon and Raes2012), the spread of invasive species (e.g., Peterson Reference Peterson2003; Thuiller et al. Reference Thuiller, Richardson, Pysek, Midgley, Hughes and Rouget2005a; Broennimann et al. Reference Broennimann, Treier, Müller-Schärer, Thuiller, Peterson and Guisan2007; Jiménez-Valverde et al. Reference Jiménez-Valverde, Peterson, Soberón, Overton, Aragón and Lobo2011a), and the effects of predicted climate change (e.g., Pearson and Dawson Reference Pearson and Dawson2003; Thuiller et al. Reference Thuiller, Lavorel, Araújo, Sykes and Prentice2005b; Hijmans and Graham Reference Hijmans and Graham2006; Saupe et al. Reference Saupe, Papes, Selden and Vetter2011). Additionally, when used in conjunction with phylogenetic information, ENM can be used to investigate the conservation or divergence of niche characteristics during evolution. Many studies using modern data sets have supported phylogenetic niche conservation as the norm in many clades (e.g., Peterson et al. Reference Peterson, Soberón and Sanchez-Cordero1999; Graham et al. Reference Graham, Ron, Santos, Schneider and Moritz2004; Pearman et al. Reference Pearman, Guisan, Broennimann and Randin2008; Weins et al. Reference Wiens, Ackerly, Allen, Anacker, Buckley, Cornell, Damschen, Davies, Grytnes, Harrison, Hawkins, Holt, McCain and Stephens2010; Peterson Reference Peterson2011; although see Losos Reference Losos2008 for an alternative view).
ENMs are becoming more widespread in analyses of the Quaternary fossil record (e.g., Martínez-Meyer et al. Reference Martínez-Meyer, Peterson and Hargrove2004; Waltari et al. Reference Waltari, Hijmans, Peterson, Nyári, Perkins and Guralnick2007; Nogués-Bravo et al. Reference Nogués-Bravo, Rodriguez, Hortal, Batra and Araújo2008; Waltari and Guralnick Reference Waltari and Guralnick2009; Varela et al. Reference Varela, Lobo, Rodríguez and Batra2010; Polly and Eronen Reference Polly and Eronen2011; Waltari and Hickerson Reference Waltari and Hickerson2012; Rödder et al. Reference Rödder, Lawing, Flecks, Ahmadzadeh, Dambach, Engler, Habel, Hartmann, Hörnes, Ihlow, Schidelko, Stiels and Polly2013); nevertheless, to date, usage in deep time has been limited. In principle, the application of ENM to deep time (hence PaleoENM) is not substantially different from applications in the modern or recent fossil record. Species occurrence data are comparable among these different applications and the modeling algorithms utilized work well under both sampling regimes. PaleoENM does differ, however, from more modern applications in the process of acquiring environmental layers across the study area.
For modern analyses, spatially explicit global environmental layers (e.g., temperature, precipitation) can be downloaded at a variety of spatial scales from publicly available online databases (e.g., WorldClim). Increasingly, climate models that reach into the past have also made environmental layers available for parts of the Quaternary period (e.g., Petit et al. Reference Petit, Jouzel, Raynaud, Barkov, Bamola, Basile, Bender, Chappellaz, Davis, Delaygue, Delmotte, Kotylakov, Legrand, Lipenkov, Lorius, Pepin, Ritz, Saltzman and Stiennard1999; Braconnot et al. Reference Braconnot, Otto-Bliesner, Harrison, Joussaume, Peterchmitt, Abe-Ouchi, Crucifix, Driesschaert, Fichefet, Hewitt, Kageyama, Kitoh, Laîné, Loutre, Marti, Merkel, Ramstein, Valdes, Weber, Yu and Zhao2007; Haywood et al. Reference Haywood, Dowsett, Robinson, Stoll, Dolan, Lunt, Otto-Bliesner and Chandler2011). However, these layers are not available for intervals in deep time. Thus, in order to use ENM techniques to quantify niche characteristics, deep-time paleobiologists must construct their own environmental layers by using information from sedimentological and geochemical analyses. Although this currently may be more time consuming than a simple download from an online database, it mainly reflects the early stage of PaleoENM development and application. Available environmental information from online databases spanning the Quaternary to recent demonstrates the time already spent compiling large global data sets and climate models for these time periods. Such compilations are important for analyses in deep time as well, and are expected to increase in availability as data digitization efforts (e.g., EarthCube) and PaleoENM studies become more widespread.
Notably, the fossil record has the distinct advantage of preserving species in the environments in which they lived throughout their evolutionary history. In other words, the fossil record preserves a time series of shifting environments and their concomitant effects on species distributions. This provides unique insight compared to the modern record, where species are limited to the single temporal snapshot of the environments they occupy at present. Differences in the temporal scale and geographic resolution achievable in modern and paleoenvironmental datasets dictate that PaleoENM and ENM analyses will have methodological and theoretical differences in their development and interpretation. Both approaches have strengths and weaknesses; thus conceptual context is important for PaleoENM application, as is a standardized and quantitative framework for reconstructing past environments. Our goal in this contribution is to encourage and expand PaleoENM use in a broader range of paleobiological studies. Accordingly, we describe best practices for the application of PaleoENM with emphasis on methods for constructing paleoenvironmental layers for this type of research. We present an illustrative example for creating paleoenvironmental layers based on Late Cretaceous data. Additional examples discuss PaleoENM analyses in the Ordovician of the Cincinnati Basin, the Devonian of the Appalachian Basin, and the Miocene of the Great Plains.
ENM: Basic Theory and Methods
Conceptual Framework
Over the last decade, ENM has enjoyed increasing popularity in a number of disciplines and research groups. In part, this reflects the user-friendly nature of many modeling algorithms (e.g., Maxent). However, it is vital that ENMs be applied using an explicit conceptual framework and consideration of species-specific characteristics (Austin Reference Austin2002, Reference Austin2007; Guisan and Thuiller Reference Guisan and Thuiller2005; Jiménez-Valverde et al. Reference Jiménez-Valverde, Lobo and Hortal2008; Peterson et al. Reference Peterson, Soberón, Pearson, Anderson, Martínez-Meyer, Nakamura and Araújo2011; Araújo and Peterson Reference Araújo and Peterson2012). Species’ geographic distributions are controlled by three main factors: abiotic conditions necessary for the species’ survival and reproduction, necessary and non-exclusive biotic interactions, and the ability to access suitable areas (Soberón and Peterson Reference Soberón and Peterson2005; Peterson et al. Reference Peterson, Soberón, Pearson, Anderson, Martínez-Meyer, Nakamura and Araújo2011). Together, these factors make up the Biotic-Abiotic-Movement, or BAM, framework of Peterson et al. (Reference Peterson, Soberón, Pearson, Anderson, Martínez-Meyer, Nakamura and Araújo2011; see also Soberón and Peterson Reference Soberón and Peterson2005; Barve et al. Reference Barve, Barve, Jiménez-Valverde, Lira-Noriega, Maher, Peterson, Soberón and Villalobos2011; Saupe et al. Reference Saupe, Barve, Myers, Soberón, Hensz, Peterson, Owens and Lira-Noriega2012) (Fig. 1). Within this framework, ENM is a multivariate correlative approach for estimating A, species’ abiotic requirements. That is, by comparing species occurrences with the combinations of environmental factors experienced at each location in environmental space (vs. geographic space), these models move beyond a simple mapping of distributions on environment to provide a set of rules predicting the environmental combinations that are suitable vs. unsuitable for a given species. To the degree that species are able to occupy all suitable abiotic habitat (i.e., are not B- or M-limited), and that the breadth of sampled habitats reflects the full range of a species’ environmental tolerances, ENM provides a prediction of the fundamental niche (sensu Grinnell 1917). In reality, the effect of biotic interactions, historical accessibility, and historical environmental availability are often unknown. Thus, ENM predictions can most fruitfully be interpreted as providing a prediction somewhat broader than the realized niche, but not necessarily comprising the entire fundamental niche.
A, Biotic-Abiotic-Movement (BAM) diagram illustrating three factors influencing species distributions (modified from Soberón and Peterson Reference Soberón and Peterson2005). B (biotic) represents necessary and non-limiting biotic interactions; A (abiotic) represents necessary abiotic requirements; M (movement) represents accessible habitat. A is equivalent to a species’ fundamental niche, whereas the realized niche of a species is described by A $${\cap}$$
B. A species’ occupied niche is the intersection of all three factors, i.e., suitable abiotic and biotic habitat that is also accessible. B, Two-component environmental space (E1 vs. E2) showing η(G), the environmental combinations existing in geography (black dots), species occurrences (dark gray dots, red in color version), and η(M) the hypothesized environmental combinations that are accessible to the species (light gray dots and circle, orange in color version).
$${\cap}$$
B. A species’ occupied niche is the intersection of all three factors, i.e., suitable abiotic and biotic habitat that is also accessible. B, Two-component environmental space (E1 vs. E2) showing η(G), the environmental combinations existing in geography (black dots), species occurrences (dark gray dots, red in color version), and η(M) the hypothesized environmental combinations that are accessible to the species (light gray dots and circle, orange in color version).

Statistical Approaches to ENM
ENM may be implemented using a variety of modeling algorithms (see Guisan and Zimmerman Reference Guisan and Zimmerman2000; Guisan and Thuiller Reference Guisan and Thuiller2005; Elith and Leathwick Reference Elith and Leathwick2009; Peterson et al. Reference Peterson, Soberón, Pearson, Anderson, Martínez-Meyer, Nakamura and Araújo2011). The result of most algorithms is a geographically explicit suitability surface that predicts where abiotic conditions are suitable vs. unsuitable for a given species. This is achieved by fitting mathematical functions to the multivariate relationship between occurrence data and environmental factors (Elith and Leathwick Reference Elith and Leathwick2009; Peterson et al. Reference Peterson, Soberón, Pearson, Anderson, Martínez-Meyer, Nakamura and Araújo2011). Models are trained in a region containing all known species occurrences plus some additional area that is inferred to be accessible, but probably unsuitable, to the species (the M region in Fig. 1) (Soberón and Peterson Reference Soberón and Peterson2005; Barve et al. Reference Barve, Barve, Jiménez-Valverde, Lira-Noriega, Maher, Peterson, Soberón and Villalobos2011; Peterson et al. Reference Peterson, Soberón, Pearson, Anderson, Martínez-Meyer, Nakamura and Araújo2011). Once the algorithm establishes a suitability rule-set for this training region, the model can be projected to a new geographic area and/or to another period of time (e.g., Fig. 2). The product of this projection is a new geographic map composed of suitability scores for a given species in the new region or time. These results can then be used to test hypotheses of observed distribution changes, extinction, speciation, or environmental adaptation.
Example PaleoENM analysis for the Late Ordovician crinoid Ectenocrinus simplex, an immobile shallow marine filter feeder from the Cincinnati Basin. A, Distribution of occurrence data, outcrop area, and model extent. Environmental data were collected on a 15′ grid, primarily from fieldwork. B, Interpolated layer for the environmental factor limestone bedding style. C, Interpolated environmental layer for percent mudstone. D, Habitat suitability map produced from Maxent analysis; suitability ranges from low (0.0) to high (1.0). E, Suitability map produced by summing 100 best-subset models from GARP; suitability range indicates the number of best models predicting presence at each location. Modified from Brame and Stigall (Reference Brame and Stigall2014).
Many research groups have tested the performance of the different ENM algorithms under different environmental conditions with mixed recommendations (e.g., Hirzel et al. Reference Hirzel, Helfer and Metral2001; Elith et al. Reference Elith, Graham, Anderson, Dudík, Ferrier, Guisan, Hijmans, Huettmann, Leathwick, Lehmann, Li, Lohmann, Loiselle, Manion, Moritz, Nakamura, Nakazawa, Overton, Peterson, Phillips, Richardson, Scachetti-Pereira, Schapire, Soberón, Williams, Wisz and Zimmermann2006; Austin Reference Austin2007; Elith and Graham Reference Elith and Graham2009; Saupe et al. Reference Saupe, Barve, Myers, Soberón, Hensz, Peterson, Owens and Lira-Noriega2012). What is pertinent to PaleoENM is choosing a modeling algorithm that works well with “presence-only” data—that is, an algorithm that requires information about known presences, but not about known absences, of the species. Identifying true species absences is challenging in the modern biological record and next to impossible in the fossil record because of issues of sampling bias, fossil preservation, or availability of geologic outcrop (Hortal et al. Reference Hortal, Jiménez-Valverde, Gomez, Lobo and Baselga2008; Jiménez-Valverde et al. Reference Jiménez-Valverde, Lobo and Hortal2008, Reference Jiménez-Valverde, Peterson, Soberón, Overton, Aragón and Lobo2011a; Maguire and Stigall Reference Maguire and Stigall2008; Myers and Lieberman Reference Myers and Lieberman2011; Peterson et al. Reference Peterson, Soberón, Pearson, Anderson, Martínez-Meyer, Nakamura and Araújo2011; Martin et al. Reference Martin, Blossey and Ellis2012). Two presence-only algorithms recommended for PaleoENM use are Maxent (a maximum entropy algorithm [Phillips et al. Reference Phillips, Dudik and Schapire2004, Reference Phillips, Anderson and Schapire2006]) and GARP (genetic algorithm for rule-set prediction [Stockwell and Peters Reference Stockwell and Peters1999]). Both Maxent and GARP appear to function well under many modern scenarios, and are ideally formulated to work with fossil data because they deal well with non-uniform and small sample sizes (Peterson Reference Peterson2001; Stigall Rode and Lieberman Reference Stigall Rode and Lieberman2005a; Hernandez et al. Reference Hernandez, Graham, Master and Albert2006; Guisan et al. Reference Guisan, Zimmermann, Elith, Graham, Phillips and Peterson2007; Pearson et al. Reference Pearson, Raxworthy, Nakamura and Peterson2007; Jiménez-Valverde et al. Reference Jiménez-Valverde, Lobo and Hortal2008; Peterson et al. Reference Peterson, Soberón, Pearson, Anderson, Martínez-Meyer, Nakamura and Araújo2011). Moreover, ground-truth studies and comparative analyses of deep-time datasets show that both algorithms achieve high predictive accuracy in PaleoENM studies (Malizia and Stigall Reference Malizia and Stigall2011; Walls and Stigall Reference Walls and Stigall2012). A more detailed discussion of available ENM algorithms, including Maxent and GARP, is provided in the supplemental text.
Model Calibration and Evaluation
Model calibration involves selecting appropriate environmental layers and adjusting data and algorithm parameters such that model predictions best match observed species occurrences (Guisan and Zimmerman Reference Guisan and Zimmerman2000; Peterson et al. Reference Peterson, Soberón, Pearson, Anderson, Martínez-Meyer, Nakamura and Araújo2011). Once an ENM is calibrated and run, the resulting output is a spatially explicit set of predictions. For Maxent, each pixel value in this surface indicates probability of environmental suitability; for GARP, each pixel registers the sum of “best” models predicting species presence, when employing the “best subsets” procedure (Anderson et al. Reference Anderson, Lew and Peterson2003). Evaluation of model predictions involves decisions about thresholds, and assessment of both model performance and model significance. Model performance measures omission and commission error rates; model significance measures whether evaluation data are predicted to be present more often than by random chance (Peterson et al. Reference Peterson, Soberón, Pearson, Anderson, Martínez-Meyer, Nakamura and Araújo2011). An in-depth discussion of model calibration and evaluation for general ENM use is provided in the supplemental text. The reconstruction of environmental layers for PaleoENM is discussed in detail in the PaleoENM Methods in Deep Time section below. Here, we provide a brief discussion of model extent and extrapolation to highlight important conceptual and methodological considerations specific to PaleoENM users.
Model Extent
Several recent studies have noted the importance of delineating an appropriately sized region within which to train niche models (e.g., Guisan and Thuiller Reference Guisan and Thuiller2005; Barve et al. Reference Barve, Barve, Jiménez-Valverde, Lira-Noriega, Maher, Peterson, Soberón and Villalobos2011; Peterson et al. Reference Peterson, Soberón, Pearson, Anderson, Martínez-Meyer, Nakamura and Araújo2011; Saupe et al. Reference Saupe, Barve, Myers, Soberón, Hensz, Peterson, Owens and Lira-Noriega2012; Owens et al. Reference Owens, Campbell, Dornak, Saupe, Barve, Soberón, Ingenloff, Lira-Noriega, Hensz, Myers and Peterson2013). ENM algorithms use the training region (M in Fig. 1) (Soberón and Peterson Reference Soberón and Peterson2005; Barve et al. Reference Barve, Barve, Jiménez-Valverde, Lira-Noriega, Maher, Peterson, Soberón and Villalobos2011; Peterson et al. Reference Peterson, Soberón, Pearson, Anderson, Martínez-Meyer, Nakamura and Araújo2011) to sample environments both with and without species occurrences in order to determine suitable vs. unsuitable environmental combinations. Thus, M is the region that could feasibly be sampled (or reached) by a given species and is delimited using information about species’ dispersal capabilities and the distribution of geographic barriers (Fig. 1B). That is, a species that can disperse widely (and sample a large number of habitats) should have a larger hypothesized M (and model training region) than a species with more limited movement capacity. The size of M is important because overestimation leads models to speciously predict potentially habitable, but inaccessible, areas as unsuitable. Likewise, underestimation of M prevents models from having enough information to estimate suitability and may lead to model extrapolation (discussed further below and in Barve et al. Reference Barve, Barve, Jiménez-Valverde, Lira-Noriega, Maher, Peterson, Soberón and Villalobos2011; Saupe et al. Reference Saupe, Barve, Myers, Soberón, Hensz, Peterson, Owens and Lira-Noriega2012). An important consideration for PaleoENM application is the geographic availability of sedimentary record. Model extent must be limited to available outcrop area as this constrains where environments and occurrence data are sampled (Fig. 2). Extending models to areas beyond available outcrop is dangerous because environmental interpolations will be heavily extrapolated, and the lack of species occurrences from these areas will cause algorithms to treat those environmental combinations as unsuitable when this is unknown.
Model Extrapolation
Extrapolation occurs when the ENM algorithm encounters novel environmental conditions not present in the training data as a result of transferring model predictions beyond the training region in space or time (e.g., black dots in Fig. 1B). The Maxent algorithm allows users to modify the process of model extrapolation in three basic ways: Maxent may “clamp” the model, whereby environments beyond those in the training region are given the same suitability value as the closest training-region pixel in environmental space. Alternatively, Maxent may be allowed to extrapolate under these conditions, whereby suitability scores are assigned based on a continuation of the fitted species response curve (Elith et al. Reference Elith, Phillips, Hastie, Dudik, Chee and Yates2011; Peterson et al. Reference Peterson, Soberón, Pearson, Anderson, Martínez-Meyer, Nakamura and Araújo2011; Owens et al. Reference Owens, Campbell, Dornak, Saupe, Barve, Soberón, Ingenloff, Lira-Noriega, Hensz, Myers and Peterson2013). Finally, both clamping and extrapolation can be turned off, resulting in Maxent giving a low suitability score to all conditions outside of the training region. Allowing models to clamp or extrapolate has a significant effect on model output, as does artificially truncating model predictions outside of the environments experienced in the training region by turning clamping and extrapolation off. The GARP algorithm is also subject to model extrapolation (Owens et al. Reference Owens, Campbell, Dornak, Saupe, Barve, Soberón, Ingenloff, Lira-Noriega, Hensz, Myers and Peterson2013). Methods exist to explore these effects, e.g., MOP (Owens et al. Reference Owens, Campbell, Dornak, Saupe, Barve, Soberón, Ingenloff, Lira-Noriega, Hensz, Myers and Peterson2013), MESS (Elith et al. Reference Elith, Kearney and Phillips2010), and environmental overlap maps (Zurell et al. Reference Zurell, Elith and Schröder2012), which should be part of any ENM/PaleoENM interpretation. Importantly, extrapolation is reduced when species occurrence points are centrally (vs. peripherally) located within the environments defining M (e.g., red dots in Fig. 1B). This may be explored using the program Niche Analyst (Qiao et al. Reference Qiao, Soberón, Campbell and Peterson2012) or statistical evaluation, following which M hypotheses can be modified to reduce the potential for model extrapolation (Owens et al. Reference Owens, Campbell, Dornak, Saupe, Barve, Soberón, Ingenloff, Lira-Noriega, Hensz, Myers and Peterson2013). Extrapolation may also be reduced by filtering occurrence points to increase environmental “evenness” as discussed by Varela et al. (Reference Varela, Anderson, García-Valdés and Fernández-González2014).
PaleoENM: Methods in Deep Time
Species Occurrence Data
Before conducting PaleoENM or ENM, species distribution data need to be assembled. Species occurrences are collected in a similar fashion (and with the same set of potential biases) in both the modern and fossil records. For example, occurrence data are increasingly collected from large online databases (e.g., GBIF [www.gbif.org] in the modern or the PBDB [www.pbdb.org] in the fossil record). However, direct observations—from fieldwork or museum study—and literature surveys are more effective because they allow for hands-on vetting of the data. The greater the time spent validating species assignments and distributions, the more confidence one can have that modeled results are accurate. Where possible, occurrences should be identified to the species level and localities identified to the most precise geographic and stratigraphic context from the specimen label or database. (Guisan and Thuiller Reference Guisan and Thuiller2005; Peterson et al. Reference Peterson, Soberón, Pearson, Anderson, Martínez-Meyer, Nakamura and Araújo2011). It will then be possible to compare the level of resolution with that of paleoenvironmental data and to remove specimen occurrences that are not of similar resolution. The remaining species occurrence data must then be geo-referenced (i.e., locality information translated into latitude and longitude) at a geographic resolution that approximately matches the resolution of paleoenvironmental data, and formatted for ArcGIS (ESRI 2006) and ENM software.
In order to minimize model bias, species occurrence data should include samples distributed across the entire known species range (Araújo et al. Reference Araújo, Thuiller and Yoccoz2009; Menke et al. Reference Menke, Holway, Fisher and Jetz2009; Jiménez-Valverde et al. Reference Jiménez-Valverde, Barve, Lira-Noriega, Maher, Kakazawa, Papes, Soberón, Sukumaran and Peterson2011b; Peterson et al. Reference Peterson, Soberón, Pearson, Anderson, Martínez-Meyer, Nakamura and Araújo2011). This is particularly important when the aim of modeling is to project environmental suitability rules to other geographic regions or times to test species-level hypotheses of niche characteristics. Application of ENM to specific populations is interesting; however, population-level data cannot accurately be used to build ENMs and then extrapolated to the species level (either by directly projecting population models more globally or by interpreting population-level results at the species level) (see Araújo et al. Reference Araújo, Thuiller and Yoccoz2009 and Jiménez-Valverde et al. Reference Jiménez-Valverde, Barve, Lira-Noriega, Maher, Kakazawa, Papes, Soberón, Sukumaran and Peterson2011b for commentary). This is because excluded occurrences truncate species occupation of environmental space, which introduces errors in model results that are unpredictable and algorithm specific (Guisan and Thuiller Reference Guisan and Thuiller2005; Hortal et al. Reference Hortal, Jiménez-Valverde, Gomez, Lobo and Baselga2008; Barve et al. Reference Barve, Barve, Jiménez-Valverde, Lira-Noriega, Maher, Peterson, Soberón and Villalobos2011; Jiménez-Valverde et al. Reference Jiménez-Valverde, Barve, Lira-Noriega, Maher, Kakazawa, Papes, Soberón, Sukumaran and Peterson2011b; Araújo and Peterson Reference Araújo and Peterson2012; Raes Reference Raes2012; Saupe et al. Reference Saupe, Barve, Myers, Soberón, Hensz, Peterson, Owens and Lira-Noriega2012; Owens et al. Reference Owens, Campbell, Dornak, Saupe, Barve, Soberón, Ingenloff, Lira-Noriega, Hensz, Myers and Peterson2013).
The step unique to PaleoENM analysis is determining the stratigraphic interval in which the specimens occur. To generate accurate models, species and environmental data should be contemporaneous at the temporal resolution with which the study is conducted. Temporal resolution will be strongly influenced by the resolution of available taxonomic data and by the resolution best fitting the hypotheses being tested. For example, PaleoENMs of a species that persisted for five million years may perform well with temporal bins in the 1–2 Myr range, whereas investigation of population dynamics requires a smaller bin size. When possible, models should be run at multiple temporal bin sizes, which will help establish the most appropriate resolution for a given study system. One can check model sensitivity to temporal bin size by running multiple models that bin species occurrences (and average environmental conditions) at successively larger stratigraphic intervals. As temporal resolution decreases, the ability of the PaleoENM to discern differences in habitat preferences will also decrease, eventually to the point of being uninformative. Similarly, as temporal resolution is increased, the amount and quality of data required to develop informative models will decrease. Thus, eventually an upper resolution limit will be reached where PaleoENMs cannot be run due to an insufficient number of occurrence points or lack of confidence in down-sampled environmental information.
Paleoenvironmental Data
In the most basic sense, environmental layers are universally constructed by assigning environmental characteristics to unique geographic points from field observations and literature survey. Generally, interpolation is required to construct continuous environmental layers from these point-source measurements. For example, in the fossil record GIS algorithms such as ordinary kriging or inverse distance weighting are used to interpolate between points and create a continuous coverage of values for each environmental factor across the area of interest (e.g., Stigall Rode and Lieberman Reference Stigall Rode and Lieberman2005a; Maguire and Stigall Reference Maguire and Stigall2009; Dudei and Stigall Reference Dudei and Stigall2010). Spatially explicit environmental layers are more readily available in the modern and recent past, to the extent that climate models exist. By contrast, such layers must be reconstructed from the sedimentary record in deep time. Certain environmental information (e.g., temperature, precipitation) is not directly measurable in the geologic record; thus, environmental layers are constructed by using sedimentological and geochemical proxies for environmental factors that are considered important for delimiting habitable areas of the focal taxa. These data sources are well archived and available in the literature and online databases (e.g., http://macrostrat.org; www.earthbase.org). When developing environmental layers for PaleoENM (or ENM), the type and number of layers, the relationships between environmental variables, and the spatial resolution of environmental interpolation are important considerations; these concepts are considered in detail in the supplemental text. Here we briefly discuss environmental layer selection as it affects PaleoENM directly, then provide an example of paleoenvironmental layer construction from the Late Cretaceous Western Interior Seaway (WIS) to illustrate this procedure.
Selecting Paleoenvironmental Layers
Before beginning to collect paleoenvironmental data, it is important to establish what environmental layers will be used in the analysis. The types of layers used will depend on the scale of the study, the specific ecology of the species under investigation, and the types of data available (Austin Reference Austin2002, Reference Austin2007; Guisan and Thuiller Reference Guisan and Thuiller2005; Elith and Leathwick Reference Elith and Leathwick2009; Peterson et al. Reference Peterson, Soberón, Pearson, Anderson, Martínez-Meyer, Nakamura and Araújo2011; Araújo and Peterson Reference Araújo and Peterson2012). For example, in a regional study of benthic marine taxa with presence-only data, abiotic information about substrate conditions, bottom-water oxygenation, water depth, or wave energy will likely be informative for predicting species’ environmental requirements (Brenchley and Harper Reference Brenchley and Harper1998; Stigall Rode and Lieberman Reference Stigall Rode and Lieberman2005a; Dudei and Stigall Reference Dudei and Stigall2010; Malizia and Stigall Reference Malizia and Stigall2011; Walls and Stigall Reference Walls and Stigall2011; Patzkowsky and Holland Reference Patzkowsky and Holland2012). On the other hand, local surface-water conditions (e.g., sea-surface temperature or salinity) may be less informative, both because this variable may not be important at the regional level, and because surface conditions may be less significant for benthic taxa (Brenchley and Harper Reference Brenchley and Harper1998; Pearson and Dawson Reference Pearson and Dawson2003, Reference Pearson and Dawson2004; Soberón Reference Soberón2007).
When choosing environmental layers, direct variables are best. Direct variables have an unequivocal physiological influence on habitat suitability for a given species. In the marine realm, direct variables include factors such as temperature, salinity, oxygenation, or pH. Indirect variables, on the other hand, do not have explicit physiological influence and only affect habitat suitability in that they correlate with one or more direct variables (Austin Reference Austin2002, Reference Austin2007; Guisan and Thuiller Reference Guisan and Thuiller2005; Elith and Leathwick Reference Elith and Leathwick2009; Franklin Reference Franklin2009; Jiménez-Valverde et al. Reference Jiménez-Valverde, Peterson, Soberón, Overton, Aragón and Lobo2011a; Peterson et al. Reference Peterson, Soberón, Pearson, Anderson, Martínez-Meyer, Nakamura and Araújo2011). Examples of indirect variables in the marine realm include bathymetry or latitude. Unfortunately, in the fossil record measurement of direct variables is typically impossible (and is often challenging in the modern as well). However, what can be measured are proxies for direct variables (e.g., geochemical proxies for temperature, oxygenation, pH; sedimentary proxies for wave energy, substrate consistency, grain size), which should be preferred over proxies for indirect variables. Further, when the intended purpose of the analysis is to test for the effects of abiotic change on species evolution, environmental layers should be purely abiotic. The use of biotic variables is inappropriate in these cases because they confound the ability to isolate the effect of abiotic factors and, to the degree that biotic variables may reflect abiotic conditions, they are primarily indirect proxies and so less desirable. The use of biotic variables may be informative for understanding biotic limitations to species occupation of suitable habitat; however, this should be tested independently of abiotic hypotheses. Additional detail on general ENM considerations regarding number of environmental layers used, spatial resolution, and variable correlation is provided in the supplemental text.
Example from the Late Cretaceous
To clarify the methods and theoretical constructs developed above (and in the supplemental text), we present a detailed example environmental dataset developed for Late Cretaceous strata from the WIS of North America. The first step is the establishment of temporal bins based on a detailed stratigraphic framework, which constrains both species occurrence and environmental information. In keeping with the resolution of WIS taxonomic data, temporal bin size was limited to the geologic stage level. The last large-scale stratigraphic correlation of WIS formations across North America was completed by Cobban and Reeside (Reference Cobban and Reeside1952). However, understanding of the WIS stratigraphic setting has advanced over the past decades, and thus we updated the stratigraphic correlation for this region at the geologic stage level (Supplementary Table 1 and associated references). Stratigraphic correlations were determined by extensive literature survey and the use of various geologic databases (e.g., USGS National Geologic Map Database [http://ngmbd.usgs.gov], Macrostrat [http://macrostrat.org], and COSUNA, Correlation of Stratigraphic Units of North America Project). Biostratigraphic indices were also used when available, following the Late Cretaceous zonation of Cobban et al. (Reference Cobban, Walaszczyk, Obradovich and McKinney2006).
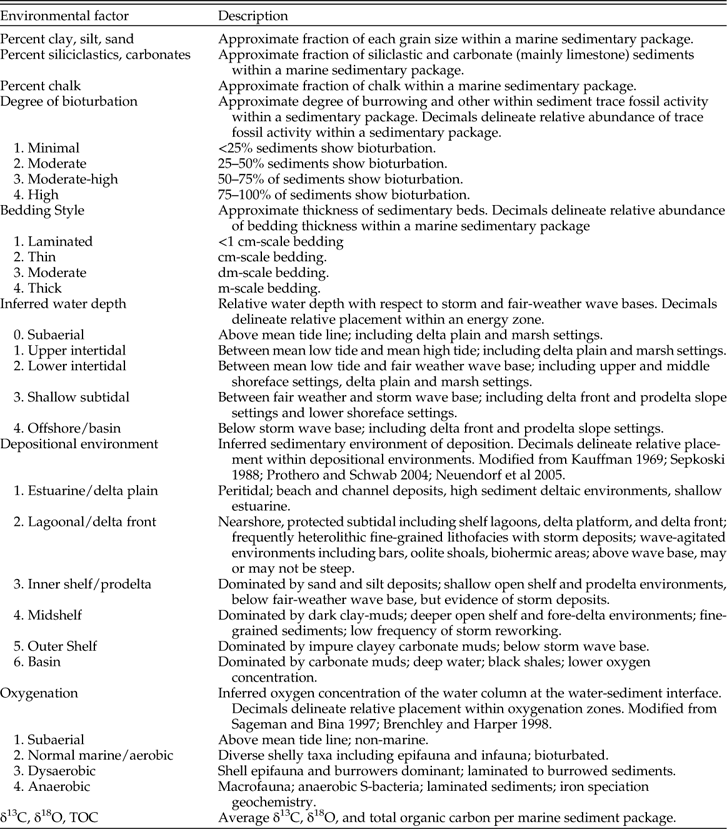
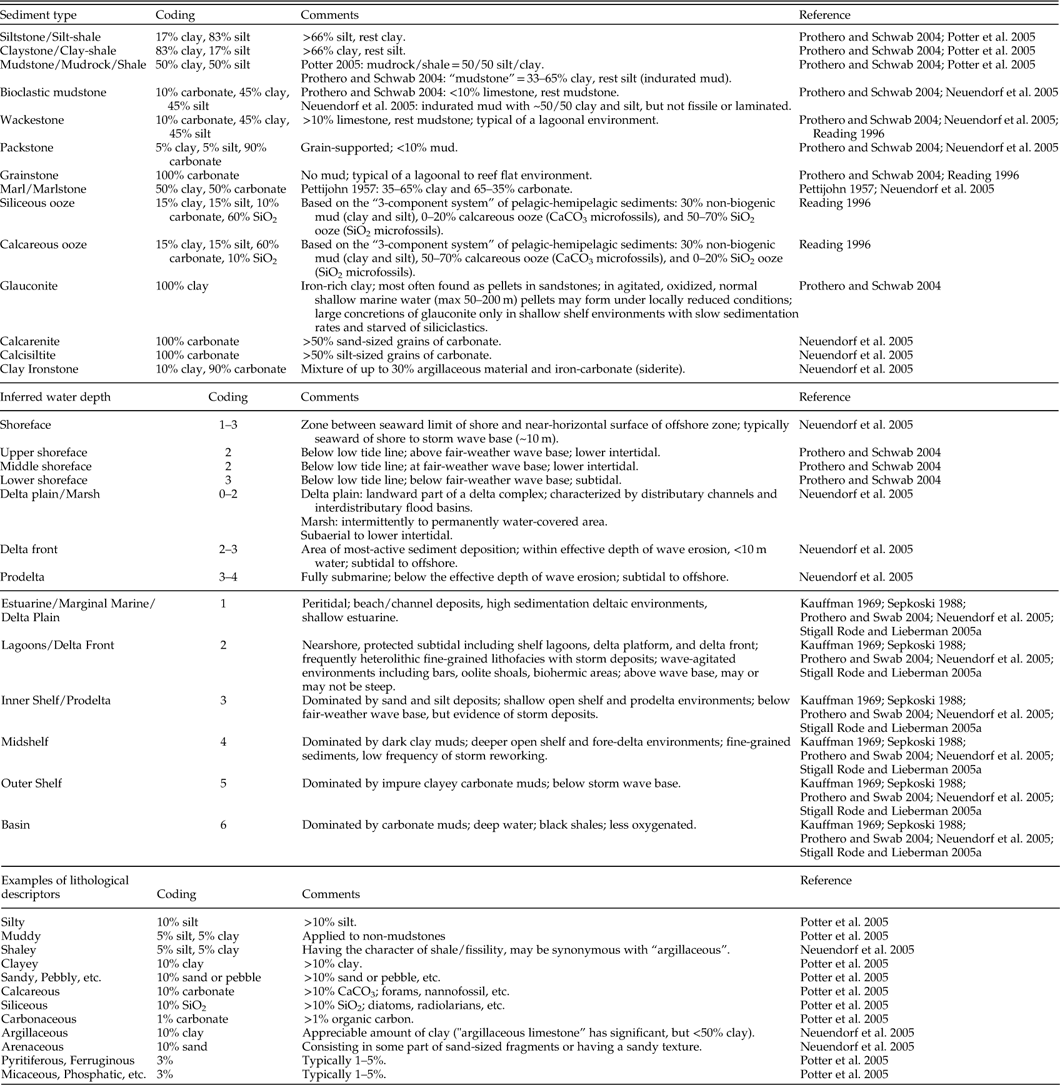
Paleoenvironmental data were collected for 14 layers within the Late Cretaceous WIS (Table 1). These include percent clay, silt, sand, and chalk; percent siliciclastic vs. carbonate sediments; bedding style; degree of bioturbation; inferred water depth; depositional environment; oxygenation; and total organic carbon (TOC), δ13C, and δ18O. The 14 environmental layers described here have been modified from those used in previous work (e.g., Stigall Rode and Lieberman Reference Stigall Rode and Lieberman2005a) to reflect the taxa, conditions, and specific hypotheses currently being investigated in the WIS. Paleoenvironmental data were collected primarily through literature survey including peer-reviewed articles, master’s theses, doctoral dissertations, and published fieldtrip guidebooks. Data gathered from new fieldwork were incorporated where possible. Because we used many independent references (e.g., Supplementary Table 1), which employed a variety of terminologies, it was important to develop a standardized scheme for paleoenvironmental variables that ensures consistency in coding. Table 2 provides an example of the coding rule-set used for the Late Cretaceous WIS and associated reference material.
Coding scheme used in reconstructing environmental layers for ENM analysis in the Late Cretaceous Western Interior Seaway. Several of the variables have been modified from Stigall Rode and Lieberman (Reference Stigall Rode and Lieberman2005a). Other references are provided where appropriate.
Coding rule-set used for evaluating paleoenvironmental information from literature survey based on PaleoENM development in the Late Cretaceous Western Interior Seaway of North America. See Table 1 for paleoenvironmental layer descriptions and numerical codes used in PaleoENM analyses.
Substrate conditions were characterized using environmental layers describing substrate grain size (i.e., percent clay, silt, sand), percent chalk, proportion of siliciclastic vs. carbonate sediment, degree of bioturbation, and bedding style. Grain size percentages and percent siliciclastic vs. carbonate sediments were calculated from stratigraphic columns as the approximate fraction of each grain size/lithology in a given column. Fossil specimens may be present in particular lithologies within a given section; however, averaging conditions across the full sedimentary package places these in the broader environmental context of the temporal resolution of environmental and species data (Abbott and Sweet Reference Abbott and Sweet2000). Figure 3 provides a sample stratigraphic column and measurement of these properties. In this example, the total vertical extent of each rock type is first calculated by direct measurement: the column is composed of 2.34 m of sandstone, 5.13 m of shale, 1.04 m of siltstone, and 1.64 m of calcareous shale. Using coding rules provided in Table 2, sandstone is coded as 100% sand, shale is composed of 50% silt and 50% clay, and siltstone is composed of 83% silt and 17% clay. Likewise, the “calcareous” modifier of the shale is coded as 10% carbonate. Following the calculations shown in Figure 3, the grain sizes of this section are coded as 23.1% sand, 41.0% silt, 34.3% clay; and the lithology as 98.4% siliciclastic and 1.6% carbonate.
Degree of bioturbation is a measure of the percentage of beds showing signs of burrowing or other trace fossil activity in a sediment package. This layer is a proxy for general environmental habitability of benthic environments, including such factors as oxygenation, current intensity, depth, seafloor hardness, and rate of sedimentation (Droser and Bottjer Reference Droser and Bottjer1993; Brenchley and Harper Reference Brenchley and Harper1998). Bedding style was calculated as the abundance-weighted average thickness of the beds in a sediment package. Beds may range from laminated (thickness <1 cm) to meter-scale, which describes the amount of sediment input into the marine habitat. Thus, bedding style provides information about turbidity and energy level of the environment (Reading Reference Reading1996; Prothero and Schwab Reference Prothero and Schwab2004). Information about bioturbation and bedding style may be estimated directly from stratigraphic columns or found in the lithostratigraphic discussion provided in the accompanying text. In the example provided in Figure 3, two units contain evidence of bioturbation. The sum of these units is 1.14 m, which constitutes 11.2% of the section and the coded value for this location. Coding for bedding style is calculated as described for grain sizes above.
As discussed in Stigall Rode and Lieberman (Reference Stigall Rode and Lieberman2005a), the variable “inferred water depth” is a measure of water depth relative to tides, storm-, and fair-weather wave bases. This variable relates to oxygenation in addition to wave energy in a given marine environment (Boucot Reference Boucot1981; Brenchley and Harper Reference Brenchley and Harper1998; Patzkowsky and Holland Reference Patzkowsky and Holland2012). “Depositional environment” is related to distance from the shoreline and relative water depth. Characterization of depositional environments is modified from Stigall Rode and Lieberman (Reference Stigall Rode and Lieberman2005a) in conjunction with the methods of other authors (Kauffman Reference Kauffman1969; Sepkoski Reference Sepkoski1988; Prothero and Schwab Reference Prothero and Schwab2004; Neuendorf et al. Reference Neuendorf, Mehl and Jackson2005). These variables are calculated as abundance-weighted averages within a given sediment package (Table 2 and example in Fig. 3).
As an example from the literature, Owen et al. (Reference Owen, Forgas, Miller, Stelly and Owen2005: pp. 222–224) provided the following lithostratigraphic descriptions of members of the Dakota Sandstone in the Chama Basin of New Mexico:
“The Encinal Canyon of the Chama Basin is far enough east to show abundant evidence of deposition in a marginal-marine environment, perhaps in somewhat protected estuaries, bays, and tidal flats along the western shoreline of the Western Interior seaway during early Cenomanian time…. The Oak Canyon was deposited in an offshore marine environment…. Both Cubero parasequences were deposited as shoreface marine sands, mostly in the middle shoreface zone, but outer shoreface silty sand is more prominent in the lower parasequence. The middle shaley zone was deposited in the adjacent offshore muddy environment…. The Paguate was deposited in a middle and outer shoreface environment that was well populated with burrowing organisms.”
From this information, the depositional environment of the Encinal Canyon Member is estuarine or tidal flats, which, following the coding rules provided in Tables 1 and 2, is coded as 1. The Oak Canyon Member depositional environment is offshore marine. This description is less specific, and so is coded as 3–5 to include the potential contribution of all three offshore shelf marine depositional environments (i.e., inner shelf, mid-shelf, and outer-shelf environments). The Cubero Sandstone Tongue and Paguate Sandstone Tongue represent middle to outer shoreface environments, coded as 3’s. According to the stratigraphic column provided in the text, the Encinal Member makes up 12% of the section, the Oak Canyon Member makes up 15.5%, the Cubero Sandstone Tongue is 50.7%, and the Paguate Sandstone Tongue is 21.8%. Thus, the depositional environment for this sedimentary package is coded as: 1*0.12+3*0.052+ 4*0.052+5*0.052+3* 0.507+3*0.218=2.92. Inferred water depth would be coded in the same fashion.
The environmental layer “oxygenation” describes the relative oxygen content at the sediment-water interface (modified from Sageman and Binna Reference Sageman and Binna1997; Brenchley and Harper Reference Brenchley and Harper1998; Stigall Rode and Lieberman Reference Stigall Rode and Lieberman2005a). This variable is also an abundance-weighted average of a sediment package based on detailed reading of literature sources and/or direct field observation. Bioturbation and oxygenation, as well as depositional environment and inferred water depth, have the potential to be correlated. Generally, it is more prudent to remove correlated variables from the analysis. However, if this is not possible (e.g., there are too few environmental layers to remove any) a PCA could be used to produce new environmental layers composed of principal components (for more on variable autocorrelation see the supplemental text; Guisan and Zimmerman Reference Guisan and Zimmerman2000; Guisan and Thuiller Reference Guisan and Thuiller2005; Peterson et al. Reference Peterson, Soberón, Pearson, Anderson, Martínez-Meyer, Nakamura and Araújo2011).
Finally, geochemical proxies such as TOC, δ13C, δ18O may be measured from field samples and/or data provided in the literature. These techniques and their relationships to specific environmental parameters are evolving: TOC may be a proxy for nutrients, oxygenation, and sedimentation rate, whereas δ13C and δ18O are potential proxies for water temperature and salinity under certain conditions (e.g., lack of diagenetic alteration and when analyzed using clumped isotope methods) (Boucot Reference Boucot1981; Johnson Ibach Reference Johnson Ibach1982; Creaney and Passey Reference Creaney and Passey1993; Fürsich Reference Fürsich1993; Brenchley and Harper Reference Brenchley and Harper1998; Tyson Reference Tyson2001). Currently, sedimentological variables may provide more robust estimates of past environmental conditions; however, as methods and data sampling improve (e.g., clumped isotope studies: Eiler Reference Eiler2011; Dennis et al. Reference Dennis, Cochran, Landman and Schrag2013), increasingly refined geochemical proxies are likely to become useful tools for estimating important direct variables such as temperature, pH, and oxygenation.
Applications of PaleoENM
Once species occurrence data have been collected and stratigraphic correlations and paleoenvironmental layers have been reconstructed, a wealth of hypotheses can be tested with ENM to better understand the relationships among ecology, evolution, and the environment. Of particular interest are the effects of changing environments on abiotic niche stability within species, the influence of niche breadth on extinction and speciation rates among species, and the prevalence of phylogenetic niche conservation and its evolutionary consequences. Understanding the accuracy and generality of niche stability, breadth, and conservation under periods of environmental change is significant because these properties limit the geographic expansion of species, which mediates allopatric speciation, extinction resistance, patterns of species richness, community structure, and the spread of invasive species (e.g., Kammer et al. Reference Kammer, Baumiller and Ausich1997; Peterson Reference Peterson2003; Peterson et al. Reference Peterson, Tian, Martínez-Meyer, Soberón, Sánchez-Cordero and Huntley2005; Wiens and Graham Reference Wiens and Graham2005; Araújo and Rahbek Reference Araújo and Rahbek2006; Kozak and Wiens Reference Kozak and Wiens2006, Reference Kozak and Wiens2010; Rangel et al. Reference Rangel, Diniz-Filho and Colwell2007; Tingley et al. Reference Tingley, Monahan, Beissinger and Moritz2009; Wiens et al. Reference Wiens, Ackerly, Allen, Anacker, Buckley, Cornell, Damschen, Davies, Grytnes, Harrison, Hawkins, Holt, McCain and Stephens2010; Heim and Peters Reference Heim and Peters2011; Stigall Reference Stigall2012a; Myers and Saupe Reference Myers and Saupe2013; Saupe et al. 2014). Thus far, PaleoENM techniques have been applied to studies of Paleozoic marine invertebrates and Neogene terrestrial vertebrates. We briefly describe some of these studies to highlight the types of macroevolutionary hypotheses that can be tested with this approach.
Survivorship across the Late Devonian Biodiversity Crisis
PaleoENM techniques were first applied to the deep-time fossil record by Stigall Rode and Lieberman (Reference Stigall Rode and Lieberman2005a), who used PaleoENM methods to assess controls on survivorship of 32 brachiopod and bivalve species in three conodont zones just before and across the Frasnian/Famennian Biodiversity Crisis. Occurrences, stratigraphic correlation, and paleoenvironmental data were collected through a combination of fieldwork, analysis of museum collections, and literature survey; PaleoENMs were developed using the GARP algorithm. Eleven paleoenvironmental layers were constructed with 0.5° grid cell spatial resolution. PaleoENMs were trained within the extent of the Northern Appalachian Basin in eastern North America. This study determined that species with larger areas of predicted suitable habitat were more likely to survive the Devonian Biodiversity Crisis, and that surviving species experienced increases in suitable habitat across the extinction interval. A following investigation considered the importance invasive species played in mediating this biodiversity crisis (Stigall and Lieberman Reference Stigall and Lieberman2006). These results provide support and a potential causal mechanism (i.e., large area of suitable environment) for the many previous studies finding a correlation between range area and species longevity (e.g., Kammer et al Reference Kammer, Baumiller and Ausich1997; Liow Reference Liow2007; Stigall Reference Stigall2012b).
Niche Stability in the Ordovician
A series of analyses in the Late Ordovician have addressed the question of niche stability in a variety of marine invertebrates from the Cincinnati Basin (Fig. 2 provides an example of environmental layer generation and modeling of crinoid Ectenocrinus simplex). Malizia and Stigall (Reference Malizia and Stigall2011) investigated responses of brachiopod species to cyclical sea-level rise and fall across nine time intervals spanning three million years. Occurrences, stratigraphic correlation, and paleoenvironmental data were collected through a combination of fieldwork, analysis of museum collections, and literature survey with a spatial resolution of 15′ grid cells; PaleoENMs were developed using both the GARP and Maxent algorithms. PaleoENMs were trained within the extent of the Cincinnati Basin, covering portions of Indiana, Kentucky, and Ohio, and projected forward in time to facilitate environmental comparisons across species durations. Niche stability was assessed by using percent geographic overlap of niches reconstructed in one time and projected to the subsequent interval, as well as through direct comparison of environmental characteristics using the Schoener’s D statistic in ENMTools (Warren et al. Reference Warren, Glor and Turelli2008, Reference Warren, Glor and Turelli2010). This study found that under conditions of gradual environmental change (here cyclical sea-level change), species tracked preferred habitat through the study region, demonstrating niche stability through time. However, when environmental change was coupled with biotic pressure during the Richmondian Invasion, species became more likely to demonstrate changes in niche dimensions (primarily contraction of occupied environmental space). These results were recently expanded to 11 genera of marine invertebrates (adding bryozoans, trilobites, crinoids, anthozoans, bivalves, and gastropods), for which the same pattern was recovered using similar PaleoENM methods and analysis (Brame and Stigall Reference Brame and Stigall2014). The congruent results among these taxa suggest that increased competition during invasive regimes may be an important driver of biodiversity patterns on evolutionary timescales (Stigall Reference Stigall2014).
Speciation in the Miocene
In the first application of PaleoENM techniques to the terrestrial fossil record, Maguire and Stigall (Reference Maguire and Stigall2009) investigated the mid-Miocene radiation of horses in the subfamily Equinae. Occurrences for 30 equid species, stratigraphic correlation, and paleoenvironmental layers were constructed from literature survey at a spatial resolution of 1° grid cell size. PaleoENMs were trained in the Great Plains region and the GARP algorithm was used to reconstruct suitable vs. unsuitable habitat for two time slices: the middle to early late Miocene during the peak of the equid radiation, and the late Miocene to early Pliocene as equid speciation rates declined. High rates of speciation were correlated with statistically greater patchiness of projected suitable habitat during the first and second time slices. This increased patchiness occurred during the initial period of Miocene climate cooling and increased aridity. Other studies (e.g., Vrba Reference Vrba1985; Abe and Lieberman Reference Abe and Lieberman2012) have also linked increased habitat patchiness with high speciation rates, as isolated populations are more likely to experience speciation by vicariance. However, as climate continued to cool and aridity decreased towards the end of the Miocene, speciation rates declined. This was paired with a decrease in patchiness of predicted suitable habitat, supporting the vicariance model (Stigall Reference Stigall2013).
Conclusions
PaleoENM is an effective and powerful tool for elucidating the relationships between species and their environments. A plethora of previous work has shown that evolution is highly dependent on Earth processes (e.g., Hallam Reference Hallam1981; Cracraft Reference Cracraft1982; Raup and Sepkoski Reference Raup and Sepkoski1982; Vrba Reference Vrba1985; Knoll Reference Knoll1989; Allmon and Ross Reference Allmon and Ross1990; Raup Reference Raup1994; Knoll et al. Reference Knoll, Bambach, Canfield and Grotzinger1996; Carroll Reference Carroll2000; Lieberman Reference Lieberman2000, Reference Lieberman2003; Barnosky Reference Barnosky2001; Rothschild and Lister Reference Rothschild and Lister2003; Stigall Rode and Lieberman Reference Stigall Rode and Lieberman2005a,b; Lieberman et al. Reference Lieberman, Miller and Eldredge2007; Maguire and Stigall Reference Maguire and Stigall2008). Thus, PaleoENM may be used to quantitatively test hypotheses regarding the effect of a dynamic planet on species evolution. There is also broad agreement that large-scale, independent events have significantly affected evolutionary history by causing major mass extinctions (e.g., Gould Reference Gould1985, Reference Gould2002; Jablonski and Raup Reference Jablonski and Raup1995; Jablonski Reference Jablonski2001; Congreve Reference Congreve2013). However, an oft-overlooked corollary is the role (and to what degree) abiotic variables play in initiating evolutionary change (see discussion in Lieberman et al. Reference Lieberman, Miller and Eldredge2007; Knoll Reference Knoll2012; Stigall Reference Stigall2012b, Reference Stigall2013; Myers and Saupe Reference Myers and Saupe2013). PaleoENM can be used to investigate this issue in addition to other macroevolutionary phenomena, such as niche stability, the evolutionary effect of niche breadth, and phylogenetic niche conservation. In particular, phylogenetic niche conservation is a pattern increasingly observed among sister species of modern biota (e.g., Peterson et al. Reference Peterson, Soberón and Sanchez-Cordero1999; Graham et al. Reference Graham, Ron, Santos, Schneider and Moritz2004; Pearman et al. Reference Pearman, Guisan, Broennimann and Randin2008; Weins et al. Reference Wiens, Ackerly, Allen, Anacker, Buckley, Cornell, Damschen, Davies, Grytnes, Harrison, Hawkins, Holt, McCain and Stephens2010; Peterson Reference Peterson2011). Investigations in the deep-time fossil record provide an important temporal perspective for evaluating the generality and macroevolutionary effect of these phenomena. PaleoENM analyses may also be useful in distinguishing between evolutionary radiations driven by adaptive vs. non-adaptive processes (e.g., natural selection vs. geographic complexity, exaptation, species-level selection) (Abe and Lieberman Reference Abe and Lieberman2012; Lieberman Reference Lieberman2012).
PaleoENM is similar in theory and in most aspects of its application to ENM analyses of modern taxa. Uniquely, however, it requires the acquisition of detailed taxonomic and geographic species occurrence data within a stratigraphic context. We have provided information on how to develop environmental layers for this type of analysis, and also described the various caveats necessary to apply this approach successfully. In particular, we have tried to present a possible standard for some of the best practices for this technique. We hope this will serve as a guide for future paleobiologists interested in applying PaleoENM to quantitatively test hypotheses of species-environment interactions in the deep-time fossil record.
Acknowledgments
We are very grateful to A. Knoll, E. Saupe, M. Kowalewski, and two anonymous reviewers for thoughtful comments and discussion of earlier versions of this manuscript. This research was supported by the NASA Astrobiology Institute Postdoctoral Program (C.E.M.), Madison and Lila Self Graduate Fellowship (C.E.M.), and a National Science Foundation's Advancing Digitization of Biodiversity Collections grant (no. 1206757 to B.S.L. and A.L.S.).
Supplementary material
Supplemental materials deposited at Dryad: doi:10.5061/dryad.t4jd0