


Renewed interest in the efficiency and safety of the U.S. food system has highlighted the central role of farm labor in modern food supply chains (Buccola, Li, and Reimer, Reference Buccola, Li and Reimer2012; Devadoss and Luckstead, Reference Devadoss and Luckstead2011; Richards, Reference Richards2018). One important aspect of farm labor is the handling of pesticides. The handling of pesticides is worthy of study because of their potential toxicity to people and the environment more generally (Davis, Caswell, and Harper, Reference Davis, Caswell and Harper1992). Exposure to pesticides may bring eye, skin, and pulmonary problems in the short term and other illnesses in the long term (Calvert et al., Reference Calvert, Karnik, Mehler, Beckman, Morrissey, Sievert and Barrett2008). Due to these and other societal risks, agricultural pesticide use is heavily regulated by federal and state authorities.
Regulations typically require farm operators to provide training and personal protection equipment (PPE) for pesticide handlers (EPA, 2019). Pesticide handlers need to know how to mix and apply pesticides and may need to know how to operate heavy equipment. This implies that pesticide handlers may need more experience, training, and higher levels of human capital than the average farmworker. This further implies that pesticide handlers may have higher wages than other workers.
Wages may also be affected by other aspects of the job. Although pesticide handlers comprise less than one-fifth of all farmworkers, they make up 50% of acute pesticide poisoning cases that are classified as medium and high severity (Calvert et al., Reference Calvert, Karnik, Mehler, Beckman, Morrissey, Sievert and Barrett2008, Table 1). This may be because on a number of farms, pesticide handlers lack a full complement of PPE compared to what is recommended, or they may wear it inappropriately (Washington State Department of Health, 2020). On some farms, they may manually apply pesticides instead of benefitting from the protection of an enclosed cab tractor. It is conceivable that pesticide handling could potentially fall to workers with lower human capital and lower opportunity costs.
Summary statistics

Note: Hourly wages deflated to year 2016 with CPI from the U.S. Department of Labor.
Results are based on NAWS observations from 2002 to 2016.
With this background, the overall goal of this study is to answer two general questions. The first is what characteristics of farmworkers, if any, make one more likely to be a pesticide handler. It is an open question whether pesticide handlers have high human capital or other types of characteristics. The second general question concerns how pesticide handlers are paid relative to other workers. It is conceivable that pesticide handlers are paid more because they have higher qualifications. However, the proper comparison to make concerns their pay versus that of a worker with similar qualifications. Making an appropriate comparison can be difficult, because the workers who are assigned pesticide handling responsibilities may differ from others in systematic ways.
Not accounting for systematic differences is a form of omitted variable or selection bias and could lead to biased estimates of the wage gap (Cropper, Hammitt, and Robinson, Reference Cropper, Hammitt and Robinson2011). To alleviate this problem, matching techniques are used, in which multiple workers are found who are observationally equivalent in every way (human capital and geographic location) except pesticide handling. In such cases, the nature and degree of wage differences can be determined.
If pesticide handlers are paid more even though they are the same in every other meaningful way, this might be construed as a compensating wage differential. Such a wage differential may be used by the employer to compensate for certain characteristics of the job.
Despite the importance of this topic, there is limited empirical evidence for the United States. This study does, however, relate closely to several important literatures. One literature concerns the economics of farm labor markets, including Fan et al. (Reference Fan, Gabbard, Pena and Perloff2015), Li and Reimer (Reference Li and Reimer2021), Pena (Reference Pena2010), Rubin and Perloff (Reference Rubin and Perloff1993), and Taylor, Charlton, and Yúnez-Naude (Reference Taylor, Charlton and Yúnez-Naude2012). While these studies concern farm workers in general, this study looks at the interesting case of pesticide handlers who play an important role in environmental health and food safety.
This study also relates to a strand of the labor economics literature regarding the idea of whether jobs are “good” or “lousy.” A major emphasis has been on how changes in technology drive a wedge between the wages of workers who can productively work with certain technologies and those who cannot (Autor, Levy, and Murnane, Reference Autor, Levy and Murnane2003; Card and DiNardo, Reference Card and DiNardo2002). In the spirit of this study, Goos and Manning (Reference Goos and Manning2007) distinguish between what they call “lovely” and “lousy” jobs and present evidence of how employment in some markets has bifurcated into these categories. Pesticide handling might be a good job if it allows skilled workers to handle pesticides with the best technologies (e.g., a cab tractor). It might be an undesirable job if carried out with hand-held sprayers and minimal PPE.
Another key strand of the literature concerns the health risks of pesticide use (Crissman et al., Reference Crissman, Cole and Carpio1994, Reference Crissman, Antle and Capalbo1998; Harper and Zilberman, Reference Harper and Zilberman1992; Maumbe and Swinton, Reference Maumbe and Swinton2003). Many of these studies focus on developing countries. For example, Antle and Pingali (Reference Antle and Pingali1994) examined pesticide use in the Philippines and find that pesticide handling is associated with lower technology, as well as low health and productivity among handlers, lending support to the “lousy job” hypothesis. Devi, Shanmugam, and Jayasree (Reference Devi, Shanmugam and Jayasree2012), by contrast, find that pesticide handlers in India are paid nearly twice the hourly wage of other hired farmworkers, lending support to the “good job” hypothesis. Within the United States, Kandel and Donato (Reference Kandel and Donato2009) find that pesticide handlers are more likely to be legally authorized to work, and that these jobs are sought-after “good jobs.” They did not employ data on pay, however.
The study at hand builds on these studies by using data from the National Agricultural Worker Survey (NAWS), providing an analysis of wages, and taking advantage of econometric techniques such as propensity score-matching methods that were not employed in previous studies. This combination of approaches enables a broader assessment of the labor market for pesticide handlers.
This study finds that pesticide handlers occupy a somewhat more privileged status than the general population of farmworkers. Pesticide handlers earn 1.5 dollars more per hour on average, or 15%, when not controlling for other factors that might influence pay. Matching methods reveal that about half of this premium can be ascribed to observable characteristics including human capital proxies such as legal work authorization, experience, and education. This can be estimated because the sample is large enough, such that there are multiple workers with the same essential characteristics as the subset who are pesticide handlers.
Depending on the matching method used, pesticide handlers are compensated 5.2%–7.3% more than what innate characteristics would justify. This premium may be to incentivize a pesticide handler to stay with the job once they have received training. It may also be a compensating wage differential signaling that this important labor activity has “lousy job” as well as “good job” aspects.
The remainder of the article is organized as follows. In the next section, the data are introduced along with some preliminary statistics and analysis. The following sections present conceptual considerations for asking the questions of interest and then develop discrete choice and propensity score-matching models in turn. Results, limitations, and conclusions are then presented.
1. Data
The data used for the study consist of 30,507 observations from the NAWS for the years 2002–2016. The NAWS is an ongoing survey conducted by the U.S. Department of Labor, Employment and Training Administration. The NAWS is created through surveying of demographic, employment, immigration, and health data directly from randomly selected U.S. farm workers. In each year, a new sample is drawn from the population of workers in that year. NAWS observations are at the level of individual workers and are from six regions including the East, Southeast, Midwest, Southwest, Northwest, and California. The data lack information about the employers who hire farmworkers but do identify the type of crop associated with a given worker. The crop types include field crops, fruits and nuts, horticulture, vegetables, and multiple/miscellaneous.
Table 1 reports summary statistics about the primary variables used in the analysis. The first variable, pesticide, equals 1 if a worker self-identifies as a pesticide handler and is 0 if otherwise. The specific question used in the survey is: In the last 12 months, have you loaded, mixed or applied pesticides? Of the 30,507 observations, 20% of the workers identified as doing so. They are referred to as pesticide handlers (Hernandez and Gabbard, Reference Hernandez and Gabbard2018).
The second variable in Table 1 concerns wages which were converted to real terms using consumer price index information from the U.S. Department of Labor. For the whole sample, the average wage was $10.27 per hour. The average wage for workers who identified as a pesticide handler was somewhat higher, at $11.46 per hour. The average real wage for workers with no recent experience with pesticides was $9.97 per hour (values in Table 1 are rounded). This is a $1.50 per hour or 15% premium associated with workers who handle pesticides. However, this does not control for factors that may confound the comparison.
The next variable of interest in Table 1 is unauthorized. Authorized workers are either U.S. citizens, are permanent legal residents, or have a legal working status at the time of the interview. For the sample as a whole, approximately half were unauthorized. Of those who are pesticide handlers, 33.8% were unauthorized. Of those workers who do not handle pesticides, the unauthorized share was notably higher, at 54.3%.
The variable 1–2 years shows that 33.5% of workers have been with the current employer for 1–2 years. The shares were 27.5, 19.1, and 19.8% for 3–5 years, 6–10 years, and more than 10 years, respectively. Although not reported in the table, the variable tenure measures how many weeks a worker has worked at a given farm. The tenure of the average worker was 15.5 weeks, with pesticide handlers having a slightly longer tenure. The average worker was 37.2 years old, with pesticide handlers being about 3 years older. The average worker had 13.9 years of experience, with pesticide handlers having about 5 years more than that. The average worker had 7.6 years of education, with pesticide handlers exceeding this by 1.2 years.
Table 1 also shows that the majority of the pesticide handlers are male. Female workers account for 19.4% of total workers and only 5.8% of pesticide handlers. There are also differences in racial composition between the two groups of workers. For the subgroup of workers who are pesticide handlers, 42.7% report themselves White, whereas 35.5% of non-pesticide workers report themselves as White.
Pesticide handlers are more likely to be married, at 67.1% versus 60.1%. This fact is consistent with one of the previous results that pesticide handlers tend to be older. Pesticide handlers are also more likely to be a parent. While 40.9% of workers as a whole have at least one child in their household, 48.6% of pesticide handlers do.
Although not reported in Table 1, approximately 43.9% of workers who handled pesticides within the past year identified as being a semi-skilled worker. By selecting this designation, they did not identify with other tasks including preharvest, harvest, and postharvest activities. Semi-skilled tasks could involve the ability to operate heavy equipment.
Table 2 provides an additional lens through which to view the data. The observations are categorized into 30 groups by location and crop type to provide a geographical context for the sample. The first row considers 1,034 workers who at the time of interview worked with field crops in the eastern United States. Workers for eastern field crop operations who did not handle pesticides earned an average $9.56 per hour. Workers on eastern field crop operations who did handle pesticides earned $11.40 per hour, a 19.2% premium. In California, workers who did not handle pesticides earned $10.03 per hour. Workers on California vegetable farms who did handle pesticides earned $11.62 per hour, a 15.9% premium. In general, the average wage rate for pesticide handlers was higher than the average wage for their counterparts. The largest gap was 43.7% in the case of vegetable production in the Midwest.
Average real wages by region, crop type, and task

Note: Hourly wages deflated to year 2016 with CPI from the U.S. Department of Labor.
Results are based on observations from 2002 to 2016 in NAWS.
2. Conceptual Considerations
The ability to mix, handle, and apply pesticides must be learned and is a form of human capital. Workers with the ability to handle pesticides likely have elements of both general and specific human capital. A firm is less likely to invest in the specific human capital of a worker if that worker is unlikely to stay with the firm. Therefore, the firm may select a worker to become a pesticide handler on the basis of age, tenure, and perceived willingness to stay. If a worker has already stayed with the farm a long time, that worker is likely to stay longer. Human capital is also a general determinant of wage differences since it translates into improvements in worker productivity. Workers with greater productivities would be expected to earn higher wages.
Another major reason for wage differences among workers could be compensating wage differentials. Some individuals are more willing to do certain tasks, while others are very limited in what they are willing or able to do. Jobs that are unpleasant or dangerous may require higher wages to attract workers. The effects of human capital and compensating wage differentials may be additive (Hamermesh, Reference Hamermesh1993).
In addition to human capital and compensating wage differentials, a formal model of the processes that underlie pesticide handling compensation might need to account for differences in health risks, general supply and demand conditions, and other factors. For example, Pingali and Carlson (Reference Pingali and Carlson1985) model farm labor compensation that includes health risk and human capital. This model might serve as a template for this study but it is not suited to the particular hypotheses examined below. Explicit models of how human capital and compensating wage differentials affect compensation are presented in Hamermesh (Reference Hamermesh1993) and sources cited therein. They provide a context for the empirical models developed below.
3. Analysis of Pesticide Handler Characteristics
A discrete choice probability model of the general form:
 $$E[\,pesticide\,|\,{\bf{X}}]\, = \,F({\bf{X}}'{\bf{\beta }})$$
is used to assess the likelihood of pesticide handlers possessing certain characteristics. Here, pesticide is a binary variable equal to 1 if a worker is a pesticide handler, and 0 otherwise. F is a cumulative distribution function, X is a vector of variables that condition the likelihood of a worker being a pesticide handler, and β is a vector of coefficients. The conditional expectation of pesticide given X is interpreted as a conditional probability. The selection of a pesticide handler is assumed to depend on certain characteristics of interest to a farm manager. The probability of a worker handling pesticides may depend on an unobservable utility index for a farm manager that is determined by X.
Probit estimation of the equation is reported in Table 3 with goodness-of-fit statistics at the bottom. Note that logit estimation was also checked and found to be essentially identical; the probit had very slightly better goodness-of-fit when measured using the log-likelihood and pseudo-R-squared. Average marginal effects are reported, which are an average of the individual marginal effects calculated at every observation. Three models were estimated that differ in terms of the set of control variables, X.
Average marginal effects with pesticide handling as dependent variable

Note: Asterisks *, ** and *** mean the coefficient is statistically significant at the 10%, 5%, and 1% levels, respectively. Standard errors are shown in parentheses.
Looking first at the results for Model 1, the estimated average marginal effect on the variable unauthorized is −0.032. This means that if a worker is unauthorized, all else held constant, the probability of being a pesticide handler falls by 3.2% points. The finding that unauthorized legal status is associated with a reduced likelihood of handling pesticides is consistent with evidence in Kandel and Donato (Reference Kandel and Donato2009). Workers who are authorized may be more likely to be fluent in English and therefore more likely to read and understand certain pesticide labels. Authorization also increases the opportunity cost to a worker from pesticide handling, because it could make it easier to find jobs in alternative industries such as services, manufacturing, construction, and transportation.
If a worker is female, all else the same, the probability of being a pesticide handler falls by 19.4% points (Table 3). The coefficients on hourrate and piecerate indicate that if a worker is paid hourly or by piece rate (rather than paid a salary), the probability of being a pesticide handler falls by 8.4 and 29.6% points, respectively. An extra year of age also has a very small, negative effect (around 0.1% point).
On the other hand, 1 year of education raises the probability of applying pesticides by approximately 1% point, and one more year of experience raises the probability by 0.3% points. Workers who are White are 1.5% points more likely to apply pesticides. Those with children are 6.3% points more likely to be pesticide handlers. The variable tenure, which indicates the number of weeks worked at the current farm, had no effect.
In conclusion, a worker’s gender is the strongest predictor of being a pesticide handler, consistent with the important role found for gender in other agricultural contexts (Fisher, Reimer, and Carr, Reference Fisher, Reimer and Carr2010). Beyond that, being a parent, authorized, and White increase the probability of being a pesticide handler. Experience and education level are also positive and statistically significant, but the effects are small. Finally, compared to workers who are paid a salary, workers who are paid hourly or by piece rate are less likely to be pesticide handlers. A narrow interpretation of this evidence is that the job is not undesirable. This question, however, will be further examined in the next section using wage data.
Additional results are presented in Models 2 and 3. Model 2 was estimated for two different time periods, with the first period being 2002–2008 and the second period being 2009–2016. These correspond to different federal administrations (Bush vs. Obama), allowing that the federal government may play a role in pesticide regulation on farms. Model 2 also replaces tenure, which had no effect in Model 1, with the number of years that a worker has been employed with the current employer. This is divided into four categories: with current employer 1–2 years, 3–5 years, 6–10 years, or 11 or more years. Finally, Model 2 differs from Model 1 in that it includes the variable contractor, which is an indicator that the employer is a farm labor contractor.
The results in Table 3 show that results across these two time periods were reasonably similar, with the coefficients on unauthorized being −0.080 and −0.151, respectively. This means that if a worker is unauthorized, all else held constant, the probability of being a pesticide handler was 8% points lower during 2002–2008, and 15.1% points lower during 2009–2016.
As noted, Model 2 replaces tenure with the number of years that a worker has been employed with the current employer. This is divided into four categories: with current employer, 3–5 years, 6–10 years, or 11 or more years, with the latter classification being left out of the model to avoid the dummy variable trap. Table 3 shows that the shorter the period that a worker has been with an employer (e.g., 1–2 years vs. more than 11 years), the less likely they are to be a pesticide handler. There is a consistency in the results that pesticide handlers are more likely to be a long-standing employee.
Model 2 also includes the variable contractor, which is an indicator that the employer is a farm labor contractor. The results show that if a worker is hired by a farm labor contractor, all else the same, the probability of being a pesticide handler fell by 57.2 and 56.8% points during 2002–2008 and 2009–2016, respectively (Table 3).
Model 3 is similar to Model 2 except that it adds the variable English which concerns how well someone can read in the English language (1 = not at all; 2 = a little; 3 = somewhat; and 4 = well). A positive association is found between ability to read English and the likelihood of being a pesticide handler, all else the same.
4. Analysis of Pesticide Handler Pay
This section examines whether pesticide handlers are paid differently than workers who do not apply pesticides, all else the same. It was seen above that a worker’s characteristics can influence whether they are a pesticide handler. However, there are many workers in the larger sample who do not handle pesticides but are observationally equivalent to those who do. This makes it possible to compare the wages of workers who are pesticide handlers with those of other workers who are observationally similar. When comparing those with essentially identical qualifications, are pesticide handlers paid more, less, or the same?
Propensity score-matching techniques are used to identify a control group of non-pesticide workers who are very similar to pesticide handlers based on measurable characteristics. The method of propensity score matching is well established (e.g., Dehejia and Wahba, Reference Dehejia and Wahba2002; Rosenbaum and Rubin, Reference Rosenbaum and Rubin1983) and has been used for the NAWS data when analyzing the wage gap between authorized and unauthorized workers (Kandilov and Kandilov, Reference Kandilov and Kandilov2010). The method is used to identify the binary treatment effects by matching treatment and control units that are similar in observable covariates. It relies less on functional form than traditional types of econometric methods.
The average treatment effect on the treated is estimated using a control group of non-pesticide workers who resemble the pesticide handlers. Using the NAWS sample compiled for this study, matches between pesticide and non-pesticide workers were made and evaluated on a propensity score. Individuals with similar propensity scores are paired and the average treatment effect is then estimated by the differences in outcomes.
Three matching procedures were used, including one-to-one matching, one-to-four matching, and kernel matching. One-to-four matching uses four controls instead of one. This may increase the precision of the estimated treatment effect and make better use of sample size. On the other hand, one-to-four matching may result in the matching of increasingly dissimilar subjects. Kernel matching is yet another approach that uses a weighted average of control units.
Matches are made using the variables used in the earlier regressions, including legal status, payment scheme, age, experience level, education level, gender, race, marital status, whether the worker has children, region, crop type, task type, and year fixed effects. Once the matches are created, comparisons are made between treatment and control units that are similar in such observables.
5. Quality of Matching
Evidence regarding the success of one-to-one matching is reported in Tables 4 and 5. Table 4 reports the quality of one-to-four matching for Model 2, which performed quite well regardless whether the sample was restricted to the first half or second half (Table 3). The table presents two general sets of results: one for the unmatched sample and one for the matched sample. This permits the reader to understand whether non-handlers can be found that are observationally equivalent to pesticide handlers.
Quality of one-to-four matching for model 2

Note: This is for the full sample (2002–2016). Results on region dummies, crop dummies, task dummies, and year dummies are omitted from the table.
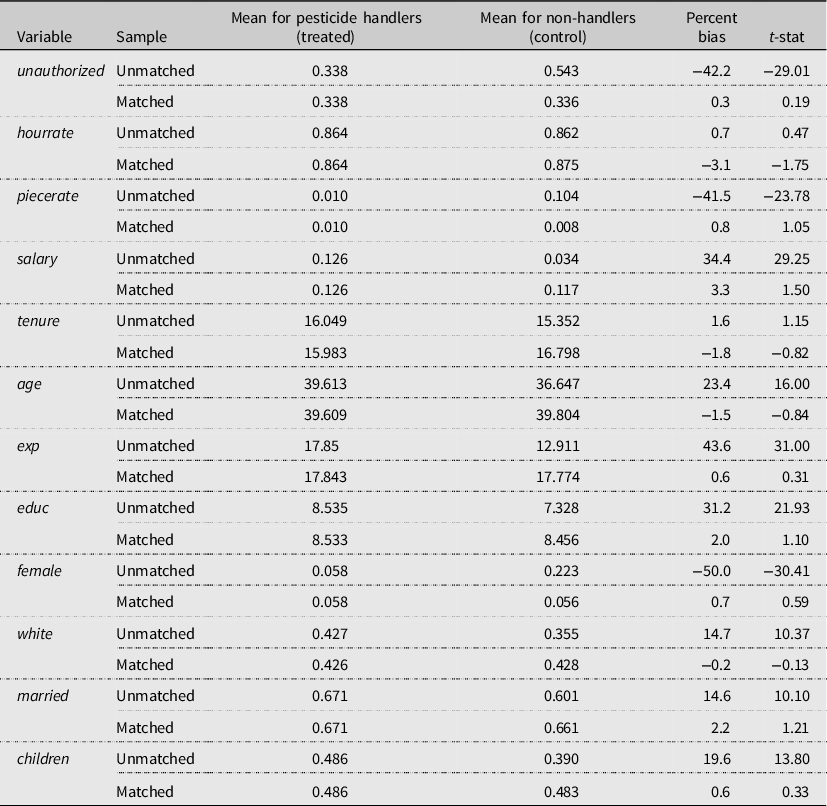
Quality of one-to-one matching for model 1
Note: This is for the full sample (2002–2016). Results on region dummies, crop dummies, task dummies, and year dummies are omitted from the table.
The sample mean comparisons for the unmatched set corresponded to individual covariates before matching took place. The characteristics of pesticide handlers are statistically quite different from those of non-pesticide workers. For example, the mean rate of unauthorized workers was 0.337 among pesticide handlers (the treatment) and 0.542 among non-handlers (the control). This amounted to a 42.2% difference, which is statistically significant (t-stat = −28.93). Once matches had been made through a one-to-four process, however, the mean among non-handlers was 0.338, with a bias of just −0.1%. Similar reductions in bias can be seen for most of the rest of the variables, with the exception of hourrate (whether a worker is paid on an hourly basis or not). However, its bias remains only 1.2% with matching. Although not included in Table 4 (for lack of space), similar reductions in bias were achieved for the region, crop, task, and year variables.
As noted above, there are other types of matching processes beyond one-to-four matching, and in the section below these alternatives will be presented. Analysis revealed that the results are not sensitive to the type of matching that is conducted, or the set of controls that are used. To illustrate this, Table 5 provides another series of comparisons. In this case, the quality of matching is evaluated for one-to-one matches made with respect to Model 1. Looking at Table 5, the associated sample means converged such that they were statistically equal. This is evident from the very small biases in the matched sample, as well as the t-statistics associated with sample mean difference.
The general conclusion is that the NAWS data enabled successful matching. In every case examined, non-pesticide workers could be found that are observationally equivalent to a pesticide handler. The implication is that the reader can interpret the comparisons made in Table 6 as if pesticide handler status is assigned randomly.
Results of propensity score matching

Note: Wage is in $/hour. Bootstrapped standard errors were calculated for the matched sample. Results are based on observations from 2002 to 2016 in NAWS. Asterisks *, ** and ***mean the coefficient is statistically significant at the 10%, 5%, and 1% levels, respectively.
6. Matching Model Results
The first row of Table 6 reports the wage difference before any matching takes place. Pesticide handlers are paid $11.46 per hour, approximately $1.50 more per hour than non-pesticide workers, who make $9.97 per hour on average. This does not take account of the fact, however, that pesticide handlers are more likely to be chosen from among those with more experience and other qualifications. Once the analysis accounts for these features, it is found that pesticide workers still have a wage premium (Table 6).
For Model 1, the wage premium was estimated to be $0.67, $0.69, and $0.73 per hour under one-to-one, one-to-four, and kernel matching, respectively. For Model 2, the wage premium was estimated to be $0.55, $0.52, and $0.53 per hour under one-to-one, one-to-four, and kernel matching estimate, respectively. The estimates may be lower in the latter case due to the use of more controls in the specification.
Overall, the results imply that there is a 5.2–7.3% premium paid to pesticide handlers over a non-handler who is observationally equivalent ($9.97 per hour, Table 6). This difference is statistically significant at the 1% level and may represent a compensating wage differential.
These results can be compared to those of Devi, Shanmugam, and Jayasree (Reference Devi, Shanmugam and Jayasree2012). They find that pesticide handlers in India are paid nearly twice the hourly wage of other hired farmworkers. This is a very different context from the United States. They do not, however, use matching models. The doubled wages of pesticide handlers, therefore, may reflect a range of differences. The wage premium found in this study, by contrast, is based on workers who are observationally equivalent. The wage premium appears to be a compensating wage differential.
7. Limitations
Although the level of detail in the NAWS data is in many ways unparalleled, it does not account for every piece of information that could be useful for a study such as this. For example, the data do not indicate whether pesticide handlers do this activity continually throughout the year, or only seasonally. The NAWS data suggest that many pesticide handlers engage in other tasks in addition to pesticide handling, such as tractor driving. The above analysis has accounted for these other tasks, such that the uniqueness of pesticide handling can be isolated. To the extent there could be bias, it might be to underestimate the wage premium associated with pesticide handling.
The NAWS data do not include information about the type of pesticide used or the risks associated with pesticide handling. In addition to evidence cited above, there is evidence of a higher risk associated with pesticide handling. For example, the Washington State Department of Health (2020) tracked 351 cases of agricultural workers with illness related to occupational pesticide exposure. Of these cases, 48% were pesticide handlers and they showed a higher percentage of moderate to severe outcomes compared to other workers. Fifty-six percent of the pesticide handlers were without at least one piece of required PPE or had a specific problem with their PPE. The implication is that pesticide handlers may have a perception of health risks which may be reflected in their willingness to choose this responsibility. Since we do not measure this perception directly, however, it cannot be concluded with certainty that the higher compensation of pesticide handlers reflects a compensating wage differential. This is not a source of bias, but a potential explanation for the part of the wage premium that was unexplained by the data.
8. Conclusions
Farm workers are of central importance to food supply chains yet a little studied topic within the labor literature. This study has focused on the unique role of pesticide handlers in the U.S. farm labor market, including their demographic composition and wage rates. Without taking worker characteristics into account, the wages of pesticide handlers are 15% more than the wages of other farmworkers (11.46 vs. 9.97 dollars per hour). About half of this premium was found to be explained by worker characteristics that are observable with the NAWS data. When comparing among workers who are observationally equivalent, pesticide handlers are compensated 5.2%–7.3% more than other workers, depending on the model and propensity score-matching method that was used. This represents a modest wage premium of 0.52–0.73 dollars per hour.
Results show that pesticide handlers are more likely to be male, White, have children, and to have legal authorization to work in the United States (either as a citizen or legal immigrant). Pesticide handlers also have slightly higher levels of education and experience with a given employer. They are less likely to be employed by a farm labor contractor.
Reasons were considered for the modest wage premium that exists beyond that which can be explained by observable characteristics. One is that employers may want to incentivize a qualified pesticide handler to stay with an employer once the worker has been trained. The employer may want to avoid the cost and disruption of having to retrain another employee for such a position. The second reason is that the wage premium may be necessary to induce a worker to accept the potential hazards of pesticide handling. Evidence from the health literature suggests that all agricultural workers are routinely exposed to pesticides, but pesticide handlers are more likely to experience illness. In this context, higher pay may be used to incentivize pesticide handling. Data of the sort to test this hypothesis conclusively, however, are very rare. Without it, a definitive conclusion cannot be made regarding whether the modest wage premium represents a compensating wage differential.
Given the continuing, central role played by pesticide handlers in food supply chains, it may be useful for future economic research to examine these possibilities. It is hoped that this study provides a foundation upon which future work can build.
Data availability statement
The data that support the findings of this study are openly available in the Public Data section of the National Agricultural Workers Survey website, specifically located at: https://www.dol.gov/agencies/eta/national-agricultural-workers-survey/data
Author contributions
Conceptualization: A.L. and J.J.R.; Methodology: A.L.; Formal Analysis: A.L. and J.J.R.; Data Curation: A.L.; Writing—Original Draft: A.L.; Writing—Review and Editing: A.L. and J.J.R.; Supervision: J.J.R.; Funding Acquisition: J.J.R.
Financial support
This research was supported financially by the Agricultural and Food Research Initiative (AFRI) Competitive Program of the USDA National Institute of Food and Agriculture (NIFA), grant number 26 2014-11637025, as well as Oregon State University.
Conflict of interests
Li and Reimer declare none.


 Open access

