


1. Introduction
New selection methods based on information from very large numbers of molecular markers have recently become feasible due to advances in genotyping technology. Meuwissen et al. (Reference Meuwissen, Hayes and Goddard2001) proposed prediction of breeding values from a genome-wide dense map of markers, which they termed genomic selection. The method exploits linkage disequilibrium (LD) between the markers and quantitative trait loci (QTLs) across the whole genome, in contrast to the approaches using variation explained by a small number of markers discovered with stringent significance thresholds (e.g. Maher, Reference Maher2008). To implement genomic selection, a prediction equation of marker effects must first be derived in a reference population, where individuals have both genotypes and phenotypes. The estimation of the marker effects is complicated by the fact that the number of markers is usually considerably larger than the number of phenotyped individuals in the reference population. To deal with this problem, Meuwissen et al. (Reference Meuwissen, Hayes and Goddard2001) proposed treating the markers as random effects. They then used methods to estimate the effects including Best Linear Unbiased Prediction (BLUP), where the effect of each marker was assumed to come from a normal distribution with equal variance across all markers, and Bayesian approaches where the variance of the normal distribution from which each marker was sampled was allowed to differ for each marker and assumed to follow a t distribution or a mixture distribution, with marker-specific shrinkage. In simulation, high accuracies of genomic estimated breeding value (GEBV) were obtained with both types of model, though the Bayesian approaches achieved the best accuracy.
The priors proposed by Meuwissen et al. (Reference Meuwissen, Hayes and Goddard2001) for the chromosome-specific variances of effects have been criticized for being too ‘strong’, e.g. it is not possible for information from the data to overcome the effect of the priors (Gianola et al., Reference Gianola, Fernando and Stella2006, Reference Gianola, de Los Campos, Hill, Manfredi and Fernando2009), though in practice this may not affect inferences at the level of the SNP effects (Yi & Xu, Reference Yi and Xu2008). In fact, BayesA can be extended so that the parameters defining the prior distribution of the marker-specific shrinkage variances is assumed to come from a third (usually non-informative) distribution (Yi & Xu, Reference Yi and Xu2008). However, if non-informative priors are used at this third level, large data sets are needed in order to derive informative posterior distributions on the SNP-specific variances and therefore appropriately ‘shrink’ estimates of the SNP effects.
An alternative method to estimate the SNP effects would be to use the least absolute shrinkage and selection operator (LASSO) approach (Tibshirani, Reference Tibshirani1996). This operator has the desirable feature of including in the model only a subset of explanatory variables, setting to zero those that have nil effects. This agrees with the assumption that many chromosome segments will not contain quantum trait locus (QTL) and therefore have zero effect, and only few are real QTLs (Hayes & Goddard, Reference Hayes and Goddard2001). The challenge with implementing the LASSO approach is how to best choose the constraint parameter which in turn depends on the size of the subset of explanatory variables, in this case the number of SNPs (Foster et al., Reference Foster, Verbyla and Pitchford2007). In this paper, we adopt a LASSO approach to estimate the marker effects for genomic selection using the least angle regression (LARS; Efron et al., Reference Efron, Hastie, Johnstone and Tibshirani2004) algorithm, including a cross-validation step to define the best size of the subset of variables (i.e. SNPs). In livestock populations, choosing a cross-validation set is complicated by the degree of relationship between subsets of animals.
Our aim was to investigate the accuracies of GEBV from the LASSO approach, and compare these with those obtained from the BLUP and BayesA approaches. We have also investigated the effect on accuracy of GEBV from the LASSO approach using different strategies for cross-validation to define the marker subset size. The methods were compared in both a simulated data set and a mouse data set. Legarra et al. (Reference Legarra, Robert-Granie, Manfredi and Elsen2008) and de los Campos et al. (Reference de Los Campos, Naya, Gianola, Crossa, Legarra, Manfredi, Weigel and Cotes2009) used the same mouse data set to assess the predictive ability using Bayesian regression and a Bayesian LASSO, respectively, to derive the prediction equation.
2. Materials and methods
(i). Data sets
The simulated data came from the XII QTL-MAS Workshop 2008, Uppsala (http://www.computationalgenetics.se/QTLMAS08/QTLMAS/DATA.html). A population of animals was simulated whose genomes contained 6000 marker loci evenly distributed over six chromosomes (1000 markers per chromosome), with 0·1 cM between markers. There were 48 QTLs distributed on the genome of which 44 had additive effects randomly sampled from a reflected gamma distribution and four had predefined large additive effects. Moreover, there was an epistatic interaction between two of the QTLs. The QTLs were not among the 6000 marker loci. LD between markers and QTL was generated by simulating a population of size 100 for 50 generations (Lund et al., Reference Lund, Sahana, de Koning, Su and Carlborg2009). Then a population of individuals was created by random mating 15 sires and 150 dams to generate the next generation. Following this, the next three generations consisted of 1500 individuals (15 sires) per generation. The last three generations (generation five to seven) of selection candidates were 400 individuals (15 sires) per generation, randomly selected from the 1500 individuals in the previous generations.
For each QTL, the genomic location, allelic substitution effect and the additive genetic variance were known. The true breeding values (TBVs) of all individuals and the heritability were also known. The animals from the first four generations (4665 individuals) had both genotypic and phenotypic information available. The animals from generation five to seven (1200 individuals) had no phenotype but had genotypes.
The second data set was a heterogeneous mice stock with a wide range of phenotypes and genotyped for 10 656 genome wide SNPs (Valdar et al., Reference Valdar, Solberg, Gauguier, Cookson, Rawlins, Mott and Flint2006). The data including pedigree, genotypic and phenotypic information are freely available at http://gscan.well.ox.ac.uk/. Three traits were analysed, weight at 6 weeks (W6W); weight growth slope (WGS) and body length (BL). The heritability of these traits was 0·73, 0·30 and 0·13, respectively. The phenotypes considered were residuals derived from the original traits adjusted for the main environmental fixed effects except for the cage effect (Valdar et al., Reference Valdar, Solberg, Gauguier, Cookson, Rawlins, Mott and Flint2006). Mice had not been randomly allocated to the cages, as most of the individuals in the same cage were full-sibs. Indeed over 549 cages only 22 contained individuals from 2 different families and only 1 contained individuals from 3 different families. Thus, the cage effect was partially confounded with genetic effects (Legarra et al., Reference Legarra, Robert-Granie, Manfredi and Elsen2008). Treatment of the cage effect in the different methods for calculating the prediction equation is described below. The final dataset consisted of 1885 offspring in 173 full sib families and 10 656 SNPs. Missing genotypes were randomly assigned on the base of their allele frequencies.
(ii). LASSO–LARS procedure
The LASSO is a constrained version of ordinary least squares which has been widely used in regression analysis for large models (Tibshirani, Reference Tibshirani1996). It minimizes the residual sum of squares while constraining the sum of absolute values of the regression coefficients. Consider the model for phenotypes of some quantitative trait as:
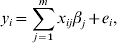
where yi is the phenotype of the ith individual; xij is the genotype of the ith individual at the jth marker of 1 to m markers, with xij=0 for genotype 11; xij=1 for genotype 12 and xij=2 for genotype 22; βj is the allelic substitution effect for the jth marker and ei is the random residual of the ith individual. Then the LASSO solution is the set of βj that satisfy

The constraint t allows some estimated SNP effects to be exactly zero (t is estimated by the procedure as explained later). The LASSO problem can be solved by quadratic programming (Tibshirani, Reference Tibshirani1996); however, this is very expensive computationally. An alternative solution is a modification of the LARS algorithm (Efron et al., Reference Efron, Hastie, Johnstone and Tibshirani2004). Initially, the LARS algorithm requires the genotypic information be standardized to have a mean 0 and unit variance, and that the phenotype has a null mean, so that
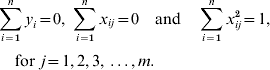
Then the LARS procedure starts with the set of active markers (A 0) empty and markers effects (βj 0) all set to zero. In a classical LARS procedure, the estimate of  is obtained in successive iterations, with one new marker added to the model at each iteration. To obtain LASSO solutions, the LARS procedure is modified so that either addition or subtraction of one marker to the active set per iteration may occur (Efron et al., Reference Efron, Hastie, Johnstone and Tibshirani2004). Obviously only the markers inside the model will have non-zero effects. See Efron et al. (Reference Efron, Hastie, Johnstone and Tibshirani2004) for a complete description of the algorithm.
(iii). Cross-validation strategies in simulated data set
The LARS algorithm as described in the previous section is a good way to produce LASSO solutions but it does not solve the problem of the selection of the constraint t in equation (1), where t is the upper bound of the sum of absolute value of effects of the SNPs involved in the model. The problem of choosing the best value for t can also be described as the selection of the best subset size of explanatory SNPs. In order to achieve this, a cross-validation approach using random sub-sampling replication (Kohavi, Reference Kohavi and Mellish1995) was performed. Replication of the sub-sampling procedure was used to attempt to take into account the uncertainty about predictive ability in an independent data set associated with a particular partition. The re-sampling approach averages across all possible partitions, and provides a measure of variability across partitions. In each replication, the reference population was randomly split into two sub-populations. The first sub-population, defined as the training sample (T), was used to estimate the SNP effects using LASSO–LARS. The second one, defined as validation sample (V), was used to validate the results obtained from the training sample. In particular, analysing the pth replication, the genotype and phenotype dataset (X, y) was partitioned into two (XT, yT) and (XV, yV) for training and validation, respectively. Then the LARS procedure was carried out on the XT and yT. For each kth LARS iteration, two further steps were added:
Step (i). GEBVs of the validation sample (GEBVV) were calculated as
 where is the SNP effects vector estimated in the kth LARS iteration on T.
Step (ii). The correlation coefficient between GEBVVk and phenotypes of V, {r(GEBVVk,yV)k} was calculated, and the LARS iterations continued until r(GEBVVk,yV)k reached the maximum, such that max{r(GEBVVk,yV)k} was achieved.
 where
where  is the SNP effects vector estimated in the kth LARS iteration on T.
Then a further 20 LARS iterations were carried out to check for sub-optimal convergence. If the maximum at the iteration  was confirmed, the corresponding number of active markers was retained as best subset size of the pth replication (map). At this point, the LARS procedure was stopped and the p+1th random sub-sampling replication started with a new split of the reference population into T and V.
In the simulated data, we evaluated three different approaches to splitting the data into training and validation sets. In the first cross-validation design, individuals were allocated by random splitting into two the overall population (RAN), where the individuals of the reference population were randomly assigned to either T or V, not considering their pedigree or the generation to which they belonged. In the second cross-validation design, individuals were assigned to V or T by splitting within sire families in the last generation of the reference such that within family predictions of GEBV are included in the cross-validation (WFAM). In the final cross-validation design, the validation set was split between families in the last generation, such that V consisted of individuals belonging to entire families and other sire families were in T (BFAM). In both WFAM and BFAM, the V consisted only of individuals from the last generation (4th) of the reference population, while the previous generations (1st–3rd) were always assigned to the T, so that both these methods accounted for the effect of the generations on the predictions of GEBV. Furthermore, different sizes of V(T) were tested, 5% (95%), 10% (90%) and 20% (80%) for RAN and the WFAM approach. For BFAM, the V(T) sizes were different because this approach is partly defined by the actual size of the families in the data. So the sizes of V tested were 2, 4 and 9 families corresponding to 4·3, 8·6 and 19·3% of the total reference population. Moreover, a size of V of 50% was tested for RAN only (this size of V(T) was not possible for the other two approaches, given the last generation consisted of 32% of the reference population only). For each trial (splitting approach×V size), 1000 replications were performed except for BFAM with 2 families where all possible combinations (105 replications) were carried out. For each trial mean, standard deviation and 95% confidence interval (CI) of ma (where ma is the vector of the best subset sizes across replications) were evaluated. Computational times for each strategy were recorded.
The performance of RAN, WFAM and BFAM as cross-validation strategies was compared based on the accuracy of the selection candidate GEBVs derived from the prediction equation for each strategy. The GEBVs were calculated as  , where Xc was the design matrix allocating the marker genotypes in the candidate population, and
  was the SNP effects vector estimated in the reference population. Accuracy was the correlation between true and estimated breeding values {r(GEBVc,TBVc)}.
(iv). LASSO–LARS in the mouse data set
LASSO–LARS was implemented in the mouse data by first randomly splitting the entire population into a reference population of 1600 individuals and a candidate population of 285 individuals, without consideration of which family the individuals belonged to. The RAN cross-validation approach with a validation sample size of 50% of the reference population (800 individuals) was carried out to find subset size of explanatory variables which maximized r(GEBVVk,yV)k. Note that both cage and SNP effects were considered as explanatory variables.
In the mouse data, the accuracy of the GEBV in selection candidates resulting from the LASSO–LARS prediction equation could not be assessed as r(GEBVc,TBVc) as TBVs were not available. We therefore estimated the breeding values (EBVs) using the full data set, and used these EBVs from the candidate set as proxies for TBVs. To calculate the EBVs from the full data set, the pedigree information from 2882 individuals, including the offspring and their parents, and all the available records (2511, 2474 and 1942 for W6W, WGS and BL respectively) were used. The cage effect was treated as random as suggested by Legarra et al. (Reference Legarra, Robert-Granie, Manfredi and Elsen2008). Each trait was analysed by the model y=Za+Sc+e, where y was the phenotypes (residuals) vector; a was the additive genetic polygenic effects (EBV) vector; c was the cage effects vector; Z and S were the corresponding design matrices and e was the random residuals vector. The a and c were random effects assumed normally and independently distributed with mean 0 and variance–covariance Aσa2 and Iσc2 respectively, where A is the additive relationship matrix among all individuals and I is the identity matrix. Breeding values and variance components were estimated by using a Restricted Maximum Likelihood-based procedure. Then the accuracy of LASSO–LARS was taken as r(GEBVc, EBVc), where EBVs used information from the full data set, while the calculation of GEBV excluded phenotypic data on the candidate set.
Additionally, the ‘predictive ability’ was calculated as the correlation between true phenotypes (yc) and predicted phenotypes ( c) in the candidate populations
  (where Xc and Sc were the design matrices in the candidate population and
  and
and  were the SNP and cage effects estimated in the reference population).
Finally in order to allow a comparison with the results obtained by Legarra et al. (Reference Legarra, Robert-Granie, Manfredi and Elsen2008) a cross-validation based on the splitting of the whole population (1885 individuals) into halves, used as training and validation, respectively, was carried out. The split was either across families, where each half consisted of whole families randomly allocated to training or validation, or within family where half of each family was allocated to training and the other half to validation. The splits were repeated at random 10 times. At each repetition LASSO–LARS was carried out on the training population until the best subset size of variables estimated in the previous analysis (on the reference population of 1600 individuals) was in the model. The average of the accuracy and the predictive ability, of the validation samples, across repetitions were calculated. Note that the accuracy of predicting between full sib families is not inflated by the cage effect.
(v). BLUP and BayesA
We compared the accuracy of GEBV using prediction of SNP effects from the LASSO–LARS with GEBV calculated from SNP effects predicted by a BLUP approach and the BayesA methods as described by Meuwissen et al. (Reference Meuwissen, Hayes and Goddard2001). In the BLUP approach, the variance of the marker effects (σβ2) was defined as (assumptions defined in Habier et al., Reference Habier, Fernando and Dekkers2007):
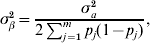
where pj was the frequency of one of the two alleles of the jth marker and σa2 was the total additive genetic variance (under the assumption of the infinitesimal model). In the simulated data, the SNP effects were calculated as  , where λ=σe2/σβ2 and I is the identity matrix. The parameters σa2 and σe2 (error variance) were assessed from the phenotypic variance and the known heritability.
In the mouse data, the cage effect was treated as random, so the cage and SNP effects were calculated as
![\left[ {\matrix{ {{\bi \hat{c}}} \cr {\hats{\bimbeta }} \cr} } \right] \equals \left[ {\matrix{{ {\bi S\prime S} \plus \bimkappa {\bi I}} \tab {\bi S\prime X} \cr {\bi X\prime S} \tab {{\bi X\prime X} \plus \bimlambda {\bi I}} \cr} } \right]^{ \minus \setnum{1}} \left[ {\matrix{ {{\bi S\prime y}} \cr {\bi X\prime y}} \cr} } \right]\comma](https://static.cambridge.org/binary/version/id/urn:cambridge.org:id:binary:20160920235758976-0995:S0016672309990334:S0016672309990334_eqnU13.gif?pub-status=live)
where κ=σe 2/σc 2. In this case σc 2 (cage effect variance), σa 2 and σe 2 were estimated by the classical polygenic model described in section 4. The matrix inversion was carried out by a Cholesky factorization approach.
The BayesA method used Gibbs sampling to draw samples from posterior distributions of the parameters as described by Meuwissen et al. (Reference Meuwissen, Hayes and Goddard2001), but modified to estimate single SNP effects rather than haplotype effects. The prior distribution of the SNP effect variances was a scaled inverted chi-square distribution. In the simulated data, the scale parameter (scl) and the degrees of freedom (df) were calculated from their expectations given the mean and variance of the distribution of QTL effects (known in the simulation) to give scl=0·00042 and df=4·00337, respectively.
In the mouse data, the cage effect was fitted so additional parameters were added to the model. In particular, the cage effects were drawn from a normal distribution where the variance (σc 2) was assumed homogeneous (i.e. common for all the cage effects). At each Markov Chain Monte Carlo cycle, the cage effect variance was drawn from a scaled inverted chi-square distribution. The priors for the SNP effect variance distributions were selected from a set of priors ranging from 10−6 to 1 and from 1 to 10 for scl and df, respectively. The prior combinations that gave the higher accuracy in the candidate population were scl=10−5 and df=4 for W6W, scl=10−4 and df=6 for WGS and scl=10−4 and df=6 for BL. The prior distribution of σc 2 was uninformative df=−2.
A Gibbs sampling scheme was run to draw samples from the posterior distributions of the parameters, for 11 000 cycles and 1000 of those were discarded as burn in. The samples of SNP effects from the 10 000 later cycles were averaged to obtain an estimate of the SNP effects.
Programs for BLUP, BayesA and LASSO–LARS procedures were written in Fortran90 and were run on a workstation with a 2·6 GHz processor running Linux.
3. RESULTS
(i). GEBV estimation by LARS–LASSO in simulated data
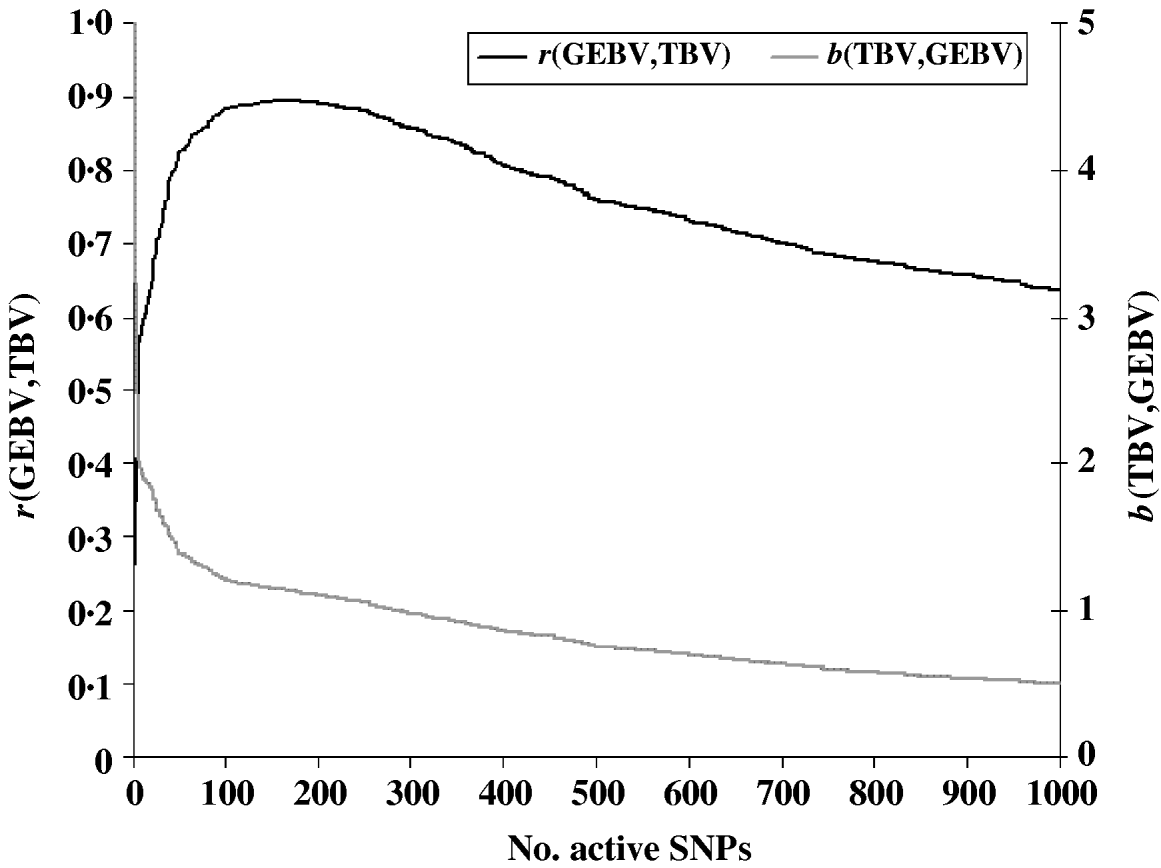
To evaluate the performance of the cross-validation procedure for choosing the optimum subset of SNPs, we first determined the ‘true’ optimum number of SNPs for predicting GEBV. We ran the LARS algorithm with increasing numbers of SNPs and calculated the GEBV accuracy r(GEBVc,TBVc) in the selection candidates. The GEBV accuracy reached a maximum of 0·895 at the 199th iteration when 169 markers were in the model (Fig. 1). In real applications, however, r(GEBVc,TBVc) will be unknown and the optimum number of SNPs must be determined by cross-validation. Note that because the true number of QTLs was 48, and the number of SNPs which gave the highest accuracy of GEBV was 169, more than one SNP was required to capture the effect of each QTL.
Accuracy of selection (r), regression coefficient (b) of TBV on GEBV in the candidate population as a function of the subset sizes of the active SNPs.
(ii). Best SNP subset selection in simulated data
Table 1 shows the means of the markers subset sizes from 1000 cross-validation sub-sampling replications for the sampling methods and sample sizes analyzed. For each subset size, Table 1 shows the corresponding GEBV accuracy in the selection candidates. The subset markers size ranged from 153 for BFAM 5% to 220 for WFAM-10%. The GEBV accuracy ranged from 0·881 to 0·894 for WFAM-10% and RAN-50%, respectively (Table 1). Table 2 shows standard deviations, 95% CI of the subset size for the different sub-sampling validations. Both measures of variability show the same pattern increasing from RAN to BFAM and decreasing with an increasing sample size. The BFAM sampling method provided GEBV accuracy values slightly higher than the other two methods for the common sample sizes (Table 1); nonetheless it was characterized by the largest 95% CI of subset size; hence it is less reliable (Table 2). This was particularly true when the size of the validation set was small, probably reflecting a very high variability of r(GEBVv, yv) with small numbers of individuals in V.
Means of the best marker subset sizes from 1000 replications and corresponding GEBV accuracy in the candidate population by size of the validation set (rows) and method of assignment of subjects to training and validation set (columns)
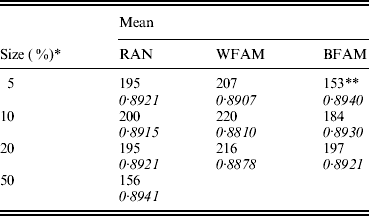
RAN, individual random sampling overall population; WFAM, individual random sampling in the last generation only; BFAM, across families sampling in the last generation only, the samples size in this case were 200, 400 and 900, respectively.
* Size of the validation set as percentage of the reference population.
** Number of replication was 105.
Standard deviation and 95% CI of the best marker subset sizes from 1000 replications, and computational time required for the different cross-validation strategies

RAN, individual random sampling overall population; WFAM, individual random sampling in the last generation only; BFAM, across families sampling in the last generation only, the samples size in this case were 200, 400 and 900, respectively.
* Size of the validation set as percentage of the reference population.
** Number of replication was 105.
In cases where the structure of the population might be either unknown or not homogenous, splitting the data between families might not be possible. Our results suggest the RAN method will give good results regardless of population structure. The best sample size of V for RAN was 50% of the total reference population. The following results for the LASSO–LARS are from RAN-50%.
(iii). Comparison with other methods in simulated data
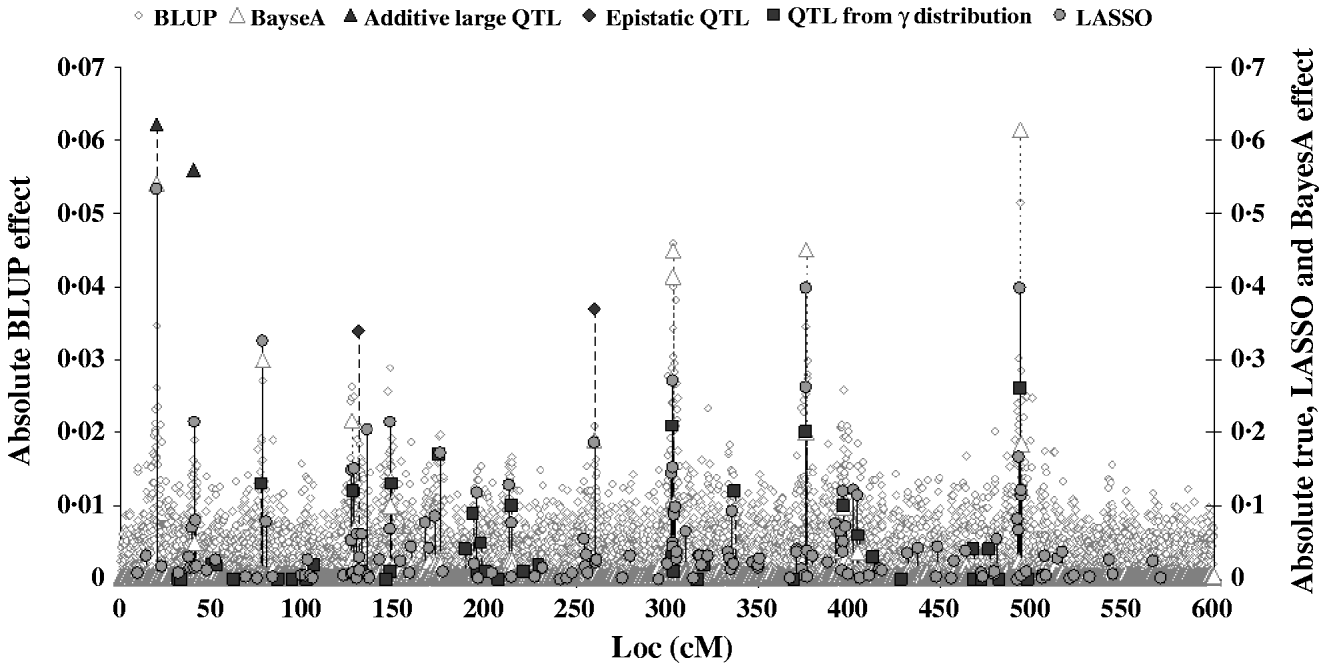
Figure 2 shows the absolute value of SNP effects predicted by BLUP, BayesA and LASSO–LARS compared with the true QTL effects. The effects predicted by BLUP were much smaller than those predicted by other methods, and are thus shown on a different scale. The largest effects from BLUP corresponded well with the location of the true QTL with the largest effects; however, when the QTL effects were small the predicted effects were not different from those at non-QTL locations. The marker effects predicted by BayesA and LASSO–LARS showed a much better correspondence with the true QTL effects. Nonetheless BayesA did miss some QTL positions in particular among those with small effects. LASSO–LARS detected QTL at nearly all of the QTL positions; however, there were some moderate effects predicted where there were no true QTL effects. Both BayesA and LASSO–LARS under-estimated the effects of the SNPs near to the QTLs with large additive and epistatic effects and typically over-estimated the remaining QTLs with small additive effects. The fact that regression of TBV on GEBV was approximately 1 could indicate that the under-estimation of large effects and the over-estimation of small effects approximately cancelled each other out in this case. One important difference between BayesA and LASSO–LARS is that BayesA predicts very small effects for locations not containing QTL, whereas LASSO–LARS set the majority of these effects to exactly 0.
Comparison of SNP effects estimated by LASSO, BLUP and BayesA methods with the true QTL effects.
The candidate population GEBV accuracy corresponding to the average subset size of RAN-50% sampling was compared with the accuracy obtained by using BLUP and BayesA approaches (Table 3). The accuracy obtained by LASSO–LARS exceeded that of BLUP and BayesA. Table 3 also shows the regression of TBV on GEBV, indicating that LASSO–LARS GEBV underestimates the TBVs to a small extent. However, it is important to point out that some of the QTLs had simulated epistatic action, and our LASSO–LARS (as well as the other two methods) did not account for this.
Accuracy of selection (r), regression coefficient (b) of TBV on GEBV, total computational time and memory resources required for the three methods used

The computing time needed to run LASSO–LARS was higher than for BLUP or BayesA (Table 3). A large proportion of the time in LASSO–LARS is spent in cross-validation used to define the best markers subset size. Actually this time might be considerably reduced; indeed almost the same results were obtained carrying out half of the replications used here.
(iv). Performance of LASSO–LARS in mouse data
The best subset sizes obtained by RAN-50% on the mouse population were 435 (262 SNPs and 173 ‘cages’), 348 (180 SNPs and 168 ‘cages’) and 218 (125 SNPs and 93 ‘cages’) for W6W, WGS and BL, respectively. For W6W, the accuracy r(GEBV,EBV) from LASSO–LARS was considerably higher than for BLUP and BayesA; for WGS, both BLUP and BayesA out performed LASSO–LARS by a small margin; while for BL, LASSO–LARS out performed BLUP but not BayesA, though differences between the methods were very small (Table 4). The regression coefficients b(GEBV,EBV) for LASSO–LARS were close to one for W6W but not for the other traits, perhaps reflecting the low to moderate heritability of these other traits.
Accuracy of selection (r), regression coefficient (b) of EBV on GEBV in the candidate population of mice

W6W, weight at 6 weeks; WGS, weight growth slope; BL, body length.
The predictive ability r(yc, c) of LASSO–LARS for W6W was considerably higher than BLUP but slightly lower than that of BayesA; for WGS BLUP and LASSO–LARS gave very similar results and both out performed BayesA; for BL LASSO–LARS gave a predictive ability slightly lower than the other two methods (Table 5). The regression coefficients b(yc, c) for LASSO–LARS were close to one for W6W and WGS but not for BL, where BayesA gave the coefficient closest to one (Table 5).
Predictive ability (r), regression coefficient (b) true phenotypes (y c) and predicted phenotypes ( c) in the candidate populations of mice

W6W, weight at 6 weeks; WGS, weight growth slope; BL, body length.
When the whole population was split into halves, both the GEBV accuracies and the predictive abilities in the validation half, obtained by across family splitting, were lower than those obtained by splitting the population within families (Table 6). For WGS and BL, the accuracies were higher than those obtained by Legarra et al. (Reference Legarra, Robert-Granie, Manfredi and Elsen2008) for both across and within family splits. However, for W6W, the r(GEBV,EBV) was lower than that obtained by Legarra et al. (Reference Legarra, Robert-Granie, Manfredi and Elsen2008) (Table 6). The predictive ability obtained by LASSO–LARS were slightly lower than those obtained by Legarra et al. (Reference Legarra, Robert-Granie, Manfredi and Elsen2008) for all the traits with the across family splitting. For within family splitting, the LASSO–LARS predictive ability was lower than that obtained by Legarra et al. (Reference Legarra, Robert-Granie, Manfredi and Elsen2008) for W6W and WGS, while for BL it was very similar (Table 6). An important consideration in interpreting these results is that while the EBV will be a more accurate predictor of the breeding value than phenotype, particularly for low heritability traits, it is possible that GEBV predicts the relationship component of EBV more accurately than the component which is derived from the QTL alleles that an individual actually carries. For example, Habier et al. (Reference Habier, Fernando and Dekkers2007) suggested that BLUP methodology derived some of predictive ability from relationship.
Mean of the GEBVs accuracy and predictive ability, of LASSO–LARS, across 10 repetitions of cross-validation with 50% splitting
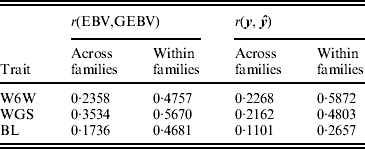
W6W, weight at 6 weeks; WGS, weight growth slope; BL, body length.
4. DISCUSSION
Our simulated results demonstrate that LASSO–LARS can accurately estimate the effects of SNPs associated with QTL in dense SNP data, leading to accurate GEBV for genomic selection. Unlike BLUP and BayesA, a feature of LASSO–LARS is that some of the SNP effects are set to zero. Given the very large amount of SNP data now available, this could be desirable since it allows the selection of a small subset of the markers which have predictive value for a particular trait. Our results suggest that the way in which the reference population is split into training and validation sets to determine the optimum number of markers to include in the model has little impact on the accuracy of breeding values subsequently predicted for an independent group of animals.
The BayesB approach for predicting GEBV, as proposed by Meuwissen et al. (Reference Meuwissen, Hayes and Goddard2001) is also a model selection approach, with a prior assumption that some of the SNPs will have zero variance. However, there is limited prior knowledge on what the proportion of chromosome segments with zero effects should be. Similarly, the LASSO–LARS approach requires defining a value of t. We have demonstrated here that cross-validation is a good approach to do this. In the simulated data set, our LASSO–LARS approach gave accuracies of GEBV in the selection candidates as high as or higher than BayesA and other Bayesian approaches, except for one approach which used marker haplotypes rather than single SNPs (Lund et al., Reference Lund, Sahana, de Koning, Su and Carlborg2009).
The accuracy of LASSO–LARS compared with BLUP and Bayesian approaches will depend on the number of QTLs underlying the quantitative trait and the distribution of their effects. If there is a limited number of QTLs, perhaps 10s or 100s, then the LASSO–LARS could perform well. However, if there are many thousands of QTLs each of very small effect affecting the trait, as has been suggested for traits like height in humans (e.g. Sanna et al., Reference Sanna, Jackson, Nagaraja, Willer, Chen, Bonnycastle, Shen, Timpson, Lettre, Usala, Chines, Stringham, Scott, Dei, Lai, Albai, Crisponi, Naitza, Doheny, Pugh, Ben-Shlomo, Ebrahim, Lawlor, Bergman, Watanabe, Uda, Tuomilehto, Coresh, Hirschhorn, Shuldiner, Schlessinger, Collins, Davey Smith, Boerwinkle, Cao, Boehnke, Abecasis and Mohlke2008), the limitation of LASSO–LARS is that the number of SNPs in the model cannot be larger than the number of phenotypes as described below. This may limit the accuracy of GEBV achievable with LASSO–LARS. If the number of QTLs is very large, the assumptions of the BLUP model may be a better match for the number of QTLs and their distribution of effects, and this method of predicting GEBV could outperform the LASSO–LARS. In the mouse data set, the performance of LASSO–LARS relative to BayesA and BLUP was trait dependant. For W6W, LASSO–LARS gave substantially more accurate GEBV than BLUP or BayesA; however, for BL the reverse was true. Unfortunately, there is little information on the distribution of QTL effects for either of these traits. Further investigations in real data are required to assess the comparative performance of LASSO–LARS across quantitative traits with widely differing distributions of QTL effects.
As mentioned above, one limitation with the LASSO–LARS is that as it is a (constrained) version of ordinary least squares, LASSO–LARS cannot give non-zero solutions for a number of explanatory markers (ma) larger than the number of individual (n) minus 1 (n−1 rather than n, because the columns of the genotypes matrix X have been mean centred). In fact this means that if we want to use the cross-validation method with a random sample of 50%, the maximum number of SNPs is half the sample size −1. Yi & Xu (Reference Yi and Xu2008) applied a Bayesian version of the LASSO (Park & Casella, Reference Park and Casella2008) which overcomes the above problem by applying SNP-specific shrinkage. However, the Bayesian LASSO requires prior distributions on hyper-parameters (Park & Casella, Reference Park and Casella2008). de los Campos et al. (Reference de Los Campos, Naya, Gianola, Crossa, Legarra, Manfredi, Weigel and Cotes2009) demonstrated that although the prior assumptions did affect the posterior distributions of the hyper-parameters in small data sets, inferences on the SNP effects were fairly robust with respect to the values of the hyper-parameters. One consideration with the Bayesian version of the LASSO is that if Gibbs sampling is used to draw from the posterior distributions of the SNP effects, the point estimates of the effects calculated as the average of these samples for all markers will be non-zero, even though the point estimates may be very small. The average effect across the Gibbs samples is a posterior mean, whereas the original LASSO method generates a posterior mode which is zero in some cases.
Even if the accuracy of GEBV from using the subset of markers from LASSO–LARS is not as high as that for methods using all SNPs, there is still a practical application of the method. If a subset of the SNPs can be genotyped much more cheaply than the complete set of SNPs, then the subset chosen by LASSO–LARS could be used as an initial screen for animals to genotype more fully. In fact, the LASSO–LARS algorithm could be applied with a user-defined t reflecting the dimensions of cost effective genotyping platforms. For example, a dairy cattle breeding company could screen many thousands of bull calves with the a small subset of markers (say 100–400), choose a few hundreds of the calves with the highest GEBV to genotype with tens of thousands of markers, then either take a hundred or so onto progeny testing or market semen from the bulls with the best GEBVs. The profitability of this approach would depend on the difference in cost of genotyping the subset of markers relative to the full set of markers, and the difference in accuracy of GEBV from the two marker sets.
ARC grant DP0770096 of Mike Goddard contributed to this project. Graziano Usai was funded during his stay at the DPI by the Sardinian Government program ‘Master and Back’, D. G. R. no. 27/13 and no. 59/34.



