


Rheumatoid arthritis (RA) is an immune-mediated disorder that causes widespread inflammation and progressive joint damage, eventually leading to bone erosion and functional limitations(Reference Cooles and Isaacs1). RA affects an estimated 1 % of adults worldwide(Reference Smolen, Aletaha and Barton2). The aetiology of RA is not fully understood, but environmental factors such as smoking, diet, obesity and the microbiome are hypothesised to contribute to its pathogenesis(Reference Romão and Fonseca3). Saturated fats, refined carbohydrates, sugary drinks, and low intakes of fruits and vegetables are considered potential dietary risk factors for RA(Reference Rezazadeh, Akhlaghi and Aflaki4). The increased prevalence of metabolic disorders, such as metabolic syndrome, impaired glucose metabolism and obesity in patients with RA, supports the hypothesis that a relationship may exist between hyperinsulinemia, subsequent insulin resistance (IR) and RA(Reference Amaro, González and Juanatey5). Hyperinsulinemia can be linked to a diet with a high insulinemic capacity. The glycemic index and glycemic load are measures of the glycemic response to foods, but they are not reliable indicators of the insulin response because they only consider the effects of carbohydrates on blood glucose levels(Reference Sieri, Agnoli and Pala6). Although carbohydrates are the main trigger of insulin secretion, proteins and fats can also increase insulin secretion after a meal(Reference Bao, De Jong and Atkinson7).
The food insulin index (FII) is a new food ranking algorithm that has been introduced as a more accurate method to estimate postprandial insulin responses to different foods. The FII is based on the postprandial insulin responses of each food relative to the insulin response of an isoenergetic reference food in healthy individuals(Reference Holt, Miller and Petocz8). In this regard, the dietary insulin indices (DIL and DII) describe the overall insulin response to a diet(Reference Bao, De Jong and Atkinson7,Reference Anjom-Shoae, Shayanfar and Mohammad-Shirazi9) . Despite evidence from some studies suggesting a positive association between an insulinogenic diet characterised by high dietary insulin index (DII) and dietary insulin load (DIL) scores and chronic diseases, such as metabolic syndrome, type 2 diabetes, CVD and inflammation(Reference Mirmiran, Esfandiari and Bahadoran10–Reference Sadeghi, Hasani and Mozaffari-Khosravi13), other studies have reported conflicting findings(Reference Nimptsch, Brand-Miller and Franz14,Reference Ghorbaninejad, Imani and Sheikhhossein15) . To the best of our knowledge, no studies have investigated the association between DII and DIL and RA risk in Iranian adults. Therefore, this study aimed to assess the relationship between DII, DIL and RA in a sample of Iranian adults.
Materials and methods
Subjects
This case–control study was conducted from February to May 2022 in Kerman, Iran. A total of ninety-five patients with newly diagnosed RA and 200 healthy controls aged 18–80 years was recruited using a convenient sampling method, in which subjects were chosen without using probability-based methods. RA patients were selected consecutively from those who were referred to the rheumatology clinic at Besaat Clinic in Kerman, Iran, and were conveniently accessible to the researchers. The diagnosis of RA was made by rheumatologists according to the American College of Rheumatology/European League Against Rheumatism (ACR/EULAR) criteria(Reference Aletaha, Neogi and Silman16). The onset of RA was defined as the day of diagnosis, based on medical records of patients. Additionally, 200 healthy controls without any joint or connective tissue disease were selected from outpatient clinics. The controls were individually matched to the case group by age (±5 years) and sex. The current study was conducted in accordance with the Declaration of Helsinki, and the study protocol was approved by the Ethics Committee of the Iran University of Medical Sciences (IR.IUMS.REC.1400.859). Written information on the objectives and methodology of the study was provided to all participants, and written consent was obtained.
Inclusion criteria
The inclusion criteria for the cases included adult patients aged 18 to 80 years with a recent clinical diagnosis of RA (less than 1 year) by a rheumatologist according to ACR/EULAR criteria(Reference Aletaha, Neogi and Silman16). According to ACR/EULAR, ‘definite RA is based on the confirmed presence of synovitis in at least one joint, absence of an alternative diagnosis that better explains the synovitis, and achievement of a total score of 6 or greater (of a possible 10) from the individual scores in 4 domains: number and site of involved joints (score range 0–5), serologic abnormality (score range 0–3), elevated acute-phase response (score range 0–1), and symptom duration’. The control group included adults between 18 and 80 years old who did not have any connective tissue or joint diseases.
Exclusion criteria
Participants were excluded from both the RA and healthy control groups if they had any of the following: a history of alcohol consumption, any of the following diseases: hepatic or renal disease, CVD, type 2 diabetes, thyroid abnormalities, or cancer, food allergies, adherence to special diets or food prohibitions, consumption of dietary supplements, use of certain medications (except anti-inflammatory drugs for RA patients) in the year before the interview, and reported energetic intake of less than 800 or more than 4200 kcal/d.
Dietary assessment
Dietary intake was assessed using a validated and reliable 168-item semi-quantitative FFQ with standard serving sizes(Reference Bao, De Jong and Atkinson7). Participants were informed of the standard serving sizes of the food items in the FFQ during face-to-face interviews with a trained dietitian. They then indicated how frequently they consumed each food item (daily, weekly, monthly or annually). The standard serving sizes of each food reported in household measures were converted into grams using the Nutritionist IV program (Nutritional Database Manager 4.0.1, USA). The food data were then analysed to obtain the mean energy and nutrient intakes.
Dietary insulin index and load calculation
The FII is a measure of the insulin response to a food. It is calculated by measuring the area under the insulin response curve (AUC) after consuming a 1000-kJ portion of the food and dividing this value by the AUC after consuming a 1000-kJ portion of a reference food, such as white bread. The FII values for each food item used in this study were obtained from these earlier studies by Holt et al.(Reference Holt, Miller and Petocz8), Bao et al.(Reference Bao, De Jong and Atkinson7,Reference Bell17) and Bell et al. (Reference Bell17). The FII of comparable food items was employed for foods that were not included in the prior studies. The insulin load of each food item was first estimated using the following formula to get the DIL(Reference Nimptsch, Brand-Miller and Franz14):
 $$\eqalign {\rm insulin\ load\ of\ food =\ & \rm insulin\ index\ of\ that\ food \cr & \times \rm energy\ content\ {\rm of\ that\ food\ (kcal/d)}}$$
Second, the DIL was calculated by adding the insulin loads of all the foods for each individual. The average DII is calculated by dividing the DIL by the person’s total dietary energy intake.
Assessment of other variables
To obtain the necessary information on other variables, including demographics (age, sex and education), past medical history and smoking status, a general information questionnaire was used. Physical activity was assessed using the Persian version of the International Physical Activity Questionnaire (IPAQ)(Reference Vasheghani-Farahani, Tahmasbi and Asheri18). Body weight was measured on a SECA scale in light clothing and without shoes to the closest 100 g. Standing height was measured without shoes to the nearest 0·5 cm, and BMI was calculated as body weight (kg) divided by height (m2).
Data analysis
SPSS 24 software (SPSS Inc.) was used to conduct statistical analysis. The G * Power software version 3.1.9.7 was used to calculate the sample size. The G * Power software automatically provides the conventional effect size values suggested by Cohen(Reference Kang19). In this study, considering the medium effect size (odd = 0·41), type I error (α) = 0·05 and power (1-β) = 0·95(Reference Jandari, Mosalmanzadeh and Moghadam20), total sample size for each group was calculated to be ninety-four people. Finally, ninety-five participants in the case group and 200 participants in the control group (ratio 2:1) were recruited for this case–control study. The normality of quantitative variables was established using the Kolmogorov–Smirnov test. Frequency (%) and mean with standard deviation are statistical measures that were used to present the results of the qualitative and quantitative data. The independent samples t test and χ 2 test were used to compare the two groups for continuous and categorical variables, respectively. We also used the χ 2 test and one-way ANOVA for categorical and continuous variables to compare the general characteristics and dietary intakes across tertiles of DII and DIL. The first tertile of DII and DIL was used as the reference in all models. Binary logistic regression was used to calculate OR (95 % CI) in the crude and multivariable-adjusted models. Model 1 adjusted for age, sex, BMI, education, smoking and physical activity, while model 2 adjusted for covariates in model 1 as well as for energy intake. The first tertiles of DII and DIL were used as the reference for all models. The tertiles were regarded as an ordinal variable in the logistic regression models to determine the trend of OR across increasing tertiles of DII and DIL.
Results
The general characteristics of the case and control groups are shown in Table 1. The mean age (sd) of participants was 48·37 ± 9·17 and 46·22 ± 11·53 years in the case and control groups, respectively. Women accounted for 76·8 % of the case group and 75·5 % of the control group. Participants with RA weighed less than controls (P = 0·0001), but there was no significant difference in BMI between the two groups (P = 0·05). Mean DII and DIL values were 34·22 ± 7·86 and 73 467·98 ± 21 770·11 in the control group, and 39·77 ± 4·76 and 84 127·47 ± 22 991·34 in the case group, respectively.
Table 1. General characteristics of case and control
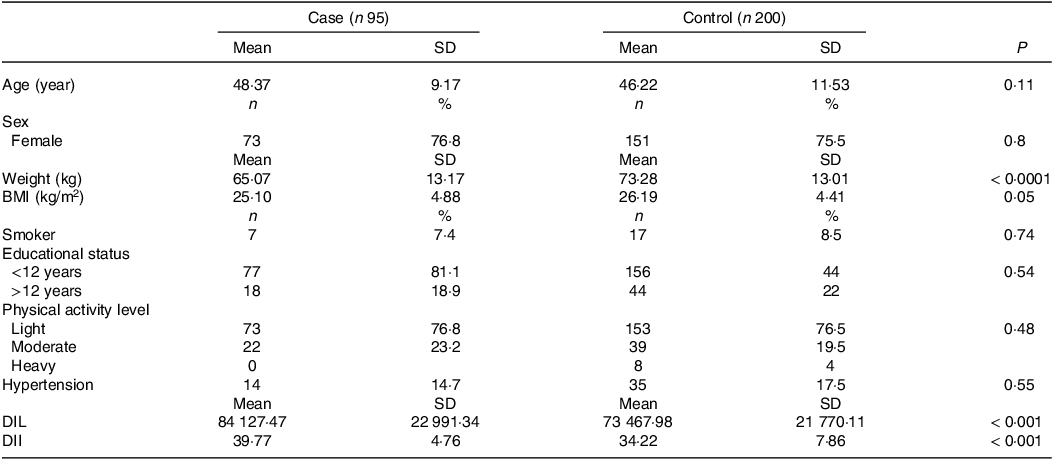
DIL, dietary insulin index; DII, dietary insulin load.
Data are presented as means ± SD or number (percent).
P values were obtained by the χ 2 test and independent samples t test for categorical and continuous variables, respectively.
Table 2 shows the general features of the cases and controls across tertiles of DIL and DII. Compared with participants in the first tertile, those in the highest tertiles of DIL and DII tended to be older (P = 0·01 and P < 0·0001, respectively). There were no significant differences in weight, BMI, educational level, sex, physical activity levels or hypertension between the tertiles of DIL and DII.
Table 2. General characteristics of participants across tertiles (T) of dietary insulin load (DIL) and dietary insulin index (DII)

Data are presented as the mean ± standard deviation (sd) or as the number (percent).
* Obtained from ANOVA for continuous variables and the χ 2 test for categorical variables.
Table 3 shows the dietary intakes of participants in the study across tertiles of DIL and DII. Compared with those in the bottom tertile, participants in the top tertile of DII had higher intakes of wholegrains (P = 0·0001), refined grains (P = 0·03), red meat (P = 0·02), fish and poultry (P = 0·04), fruits (P = 0·03), sweets (P = 0·0001), Na (P = 0·0001), and thiamin (P = 0·01). They had lower intakes of oils (P = 0·01), energy (P = 0·03), fat (P = 0·03), PUFA (P = 0·01), SFA (P = 0·0001) and MUFA (P = 0·0001). Participants in the top tertile of DIL also had higher dietary intakes of refined grains (P = 0·0001), legumes (P = 0·03), fruits (P = 0·02), dairy products (P = 0·01), fish and poultry (P = 0·001), sweets (P = 0·0001), sugar-sweetened beverages (P = 0·0001), oils (P = 0·0001), wholegrains (P = 0·04), red meat (P = 0·001), vegetables (P = 0·02), energy, protein, carbohydrate, fibre, cholesterol, SFA, MUFA, Ca, Na, Mg, thiamin, vitamin B6, folate (P = 0·0001) and PUFA (P = 0·002).
Table 3. Dietary and nutrient intakes of study participants across tertiles of dietary insulin load (DIL) and dietary insulin index (DII)
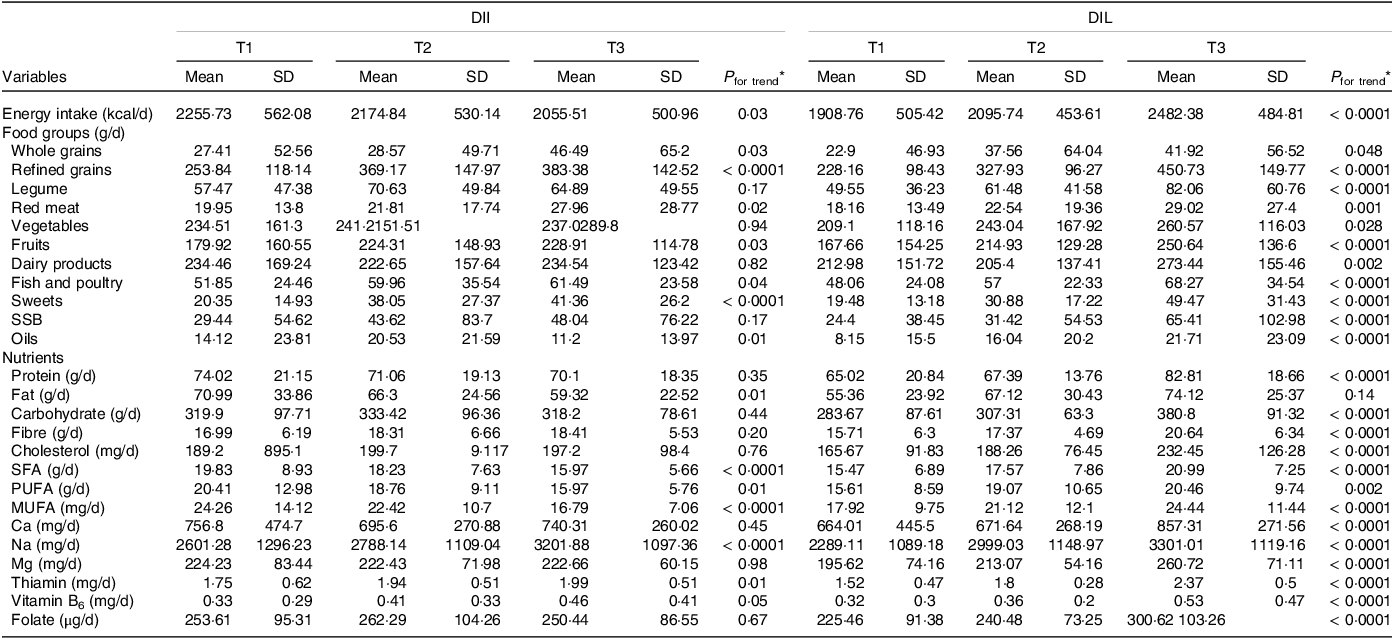
SSB, sugar-sweetened beverages.
* Obtained from ANOVA.
Table 4 shows the OR and 95 % CI for RA across tertiles of DIL and DII. In the crude models, we observed a significant positive association between higher DII and DIL scores and the risk of RA (OR were 1·32 for DIL (95 % CI (1·15, 1·78); P for trend = 0·009) and 2·22 for DII (95 % CI (1·48, 3·95); P for trend = 0·008). The fully adjusted OR comparing the highest tertiles of DIL and DII with the lowest tertiles were 2·73 (95 % CI (1·22, 3·95); P for trend < 0·0001) and 3·75 (95 % CI (3·18, 6·78); P for trend = 0·002), respectively.
Table 4. Crude and multivariable-adjusted OR (95 % CI) of RA risk across tertiles of dietary insulin load (DIL) and dietary insulin index (DII)
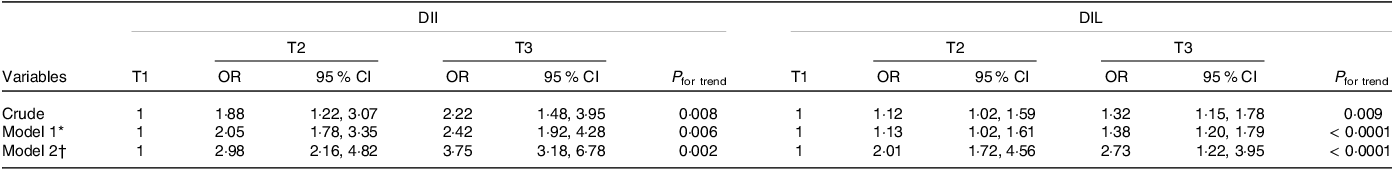
* Model 1: adjusted for BMI, smoking, activity, education, sex and age.
† Model 2: additionally, adjusted for energy.
OR with 95 % CI using binary logistic regression.
Discussion
To the best of our knowledge, our case–control study is the first to assess the relationship between dietary insulin indices, including DII and DIL, assessed by FFQ and RA risk. Our study found a positive association between an insulinemic diet (characterised by higher DII and DIL scores) and increased RA risk, which remained significant after adjusting for potential confounders.
RA is a chronic autoimmune inflammatory disease characterised by persistent synovitis and progressive joint erosion(Reference Cooles and Isaacs1). Previous studies have shown that some dietary factors may contribute to the development of RA, while others may be protective(Reference Sparks, Barbhaiya and Tedeschi21). The Nurses’ Health Study (NHS) reported that the risk of RA in women was significantly increased with regular intake of soft drinks with added sugar (more than one serving per d)(Reference Hu, Costenbader and Gao22). Additionally, a Western dietary pattern, which is high in refined grains, sweets and processed meats, has been associated with an increased risk of RA(Reference Rezazadeh, Akhlaghi and Aflaki4). Emerging evidence suggests a link between the insulinogenic effects of diet and the development of chronic diseases(Reference Chung, Oeser and Solus23,Reference Liu, Manson and Buring24) , although further research is needed to confirm this association. A large cohort study found that dietary patterns high in inflammatory and hyperinsulinemic foods were associated with an increased risk of type 2 diabetes, while dietary glycemic potential was not. This suggests that reducing the diet’s insulinemic and inflammatory potential may be more important than focusing on traditional glycemic foods for preventing chronic diseases(Reference Jin, Shi and Aroke25).
DII and DIL, which directly depend on insulin responses of the total diet and not a single nutrient, have attracted much attention in recent decades as more reliable methods for assessing the insulinemic potential of diet and its association with the risk of chronic diseases(Reference Bao, De Jong and Atkinson7). A cross-sectional study of 8932 breast cancer patients found that higher post-diagnostic DII and DIL were associated with an increased risk of all-cause and CVD mortality(Reference Farvid, Tamimi and Poole26). Another cross-sectional study of overweight and normal-weight children found that those who consumed breakfasts and dinners with a higher DII and DIL scores had a higher risk of being overweight(Reference Caferoglu, Erdal and Akin27). In addition, a cohort study showed higher DII and DIL during puberty were related to an unfavourable development of body fat in young adulthood(Reference Joslowski, Goletzke and Cheng28). High-insulinemic diets lead to higher insulin production, increased carbohydrate oxidation and decreased lipid oxidation. These changes are associated with increased abdominal fat storage and obesity(Reference Huang, Bisogno and Trevisani29). Numerous studies have shown that obesity, which can cause chronic low-grade inflammation, can contribute to the development of chronic diseases such as RA(Reference Lassale, Fezeu and Andreeva30,Reference Crowson, Matteson and Davis31) . Our study found that individuals in the highest tertiles of DII and DIL had a higher risk of developing RA than those in the lowest tertiles. These findings are consistent with previous research, which has shown that DII and DIL are associated with an increased risk of metabolic disorders such as metabolic syndrome, type 2 diabetes and CVD(Reference Mirmiran, Esfandiari and Bahadoran10–Reference Sadeghi, Hasani and Mozaffari-Khosravi13). In a cross-sectional study of 357 elderly men, Mozaffari et al. found that those with high DIL had higher levels of high-sensitivity C-reactive protein, a biochemical marker of chronic inflammation, than those with low DIL(Reference Mozaffari, Namazi and Larijani32). The association between inflammation and RA has been supported by numerous studies(Reference Kondo, Kuroda and Kobayashi33). In addition, the cohort study of postmenopausal women in the USA also found that a dietary insulinemic pattern was associated with an unfavourable profile of circulating biomarkers of glucose-insulin dysregulation and chronic systemic inflammation(Reference Shi, Aroke and Jin34). The higher prevalence of IR in inflammatory polyarthritis has been shown in previous studies. A study of ninety-two patients with early RA and 321 control subjects found that patients with RA had 4·8 times increased risk of having IR(Reference Müller, Kull and Lember35). On the other hand, elevated levels of inflammatory factors such as TNF-α, and IL 6 and 8, have all been reported in IR states(Reference Chen, Chen and Wang36). High-insulinemic-capacity diets are one of the primary causes of IR(Reference Bao, Atkinson and Petocz37,Reference Hsieh, Wu and Hsiao38) . In an ongoing cohort study that included 927 men and women, Mirmiran et al. found that higher DIL over a 3-year follow-up period was associated with an increased risk of IR(Reference Mirmiran, Esfandiari and Bahadoran10). Therefore, adherence to diets with high DII and DIL, which could in turn lead to IR, might be associated with the development of RA. However, there are conflicting findings regarding the relationship between insulin indices and health conditions. In a study by Nimptsch et al., which involved 1288 adults aged 20–74 years, the researchers found no significant associations between DII and DIL and plasma C-peptide, a marker of IR, and β-cell secretory activity; LDL-cholesterol; or the inflammatory markers C-reactive protein and IL-6. However, a significant association was observed between DIL and DII with TAG and HDL levels(Reference Nimptsch, Brand-Miller and Franz14). In addition, a recent cross-sectional study conducted in Iran found no significant association between DIL and DII and general or abdominal obesity, or metabolic syndrome and its components(Reference Ghorbaninejad, Imani and Sheikhhossein15). The contradictory findings may be due to a number of factors, including different tools used to assess diet, different age ranges of study participants, confounding factors, different methods for calculating DII and DIL, and different cooking and food processing methods in different cultures.
The exact mechanism of the association between dietary insulin indices and risk of RA is not fully understood, but several possible mechanisms have been proposed(Reference Amaro, González and Juanatey5,Reference Bao, De Jong and Atkinson7,Reference Heemskerk, Daemen and Buurman39,Reference Puchau, Zulet and de Echávarri40) . Previous studies have demonstrated that patients with RA have significantly elevated the levels of IGF-1 in their blood and joint fluid. This increase in IGF-1 levels is positively correlated with higher levels of inflammatory markers such as C-reactive protein and Erythrocyte sedimentation rate (ESR)(Reference Denko, Boja and Moskowitz41). Chronic hyperinsulinemia can lead to increased expression of Insulin-like growth factor (IGF)-1, which plays a role in inflammation mediated by T-cells in arthritis and may promote RA(Reference Erlandsson, Silfverswärd and Nadali42). Inflammation can cause IR, which can in turn worsen inflammation in rheumatic inflammatory diseases such as RA. Insulin can promote inflammation in the joints by stimulating the production of inflammatory cytokines and by attracting macrophages to the joints(Reference Tripolino, Ciaffi and Pucino43).
This study has several strengths. First, it is the first study to examine the association between DII and DIL and RA. Second, the study controlled for a wide range of possible confounding factors. Third, the study included patients with new instances of RA, which reduces the likelihood that their dietary intake had changed significantly since the onset of the disease. Our study also had some limitations. Because exposure and outcome data are gathered concurrently at a specified period in case–control studies, causality cannot be established. In addition, even though we employed a validated FFQ to assess diet, measurement errors and misclassification are always a source of concern. Finally, because some foods are not available in FII values, we had to use the values for similar foods.
Conclusion
Our findings suggest that adherence to a diet with a high DII and DIL is associated with an increased risk of RA. To confirm our findings, further prospective studies with large sample sizes and long follow-up periods are required.
Acknowledgements
This is a part of the master’s thesis of Mohadeseh Soleimani Damaneh, which was carried out with permission and under the supervision of Iran University of Medical Sciences (Grant No: 1400-3-2-22264). The authors thank the subjects who participated in the study.
This manuscript has been supported by the Iran University of Medical Sciences (grant No: 1400-3-2-22264).
M. S. D. and N. A. contributed to the conception/design of the research; M. S. D. and S. H. K. H. contributed to the acquisition of data. M. S. D. and F. S. H. B. participated in the analysis and interpretation of the data. M. S. D. drafted the manuscript; N. A. and L. A. critically revised the manuscript; and N. A. agreed to be fully accountable for ensuring the integrity and accuracy of the work.
None of the authors has any potential conflicts of interest related to this article to declare.


