


1. Introduction
Information regarding firn and ice density as a function of depth is important for many of the physical and climatological records stored in an ice core. Accurate densities are required to calculate water-equivalent accumulation rates and can provide an independent means of determining annual layers (Reference Gerland, Oerter, Kipfstuhl, Wilhelms, Miller and MinersGerland and others, 1999; Reference Hawley and MorrisHawley and Morris, 2006; Reference Hawley, Brandt, Morris, Kohler, Shepherd and WinghamHawley and others, 2008), while interpretation of ground-penetrating radar returns is strongly influenced by density variations above the firn/ice transition (Reference Eisen, Nixdorf, Wilhelms and MillerEisen and others, 2002; Reference Arcone, Spikes and HamiltonArcone and others, 2005). These scale variations (from millimeters to tens of centimeters) act as isochrones and can provide information regarding past climate conditions (Reference Spikes, Hamilton, Arcone, Kaspari and MayewskiSpikes and others, 2004). Firn density is usually calculated from measurements of sample volume and mass, quantities which are not only subject to a large measurement uncertainty but must also be sampled at a low vertical resolution to make sample handling practical (Reference Whillans and BolzanWhillans and Bolzan, 1988).
A gamma-ray (γ-ray) density gauge (sketched in Fig. 1) non-destructively determines the density of a sample of known thickness by comparing the transmission rate, or intensity, of a beam of γ-rays passing through a sample with the intensity of the same beam passing through air. Provided that the beam is narrow and consists of γ-rays of the same energy, the intensity of the transmitted γ-ray beam follows the Lambert–Beer law:

where n is the γ-ray intensity (γ-rays s−1) at the detector with a sample present, n 0 is γ-ray intensity at the detector with no sample present, ρ is the average density of the sample along the beam path (g cm−3) and x is the beam path length in the sample (cm). The mass attenuation coefficient, μ m, of the sample material (cm2 g−1) is defined as μ/ρ where μ is the linear attenuation coefficient (cm−1) of the sample material. The linear attenuation coefficient is a function of both the atomic number and density of the material and is a measure of the probability per unit length that a γ-ray will interact in some way with the sample material. The mass attenuation coefficient simply removes the density dependence from μ and provides a way to determine the material density if μ m is known.
Top-down view of a γ-ray density gauge.

Both n and n 0 are unscattered γ-ray intensities, that is, they have passed from source to detector without interacting with anything along the way, arriving at the detector undeflected and with their original energy. Ideally, γ-rays scattering from the sample are either deflected into and absorbed by the Pb detector collimator plate, or have lost sufficient energy in the Compton-scattering process to be discarded by the counting system. However, in a real instrument there is some contribution to n from small-angle scattering events, as discussed in section 2.2.4.
The mass attenuation coefficient is a constant for a given material and γ-ray energy, Eγ , so measuring the sample attenuation consists of simply determining n 0 and n. In a real measurement, we do not measure intensities directly, but instead determine them from n 0 = N 0/t 0 and n = N/t, where N 0 and N are the number of unscattered γ-rays arriving at the detection system in time t 0 and t, respectively.
The attenuation measurement alone can only give information about the product ρx which has units of g cm−2 and is called the ‘mass thickness’ of the sample. In order to extract a traditional density (g cm−3), we must also measure the diameter of the ice core, x. We then determine the density as

Several important aspects of a real density measurement are not captured by this relation:
-
1. Choice of optimum E γ for a given material and sample size.
-
2. System dead-time losses cause measured intensities, m and m 0, to be lower than the actual intensities, n and n 0.
-
3. Choice of an appropriate activity for the γ-ray source.
-
4. Calibrating the device to account for both finite detector energy resolution and departures from the narrow-beam approximation due to finite collimator hole size.
Section 2 discusses these issues and our methods of solving them, while section 3 covers measurement uncertainty, repeatability and throughput.
1.1. Previous instruments
Several instruments of this type have been used in glaciological work, including the Alfred Wegener Institute (AWI) densimeter (Reference Gerland, Oerter, Kipfstuhl, Wilhelms, Miller and MinersGerland and others, 1999; Reference WilhelmsWilhelms, 2000) and the Hokkaido University X-ray device (Reference HoriHori and others, 1999). These instruments operate at very different photon energies, but both use very intense sources: ∼3 Ci of 137Cs (primary energy 661 keV) for the AWI instrument and a 30 kV X-ray tube for the Hokkaido University device. The strength of their sources requires that both detectors operate in ‘current mode’, since the high X- or γ-ray intensity makes it impossible to detect the arrival or energy of an individual photon.
This is a potential disadvantage as Equation (1) is valid only for mono-energetic photons. Current-mode detection cannot differentiate between unscattered photons (with full energy, Eγ ) and those that have been Compton-scattered to some lower energy. Detectors without energy resolution must either use very tight collimation or correct the measurements using an empirical ‘build-up factor’ which depends on Eγ and both the geometry and density of the sample (Reference KnollKnoll, 1989).
Detector operation in ‘pulse mode’ counts each detected γ-ray individually and analyzes it for Eγ by monitoring the electrical pulse created by the detector. Using pulse mode precludes operation at very high γ-ray intensities due to dead-time losses (Reference KnollKnoll, 1989), but it does improve the statistical accuracy of the measurement and ensures that Equation (1) is correctly applied, by only counting events in a narrow energy range, corresponding to unscattered γ-rays. Dead-time losses occur when the γ-ray intensity is so high that it is not possible for the counting system to electronically distinguish the detector pulse of one γ-ray from the next, counting multiple γ-rays as one.
1.2. MADGE workbench and sensor head
The Maine Automated Density Gauge Experiment (MADGE) instrumentation consists of an aluminum workbench on which ice cores are processed, and an insulated, temperature-controlled electronics box. The workbench provides a straight and level surface for supporting the ice-core trays and mounting the density-profiling hardware. The ice cores are held in adjustable-height core trays and are density-profiled by the sensor head, a π-shaped set of aluminum plates which provide rigid mounting support for the source, γ-ray detector and ice-core diameter calipers, shown in Figure 2. The two legs of the π are the source and detector support plates, while the top is the yoke, a plate machined to keep the support plates parallel and properly aligned with each other.
Bottom view of the MADGE sensor head. The source and detector support plates are on the left and right, respectively. Core calipers are the black mechanisms at the bottom, designed to contact the core 33.3 mm ahead of the γ-ray beam. The sensor-head travel direction is from top to bottom of the photograph. For scale, each support plate is 10 cm from top to bottom.

A belt-type linear actuator driven by a stepper motor moves the sensor head in 3.3 mm increments over the ice core. After the sensor head is moved, the core diameter and gamma transmission are measured and stored by a microcontroller. Each such movement and measurement sequence is called an ‘exposure’; it takes 303 exposures to produce a continuous profile of a 1 m ice core.
The core diameter calipers are 3.3 mm wide, spring-loaded, plastic arms which pivot in from both sides of the sensor head to make contact with the ice core. Each arm carries a steel activator which interacts with a Gill Blade25 eddy-current position detector (http://www.gillsensors.co.uk) to provide sub-millimeter position measurements. The core-diameter measurement is made 33.3 mm (exactly ten exposures) ahead of the nuclear measurement, so the data can be easily shifted during post-processing to ensure that the core diameter and gamma transmission data are properly matched.
1.3. MADGE electronics box and microcontroller
The insulated electronics box takes 120VAC, 60 Hz power and contains the microcontroller board, a Canberra model 1000 portable nuclear-instrumentation module (NIM) bin (http://www.canberra.com), a ±12V linear power supply and a Parker OEMZL6 stepper motor controller (http://www.parker.com). A solid-state relay-controlled resistance heater and an exhaust blower are also installed inside the box to heat or cool as necessary to maintain a stable interior temperature of ∼20°C during measurements.
The microcontroller is a Rabbit Semiconductor RCM3720 (http://www.rabbit.com) and operates all parts of the instrument through RS-232, serial peripheral interface (SPI) and simple transistor–transistor logic (TTL) level voltage signals, as shown in Figure 3. The Canberra 512 counter timer and the core diameter calipers are operated via RS-232, while the OEMZL6 stepper motor driver is controlled via TTLlevel signals to select movement direction and give stepping commands.
Sketch of MADGE inter-instrument communications. RS-232 shown in dashed lines, TTL level shown in dash–dot lines, SPI shown in solid lines.
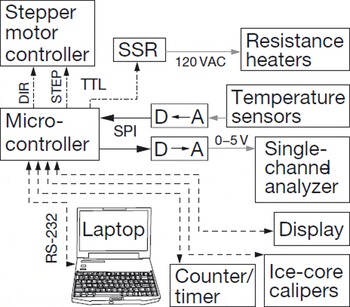
The microcontroller board also has 12-bit analog to digital (A–D) and digital to analog (D–A) conversion capabilities. The A–D converter measurements are used primarily to monitor temperatures, while the D–A converter is used to control the lower-level discriminator (LLD) setting of the Canberra 2015A SCA, allowing any drift in the nuclear-measurement system to be corrected.
The RCM3720 can be reprogrammed in the field and has an on-board 1 MB serial Flash memory to store hundreds of meters of density profiles. The operator can upload data to a laptop via any standard terminal program.
2. Measurement Methods
The density gauge makes two simultaneous measurements: sample thickness, x, determined by calipers, and sample mass thickness, ρx, determined by γ-ray transmission. In this section we discuss the equipment, the mathematical models for transforming raw data into useful form and the calibration method for the γ-ray transmission measurement system.
2.1. Thickness measurement
Measurement of the sample thickness determines the path length of the γ-ray beam through the sample and can have an impact on the calculated sample density uncertainty. Ice-core calipers for field use need to withstand lowtemperatures and blowing snow while providing sub-millimeter precision over thousands of measurements per day. We chose a spring-loaded caliper design that contacted the core on both sides, and measured the caliper-arm displacements using a pair of Gill Blade25 eddy current sensors.
Each Blade25 sensor reports a digital output code for a given caliper-arm displacement, with a resolution of ∼38 codes mm−1 (Gill Sensors, http://www.gillsensors.co.uk). This output code is converted to a displacement measurement (d src or d det) using a third-order polynomial. The two Blade25 sensors are controlled directly by the RCM3720 microcontroller via three-wire RS-232 connections. The RCM3720 performs the displacement conversion calculation and averages 30 measurements from each caliper arm to calculate the core diameter as x = d yoke − d src − d det, where d src is the distance between the source support plate and the ice core, d det is detector support plate to ice-core distance and d yoke is the inside distance between the source and detector support plates. This system allows correct core-diameter measurements, even when the core is not perfectly centered in the gauge.
The uncertainty of each sensor is generally ±1 code, or 0.026 mm, for small displacements (0–6 mm) but can be ±2 codes for larger displacements (>8 mm). We use the larger value to be conservative, so the overall uncertainty of the core-diameter measurement, Δx, is 0.1 mm.
2.2. Gamma-ray transmission measurement
We will follow the path of a single γ-ray from its source to its final destination, as a count stored in the memory of the microcontroller, to discuss all of the equipment used in the transmission measurement.
The γ-ray source, built by Isotope Products Laboratory (http://www.ipl.isotopeproducts.com), is a sealed stainless-steel capsule containing a 3.7 GBq 241Am pellet with a primary Eγ of 59.5 keV. The capsule is housed inside a small Pb shield equipped with a fail-safe, spring-loaded shutter (allowing the source to be turned on or off) and a 3.3 mm diameter collimator hole. The source collimator hole is 10 mm long and confines the radiation to a 42° apex-angle cone, aimed directly at the detector collimator hole.
The detector collimator is a flat Pb plate covering the entire detector face, except for a 3.3 mm diameter hole in the center. The Pb plate provides radiation shielding for the detector side of the sensor head and prevents the detector from counting any radiation, except that passing through the collimation hole. Together, the source and detector collimators define a pencil-shaped measurement beam which passes through the diameter of the ice core.
For the MADGE detection system, we required high speed and good energy resolution at 59.5 keV to match our source. The γ-ray detector was built by Saint-Gobain Crystals (http://www.detectors.saint-gobain.com) and is a 3.8 cm diameter by 3.8 cm tall BrilLanCe™380 (B380) scintillation crystal mounted on a photomultiplier tube. We chose B380 over the traditional NaI as our scintillator because of the faster response time of the B380 crystal.
The detector requires a high-voltage source and electronics to process the output signal pulses. MADGE uses a standard NIM bin to house and power a Canberra model 3102D high-voltage power supply, a model 512 dual counter timer and a model 2015A single-channel analyzer (SCA) with amplifier.
Signal pulses from the detector are first sent to the SCA. The SCA outputs a single logic pulse only if the input detector pulse voltage falls within a preset voltage window. This voltage window defines the Eγ range that will trigger a count by the counting system. The output logic pulses are sent to the counter/timer which keeps track of both the number of logic pulses (counts) and the elapsed time of the measurement. The microcontroller reads both count and elapsed-time data from the counter/timer for storage.
2.2.1. Goldilocks’ γ-ray
For a given sample size and density, a very high-energy γ-ray may not interact with the sample at all and a very low-energy γ-ray may not penetrate the sample to be counted. Between these two extremes we expect there will be an energy which is ‘just right’. We want γ-rays with low enough energy to have sufficient interaction with the sample to get a good density measurement but not so much interaction that the count rate is prohibitively low.
We can find this optimum γ-ray energy from Equation (1) by first defining the sensitivity, S, as the change in intensity, n, for a given change in sample density, ρ:

Given a sample material, size and range of densities, we can find the value of μ m which maximizes the sensitivity and translate that optimum μ m value into γ-ray energy using the solid curve in Figure 4.
Absolute value of sensitivity, |S|, vs μ m for 8 cm diameter ice cores of indicated densities (g cm−3). E γ vs μ m for water (Reference Brunetti, Sanchez del Rio, Golosio, Simionovici and SomogyiBrunetti and others, 2004) is plotted to relate the μ m for optimized S to Eγ for the sample material of interest. |S| is shown fora unit sample-free intensity (n 0 = 1 count s−1) for simplicity.

S is a negative number by definition, since n will decrease with increasing ρ, but in Figure 4 we plot the absolute value, |S|, to visualize the meaning of the maximum: that value of μ m which achieves the greatest change in output signal (intensity or count rate) for a given change in the input signal (density). Plotting |S| vs μ m for various values of ρ, we can see in Figure 4 that the sensitivity has a maximum and approaches zero for the two extremes of high and low values of μ m.
Setting ∂S/∂μ m equal to zero yields a simple relationship between μ m, x and ρ for optimal sensitivity: μ m = 1/ρx. Using this general relationship, we can use estimates of our expected sample size and density range to determine the optimum mass attenuation coefficient, which can then be converted into a corresponding optimal Eγ by choosing a material, and plotting Eγ versus μ m for that material.
2.2.1.1. Choosing Eγ for MADGE
In designing MADGE, we needed to process core diameters ranging from 5.0 to 8.0 cm with expected firn and ice densities ranging from 0.2 to 0.917 g cm−3, which together yield mass thicknesses ranging from 1.0 to 7.3 g cm−2. The optimum μ m values for this range are shown in Table 1. Choosing our material to be water, we can then use the Eγ vs μ m curve for water to find the optimum Eγ .
MADGE sample parameters and resulting optimized mass attenuation coefficients and γ-ray energies for water. Mass thicknesses range from 1.0 to 7.3 g cm−2

Taken together, the data shown in Table 1 suggest that a γ-ray energy between 20 and 100 keV would provide good sensitivity for the expected range of sample size and density, leading us to select 241Am for our source isotope, with its primary Eγ of 59.5 keV. This choice is nearly optimal for a 0.917 g cm−3, 5 cm diameter core (ρx = 4.6 g cm−2), which roughly represents the center of our expected sample mass thickness range.
2.2.2. Detection system dead time
All γ-ray detection systems have a limit on the rate at which they can resolve one γ-ray from another. This limit is generally described using the concept of a system dead time, τ: the period of time following the arrival of a γ-ray during which the system is unable to count a newly arriving γ-ray. Two problems arise from this phenomenon:
-
1. The actual rate of γ-rays incident on the detector, n, and measured count rate, m, diverge as the incident intensity increases, making it necessary to perform a dead-time correction to determine the values of n and n 0 from the measured values, m and m 0.
-
2. The dead-time correction is based on the value of the dead time, τ, which has its own associated uncertainty, Δτ, introducing additional uncertainty to the calculated densities.
The simplest model of dead time is the ‘non-paralyzable’ model, which assumes that the detection system is unable to count an additional event if it occurs within a time τ of the previous event (Reference KnollKnoll, 1989). In this model, the relationship between measured count rate, m, and the actual rate of incident γ-rays, n, is given by n = m/(1 − mτ). Since the number of actual and measured counts is given by N = nt and M = mt respectively, we also have the relationship N = M/(1 + mτ). When testing the MADGE detection system within its operating range, we found that the non-paralyzable model characterized dead-time losses very well, with a dead time, τ = 2.592 ± 0.0062 μs.
The operating range for the density gauge is defined as nτ < 20%, ensuring that we can assume that the measured γ-ray counts maintain a Poisson distribution (Reference KnollKnoll, 1989). nτ reaches 10% at n ≈ 39 000 cps which, by design, is the open-gauge event rate, n 0, in Equation (1). This gives a fundamental understanding of the capacity of our detection and counting system so we can properly choose the γ-ray source activity.
2.2.3. Source activity
The primary limitation on the activity of the source is the collimation and dead-time characteristics of the detection system to which it is coupled. A source with excessive activity requires very large dead-time corrections, increasing the influence of the dead-time uncertainty, Δτ, on the final density uncertainty, Δρ, to unacceptable levels. A weak source, however, will require far greater time to achieve a given density uncertainty goal. We sought to find an n 0 which satisfies n 0 τ ≈ 10%, a compromise between throughput and dead-time losses.
We calculated n 0 to be 0.1/2.592 × 10−6 s ≈ 39 000 cps. We then determined the source activity which would deliver n 0 γ-rays s−1 to the detector, given the geometry of the gauge and fixed absorbers (collimators, source and detector window materials) in the beam path.
The required source activity, A src, can be calculated as

where ∊
geom is the geometric efficiency of the source/detector pair, ∊
det is the efficiency of the detector,  , is the branching ratio of the source isotope at Eγ
, T
fixed is the gamma transmission through all fixed materials in the beam path and f
self is the fraction of 59.5 keV γ-rays which are not lost to self-absorption within the source pellet. All of these factors are functions of Eγ
, except the geometric efficiency. All of these factors except f
self are discussed at length by Reference KnollKnoll (1989). In our case, ∊
det = 1 because the 59.5 keV γ-rays, once inside the detector, are virtually guaranteed to interact with the scintillation crystal due to its size, density and high atomic number.
, is the branching ratio of the source isotope at Eγ
, T
fixed is the gamma transmission through all fixed materials in the beam path and f
self is the fraction of 59.5 keV γ-rays which are not lost to self-absorption within the source pellet. All of these factors are functions of Eγ
, except the geometric efficiency. All of these factors except f
self are discussed at length by Reference KnollKnoll (1989). In our case, ∊
det = 1 because the 59.5 keV γ-rays, once inside the detector, are virtually guaranteed to interact with the scintillation crystal due to its size, density and high atomic number.
For the MADGE prototype, we used the following values to determine the required source activity:

A difficult problem is the absorption of γ-rays within the source pellet itself, quantified by f self. This is a significant problem for 241Am because Eγ is relatively low (easily absorbed) and Am has a very high atomic number (a strong absorber) and is distributed throughout the volume of the source pellet. Our only successful calculation of f self was a Monte Carlo approach which indicated that ∼67% of the 59.5 keV γ-rays are lost to self-absorption in the source pellet, yielding f self = 0.33 used in Equation (5).
2.2.4. Mass attenuation coefficient calibration
The nuclear instrument calibration is the determination of μ m for a given γ-ray energy, detection system energy window width, detection system dead time and source/detector/collimator geometry. In essence, the calibration consists of multiple γ-ray transmission measurements, taken for varying absorber thicknesses. When these data are plotted as the natural logarithm of counts vs mass thickness of absorber, the slope of the resulting line yields μ m.
There are many sources in the literature for very precise values of μ m, determined using experimental set-ups as close to the narrow-beam ideal as possible. These values represent the maximum value of μ m attainable by any density-gauge system. Two factors cause real systems to achieve a lower μ m than the maximum, ideal value: finite detector and counting system energy resolution, and finite-size collimator holes.
The B380 detector has an energy resolution of 10.8% at 59.5 keV (www.detectors.saint-gobain.com), meaning that the measured energy of many 59.5 keV γ-rays would yield a Gaussian distribution (called a ‘photopeak’) centered at 59.5 keV with a full width at half-minimum (fwhm) of 6.4 keV. Since the photopeak has a finite width in energy, the user must adjust the counting system energy window width (via the single-channel analyzer) to count the events in the photopeak.
The finite energy window width allows some unwanted scattered γ-rays to be counted: those that have Compton-scattered through a small angle such that they fall within the energy window and still pass through the detector collimator.
The end result of the additional scattered counts is to make it appear that the calibration absorber is absorbing fewer γ-rays than predicted by Equation (1). The apparent reduction in absorbing power results in a lower μ m value than the maximum, demonstrating that calibration is a necessary process for all real instruments in order to properly account for the various non-ideal aspects of a given system.
Both the energy window and collimator hole size can be made smaller in an attempt to minimize the number of scattered γ-rays counted, but at the cost of decreased count rate of both scattered and unscattered γ-rays, which reduces the instrument throughput, as the device must spend more time on a single exposure.
2.2.4.1. Calibrating μ m for ice
For γ-ray energies less than the pair-production threshold at 1022 keV, a density gauge is really an electron density gauge, since all photon absorption and scattering is due to either photoelectric absorption or Compton-scattering interactions with electrons in the sample. This allows us to perform the μ m calibration on the material regardless of whether it is a gas, liquid or solid (Reference KnollKnoll, 1989), since the number of electrons per molecule is constant regardless of the phase of the material. Liquid water is an ideal calibration absorber, in that the bulk density is spatially uniform.
The MADGE calibration equipment consists of a plastic cylinder to contain the water, a syringe, an electronic scale to measure the mass of the cylinder and a source of deionized water. The calibration begins with the sensor head mounted vertically (source on bottom, detector on top) and leveled so the cylinder can be centered over the beam path. The mass and inner diameter of the empty cylinder are recorded and a gamma transmission measurement is performed with the empty cylinder in the beam path. This not only provides a zero-water-thickness data point, but also ensures that the attenuation effect of the cylinder is the same for all data points. Since μ m is determined by the slope of the plotted data, the presence of the cylinder does not affect the calibration results.
A small amount of water is then added to the cylinder, and the water mass thickness is calculated by dividing the total mass of water by the cross-sectional area of the cylinder opening. Note that the water density is not required for the mass thickness determination. A gamma transmission measurement is performed with the cylinder centered in the beam path, and the process is repeated for many different mass thicknesses, ideally covering the range of mass thickness expected for real samples.
After performing dead-time corrections for all data points, plotting the natural logarithm of corrected counts vs mass thickness of water yields a straight line with slope μ m.
MADGE has been calibrated for 3 and 5 cm core-diameter set-ups with μ m of 0.1810 ± 0.0004 and 0.1874 ± 0.0005 cm2 g−1, respectively. The longer source-to-detector distance of the 5 cm set-up eliminates more of the small-angle Compton-scattered photons discussed above, resulting in a larger μ m.
2.2.5. Effects of impurities on μm
Our development of the μ m calibration assumes that both the sample cores and calibration absorber are the same material: pure water. Real firn and ice cores contain impurities, typically in the 1 part per 109 range for the major ions. To evaluate the effects of these impurities, we analyzed hypothetical samples of impure water (representing an ‘impure’ ice core) and sea water.
Table 2 shows the calculated mass attenuation coefficients at 60 keV for pure water, impure water and 35-parts-perthousand salinity sea water, to demonstrate the effects of increasing impurity concentrations. The mass attenuation coefficients for these mixtures were calculated as μ m = Σ i wi μ m,i where wi is the weight fraction of element i and μ m, i is its mass attenuation coefficient. We use the elemental μ m, i data of Reference Saloman, Hubbell and ScofieldSaloman and others (1988).
Calculated μ m (at Eγ = 60 keV) for water with varying major-ion concentrations and the weight fractions of hydrogen, oxygen and the major ions used in the calculation

We chose the impure water concentrations to be at least an order of magnitude greater than those observed at the coastal Wilson Piedmont Glacier (Antarctica) site by Reference Bertler, Mayewski, Barrett, Sneed, Handley and KreutzBertler and others (2004). Even at these exaggerated impurity concentrations, the change in μ m is significantly less than the uncertainty of the μ m calibration. Therefore, for the purposes of γ-ray density gauging, treating firn and ice cores as pure water is well justified.
3. Uncertainty and Throughput
Having discussed all of the measurement systems, calibrations and individual uncertainties, we now need to combine them through Equation (2) to determine the final 1σ uncertainty in the density measurement, denoted as Δρ.
3.1. Uncertainty propagation
Applying the error-propagation formula (Reference BraggBragg, 1974) to Equation (2), we obtain three terms which describe the contributions of the nuclear counting, the core diameter and the mass attenuation coefficient, to the overall uncertainty in the calculated density:

Here, Δx and Δμ m are the measurement uncertainties of the core diameter and the mass attenuation coefficient, respectively.
Terms involving Δt are ignored because the time base (internal clock) in a modern nuclear counter/timer instrument is very accurate, with Δt and Δt 0 around ±0.1 μs (Canberra Reference IndustriesIndustries, 2002). Therefore, the contribution of the timing uncertainty to the overall density uncertainty is negligible in comparison to the other measurements (see Table 3).
Contributions to overall uncertainty in the calculated density, Δρ, for typical MADGE operating parameters and several different values for x uncertainty: N = 1.5 × 10⁵, t = 7.0 ± 10−7 s, N 0 = 1.5×10⁶, t 0 = 42.0 ± 10−7 s, μ m = 0.187 ± 0.001 cm2 g−1 and x = 5.0 cm

Performing the indicated derivatives in Equation (6), we obtain the following final expression:

where n = m/(1 − mτ) and n 0 = m 0/(1 − m 0 τ).
The uncertainty calculated by Equation (7) depends on the values chosen by the operator for N and N 0, as well as using proper values for Δx, Δμ m and Δτ. We tested Equation (7) by conducting sets of 100 repeat measurements on the same location of a firn core and varying N for each set. The results of this testing are shown in Figure 5 and demonstrate the close relationship between N, throughput and Δρ.
Box-and-whisker plots for repeated density measurements of the same location on a 3 cm wide firn core for various exposure counts, N. Measurements were repeated 100 times for each exposure count setting. The observed standard deviation (g cm−3) and average throughput (m h−1) are shown above and below each box plot, respectively. Note that the lower axis scale changes at N = 100 × 103.

Note that the observed standard deviation shown above each box plot is not the same as the calculated standard deviation, Δρ, from Equation (7). The calculated values are larger than the observed standard deviation by ∼0.001 g cm−3 for all values of N. Therefore, Equation (7) slightly overestimates the uncertainty in the density measurements and can be confidently and conservatively applied to MADGE density data.
We also tested the repeatability of the instrument by performing repeated density scans of the same 1 m section of core and observing the variability, shown in Figure 6. The average standard deviation of all 303 measurements was 0.0082, while the calculated Δρ was 0.009 g cm−3, showing again that Equation (7) provides a conservative estimate for the measurement uncertainty for varying densities and core diameters observed over the length of a core segment.
Eight repeated density scans of a 3 cm wide core collected from the South Pole at N = 50 × 103, yielding a calculated Δρ = 0.009 g cm−3. (a) The entire core with a core break at 64 cm; (b) close-up view of the 20–40 cm section. Dark gray indicates ±Δρ, gray indicates ±2Δρ and light gray indicates ±3Δρ bands about the mean density. The data spread over these bands demonstrates that Δρ calculated by Equation (7) is correctly accounting for γ-ray counting, μ m and core diameter uncertainties.

3.2. Throughput
Throughput is the rate at which the instrument can density-profile a unit length of core. The desired level of measurement uncertainty, source activity, dead time and the mass thickness of the sample all affect the throughput. The desired measurement uncertainty will determine N, the number of γ-rays that need to be counted during each exposure to achieve the measurement uncertainty goals, as shown in Figure 5. The rate of γ-ray transmission, n, for a given sample mass thickness determines the average time (in seconds) required for an exposure: t = N/n. The instrument throughput, T (m h−1), can then be calculated as T = 3600/αt where α is the number of exposures per meter.
We chose N = 1.5 × 10⁵ and N 0 = 1.5 × 10⁶ counts for field operation of MADGE on 5 cm diameter cores, resulting in a Δρ of ∼0.004 g cm−3. These values yield T = 1.5 m h−1 at an average sample density of 0.5 g cm−3.
3.3. Example data
An example of MADGE data recorded in the field is shown in Figure 7. These data were taken from a 13.5 m long section of nominal 5.2 cm diameter firn core collected at Titan Dome (88°30′ S, 178°32′ E) during the 2007 US ITASE (International Trans-Antarctic Scientific Expedition) traverse. After a hard, dense layer at the surface, 3 m of low-density firn with thin, dense horizons can be observed. MADGE can confidently distinguish fine-scale variability in firn density because Δρ is small and well quantified. Beyond 3 m depth, the overall density begins to increase, while the density variability decreases. MADGE provides excellent data continuity across core sections recovered in different drilling runs, as shown in Figure 7b where core sections and core breaks are shown explicitly.
Example of density data collected from a 13.5 m long, 5.2 cm diameter core from Titan Dome, Antarctica. Typical Δρ (±0.004 g cm−3) is shown in the upper left of (a) and (b). Core breaks (CB) and drilled core section boundaries (S) are shown in (b).

A fuller analysis of these and other MADGE data is in preparation.
4. Conclusions
This paper describes the major issues surrounding the design of a γ-ray density gauge, both in general and specifically for the MADGE system. Methods for determining the crucial system parameters (optimum -y-ray energy, appropriate source activity, mass attenuation coefficient, density uncertainty and throughput) have all been presented in detail, in the hope that readers may consider using or building such a system.
MADGE offers significant benefits over existing firn- and ice-density gauging systems:
-
1. Measurements are automated, highly accurate and recorded at high spatial resolution.
-
2. The calibration of the instrument is straightforward, repeatable and uses the actual measurand (water) as its standard.
-
3. Operating on 5–8 cm diameter cores allows the use of lower source activity, thereby lowering operator radiation exposure and making shipping of the instrument easier and less expensive.
-
4. Optimizing Eγ for the sample mass thickness provides the best density measurement and allows simple, lightweight shielding because the optimal Eγ is relatively low.
-
5. Using a pulse-mode γ-ray counting system with energy discrimination ensures that the Lambert–Beer law is correctly applied.
-
6. The measurement uncertainty analysis for a pulse-mode instrument is well developed and easily calculated for each exposure.
-
7. Finally, this instrument is field-portable and field-proven in an Antarctic traverse setting.
Acknowledgements
This work was supported by US National Science Foundation grant OPP-0440792. We thank S.A. Arcone for his detailed review of an early version of the manuscript. We also thank R. Hawley and an anonymous reviewer whose comments greatly improved this work



