


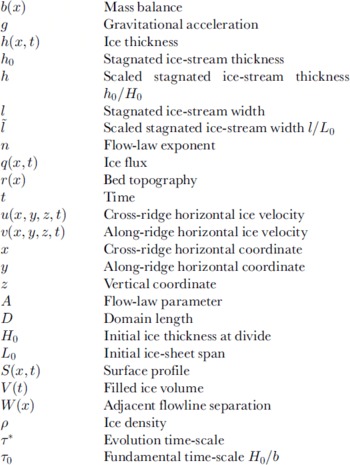
Notation
Introduction
Several small ice domes and ridges along the Siple Coast of the West Antarctic ice sheet (WAIS) are bounded by linear topographic features with widths on the order of the ice thickness on their flanks (Reference Scambos, Nereson and FahnestockScambos and others, 1998; Reference Jacobel, Scambos, Nereson and RaymondJacobel and others, 2000). One of these features on the flank of Siple Dome, the ridge between Ice Streams C and D in West Antarctica, has been interpreted as a former ice-stream margin (Reference Jacobel, Scambos, Raymond and GadesJacobel and others, 1996). Several lines of evidence suggest that other topographic “scar” features flanking Siple Dome are associated with margins of formerly streaming regions of Ice Streams C and D. These include (1) disruption of the internal layering at the boundary marked by scar features (Reference Jacobel, Scambos, Raymond and GadesJacobel and others, 1996), (2) evidence for water and/or till at the bed beneath the possible relict streaming areas (Reference Gades, Raymond, Conway and JacobelGades and others, 2000), and (3) low surface slopes associated with possible former streaming areas (Reference NeresonNereson, 1998; Reference Scambos, Nereson and FahnestockScambos and others, 1998). While similar surface undulations can be caused by bed topography, this paper addresses only linear features that appear to be associated with former ice-stream shear margins.
Scar features generally have topographic wavelengths ranging from one to four ice thicknesses (Reference Scambos, Nereson and FahnestockScambos and others, 1998). The standard method of calculating ice flux from ice thickness and surface slope predicts that surface undulations should diffuse rapidly in time. Why these features appear to persist over time remains an open question, but the answer is probably related to their short spatial scale (Reference Gudmundsson, Raymond and BindschadlerGudmundsson and others, 1998).
New satellite imaging techniques and detailed global positioning system(GPS) surveys have enabled detailed mapping of the spatial pattern and elevation of these scar features (Reference Scambos and NeresonScambos and Nereson, 1995; Reference Scambos, Nereson and FahnestockScambos and others, 1998). Scar features on Siple Dome lie 20–100 m above the level of active or recently active ice streams (Fig. 1). Scar features on the northeast flank of Siple Dome near Ice Stream D are associated with the stagnant “Siple Ice Stream” (SIS), and features on the south flank near Ice Stream C are associated with the “Duckfoot” (DF), a former streaming area of Ice Stream C. If these and other scar features on the WAIS are markers left behind by a former flow regime, then their present elevation and shape may hold information about the timing and nature of WAIS ice-stream evolution.
Advanced Very High Resolution Radiometer (AVHRR) image of Siple Dome and Ice Streams C and D showing linear topographic scar features on the flanks of Siple Dome. Image is a cumulated composite of six AVHRR scenes (Scambos and others, in press).

Given the dynamic nature of the WAIS, interpretation of the elevation of scar features may be complicated. As discussed in Reference Scambos, Nereson and FahnestockScambos and others (1998), one hypothesis is that the elevation of scar features relative to surrounding ice streams indicates recent thinning of the WAIS along the Siple Coast, and these scar features are markers of past ice-sheet elevation. A second hypothesis, also discussed in Reference Scambos, Nereson and FahnestockScambos and others (1998), is that following the shut-down of an ice stream, adjacent inter-ice-stream ridges expand into former actively streaming regions. A wave of thickening which travels faster than the ice causes small-scale topographic features associated with the former margin of the ice stream to be lifted onto the flank of the ridge.
While both processes may occur simultaneously, this paper develops the second hypothesis. A continuity model is used to show that expansion of an inter-ice-stream ridge into a stagnated ice stream would initially lift small-scale topographic features onto the flanks of the ridge. As the ridge reaches a new steady state, ice flow carries the feature downslope. A zone of localized thickening at the ridge–stream junction causes uplift of scar features for an initial period, even if the surrounding area is thinning. A simple analytic calculation relates the timing of this evolution to the ridge/ice-stream geometry and the accumulation rate.
This paper does not address the evolution of scar features themselves, ice fabric or basal conditions. The scar features are assumed to be small enough not to diffuse away quickly (< 100 years) and large enough not to be buried with snow accumulation. The features remain on the surface of the ice even after snow accumulation. They are carried along by ice flow as passive markers on the ice surface, much like wave ogives (e.g. Reference NyeNye, 1959; Reference WaddingtonWaddington, 1986). Ice is assumed isotropic everywhere and frozen to the bed after ice-stream stagnation.
Scar Evolution Model
A finite-difference, continuity model (hereafter referred to as the “FD model”) is used to track the elevation history of scar features on an evolving ice ridge flanked by stagnated ice streams. The initial surface shape is assumed to be a steady-state ridge truncated by flat ice streams which flow perpendicular to the two-dimensional plane (Fig. 2). Prior to ice-stream stagnation, all ice flux from the ridge into the ice-stream margin is incorporated into the ice stream so that the ridge/stream geometry is steady-state. At time t = 0, streaming flow ceases, all ice is assumed to be frozen to the bed and all flow in the domain is parallel to the two-dimensional vertical plane.
Schematic of the initial and final states of simplified ice-ridge/stagnant-ice-stream system. Stippled area denotes the total volume added during evolution.

Symmetry about the divide is assumed, so there is no divide migration during this evolution. The elevation of the ice-stream margin at the edge of the model domain is a prescribed boundary condition. For the Siple Dome/SIS/Ice Stream D system, for example, Ice Stream D lies outside the model domain and remains active so that its elevation (e.g. the elevation at the boundary of the domain) is fixed at its initial value after stagnation of SIS. Other boundary conditions include increasing or decreasing the boundary elevation at a prescribed rate to simulate thickening or thinning of the region outside the model domain.
After ice-stream shut-down, the ridge is allowed to expand into the stagnated ice stream and reach a new steady-state configuration according to continuity relationships. As ice accumulates on the stagnated ice stream, a slope develops at the domain boundary. All ice flux past this point is incorporated into the still-active ice stream outside the model domain (e.g. Ice Stream D). The scar feature, initially located at the boundary between the ice dome and the stagnant ice stream at t = 0, is assumed to be a passive marker on the ice surface and is tracked through this evolution process.
The evolution of the ice thickness h(x) through time t is described by the continuity relation,

where x is the distance along flow from the divide, y is the transverse horizontal coordinate and b is the mass balance, taken to be equivalent to the accumulation rate. The horizontal divergence of ice flux ∇ h · q is

where (qx
, qy
) are the horizontal components of ice flux. Assuming that the ice thickness does not vary across the flowline (∂yh = 0) and that the transverse velocity component is zero
 , the horizontal flux divergence ∇
h
· q becomes
, the horizontal flux divergence ∇
h
· q becomes

The variation in depth-averaged velocity perpendicular to flow
 can be expressed in terms of the variation in width between adjacent flowlines, W (Reference PatersonPaterson, 1994),

The horizontal flux divergence can then be written as

and Equation (1) becomes one-dimensional in x. The depth-averaged velocity along flow
 is derived from the velocity solution for a parallel-sided slab deforming according to Glen’s flow law (Reference PatersonPaterson, 1994),

where S(x) is the ice-surface profile,
 is an effective depth-averaged flow parameter, ice density ρ = 917 kg m−3, gravitational acceleration g = 9.8 m s−2 and the flow-law exponent n = 3. The parameter A ranges from 1 × 10⁻¹⁷ to 1 × 10⁻¹⁶ Pa−3 a−1 depending on the accumulation rate, the ice temperature and the desired initial ridge/stream configuration. For the calculations presented here, S(x) = h(x) and W = 1.
The continuity equation (Equation (1)) is solved on a finite-difference grid with horizontal spacing of 2 km (approximately two ice thicknesses) and the flux is calculated at the midpoint of each cell. Additional smoothing of the surface slope is not needed to prevent numerical instabilities (Reference BindschadlerBindschadler, 1982; Reference WaddingtonWaddington, 1982). Ice thickness is extrapolated one gridpoint beyond the domain to determine the flux derivative at the boundary points which are held at a fixed elevation throughout the calculation. The model is stepped forward at 0.5 year increments using an explicit method. The ice thickness and slope from time-step i are used to predict the ice flux at the next time-step i + 1.
The elevation history of a topographic feature at the ice surface is tracked during the evolution process. Since the scar feature is large enough to remain at the surface during evolution even as snow accumulates, its vertical motion is

where u s is the horizontal velocity at the ice surface. The first term on the right represents the advection of ice thickness, while the second term represents an increase or decrease in surface elevation from ice-sheet evolution. The horizontal motion of the scar feature is

Equations (7) and (8) are used to track the position of the scar feature as the ice ridge evolves.
Model Results
The ice-flow model is used to simulate an ice-ridge/ice-stream system with characteristics similar to those found on the Siple Coast, where ice thickness H 0 = 600–1000 m, span L 0 = 20–80 km, accumulation rate b = 0.10–0.20 m a−1 ice equivalent and relict ice-stream width l = 10–50 km. For simplicity, a flat bed and spatially constant accumulation rate are assumed. Figure 3 shows the typical evolution of the ice-ridge/ice-stream surface profile and the elevation of the scar feature. The inset panel shows the scar elevation through time Δh(t) relative to its initial height. Scar features are initially lifted onto the flanks of the evolving ridge. As the ice ridge approaches a new steady state, ice flow carries the scar features downslope (Fig. 3). These events occur faster for ice sheets with high accumulation rates and narrow relict ice streams.
Ice-surface profiles plotted every 200 years for an ice-ridge/ice-stream geometry similar to Siple Dome. The heavy gray line traces the position of a scar feature initially formed at the margin of the stagnated ice stream. Inset panel shows the change in scar elevation through time.

The time-scale for evolution of the ridge/stream system can be described in terms of a “volume-filling-time” discussed by Reference Jóhannesson, Raymond and WaddingtonJóhannesson and others (1989) for valley glaciers. The volume time-scale τ * for the ridge/stream case is the time it takes to fill the volume per unit width V, denoted by the stippled region in Figure 2, given the spatially constant accumulation rate b over the domain length D:

For the case where the boundary condition at the ice-stream margin is held at a fixed elevation, an analytical approximation to V can be derived using plastic ice-sheet profiles (see Appendix). This approximation yields values for V that are about 25% less than the numerical FD result, which gives Vialov-type ice-sheet profiles. The approximate time-scale is

This characteristic adjustment time is related to the fundamental time-scale τ
0 = H
0/b modified by terms which represent the scaled width
 and height
 of the stagnated part of the ice stream.
Figure 4 (column A) shows the comparison between the scaled volume evolution from the FD model (thick curve, lower panel) and the asymptotic exponential curve, 1 − exp(t/τ *) (thin curve, lower panel). The FD volume evolution is approximately exponential, with a characteristic time-scale close to τ *. The volume growth rate is initially determined only by the accumulation falling on the dome. Eventually, a slope develops at the new ice-stream margin (upper panel), increasing ice flux away from the dome and slowing the volume growth rate.
The upper panels show the evolution of surface profiles predicted by the finite-difference calculation in 200 year increments for three different ice-stream boundary conditions: (column A) fixed elevation at ice-stream boundary; (column B) decreasing elevation at ice-stream boundary at a rate 5b for 1000 years; ( column C) increasing elevation of ice-stream boundary at lb. For all cases, H0 = 1000, b = 0.10 m a−1, l = 30 km and h0 = 635 m. Heavy gray lines trace the path of the scar feature. Lower panels show volume-evolution curves for each case. Thick lines denote the normalized volume change from the finite-difference calculation. Thin lines denote the approximation [1 − exp(−t/τ*)].

The margin of the stagnated ice stream at the edge of the domain is assumed fixed at its initial thickness as if it were a new margin of an active ice stream. Another possibility is that the elevation of this margin is controlled by evolution of the region outside of the domain. Figure 4 (column B) shows the surface evolution for the case where the edge of the domain at the new ice-stream margin is allowed to thin at five times the accumulation rate (5b) for 1000 years. Because of the initial rapid thickening at the ridge/stream margin after stagnation, scar features rise for an initial period even when the region outside the domain is thinning. This result suggests that interpretation of scar features as accurate markers of former ice-sheet surfaces would overestimate past ice-sheet elevations. The lower panel shows that the time-scale given by Equation (9) is a good estimate of the adjustment time even if the elevation of the ice-stream boundary is not fixed.
Figure 4 (column C) shows the evolution of a ridge/stream system assuming an infinitely wide stagnated ice stream so that the edge of the domain is allowed to thicken at the accumulation rate following stagnation. In this case, the scar feature is raised indefinitely as long as the boundaries are allowed to elevate. The lower panel shows that the volume of the domain initially increases at the same rate as the fixed-boundary case. In both cases, volume growth is initially dominated by accumulation over the domain, with relatively small ice flux through the boundary into the new ice stream.
At t = 0, immediately after ice-stream stagnation, flow from the ridge onto the stagnant ice stream is not carried away because there is no surface slope to drive ice flow. Therefore, ice initially piles up at the ridge–stream junction, producing localized thickening that eventually propagates over the domain. This thickening wave is shown in Figure 5 for the case shown in Figure 3. The stagnant-ice-stream margin is located 50 km from the divide. The rate of thickening is scaled to the accumulation rate (b = 0.10 m a−1), and the curves, drawn in 200 year increments, are labeled in units of the volume-adjustment time-scale τ = τ * = 1700 years. The thickening wave is spread over the domain after about 0.5τ. Diffusion is almost complete after about 1τ.
Propagation and diffusion of the wave of thickening for the case shown in Figure 3. The initial stagnated-ice-stream margin is 50 km from the divide. The thickening rate is scaled to the accumulation rate, and the curves are drawn every 200 years and labeled in units of τ = τ*. The wave is spread over the domain after about 0.5τ. Diffusion is almost complete after about 1τ.

Application to Siple Dome
The FD model, the time-scale estimate (Equation (10)) and the observed elevation of scar features can be used to estimate the timing of stagnation of SIS and DF areas which bound Siple Dome. For the ridge/stream system represented by Siple Dome and the stagnated ice streams, H
0 ≈ 1000 m, b ≈ 0.10 m a−1,
 and
and
 . The volume-adjustment time-scale is about 1700 years. The scar features are predicted to reach a maximum height of about 250 m above the initial ice-stream margin (Fig. 3).
To simulate the evolution of Siple Dome, the generic FD model is modified to include measurements of bed topography r(x) = S(x, 0) − h(x, 0) from radio-echo sounding and GPS surveys (Reference Raymond, Nereson, Gades, Conway, Jacobel and ScambosRaymond and others, 1995; Reference Scambos and NeresonScambos and Nereson, 1995; Reference Jacobel, Scambos, Nereson and RaymondJacobel and others, 2000), and a spatial accumulation pattern b(x) inferred from radar-detected internal layering in the ice (Fig. 6a; Reference Nereson, Raymond, Jacobel and WaddingtonNereson and others, 2000). Since Siple Dome is a dome and not strictly a two-dimensional ridge, adjacent flowlines are allowed to diverge away from the divide so that the width between two flowlines in Equation (5) is described by W(x)/W(0) = (x/λ)2 + 1, where λ = 50 km (Reference NeresonNereson, 1998). The horizontal velocity is described by Equation (6) as before. An initial Vialov-type surface profile S(x, 0) is assumed over the Siple Dome part of the domain. The elevation at the boundaries of the dome (at ≈ ±50 km) are prescribed at their modern value. The FD model is run over the Siple Dome part of the domain for 5000 years until the surface profile is steady-state and consistent with the accumulation pattern. Flat surface and bed sections representing the relict ice streams are added to this steady-state profile, and the model is run again over the expanded domain for 1000 years to obtain the predicted Siple Dome evolution profiles. Figure 6b shows the surface profiles after 0, 200, 400 and 600 years.
(a) Spatial accumulation pattern inferred from radar measurements of internal layers across Siple Dome and extrapolated to cover the ice-stream regions (Reference Nereson, Raymond, Jacobel and WaddingtonNereson and others, 2000). (b) Surface profiles from the FD evolution model for Siple Dome at 0, 200, 400 and 600 years since synchronous stagnation of DF and SIS.

The present geometry of Siple Dome is similar to the profiles shown in Figure 6b during the very early stages of evolution. Detailed topographic images of Siple Dome show that the SIS is generally flat over most of its area, and it appears that the northeastern part of the dome has expanded slightly into the former streaming area (Reference Scambos, Nereson and FahnestockScambos and others, 1998). The scar feature associated with the former margin of SIS is presently about 50–100 m above the level of Ice Stream D, with higher elevations in the northeastern region where Siple Dome appears to be expanding into the former ice-stream area. This pattern is consistent with the FD model for ice-stream shut-down 200–500 years ago (Fig. 6b). This age range is consistent with the age estimated from analysis of the internal layer pattern detected by radar in the vicinity of the lower part of SIS (<650 years; Reference GadesGades, 1998) and from measurements of the depth of buried crevasses in the upper part of SIS (450–500 years; personal communication from B. Smith, 1998).
The northernmost scar features which comprise DF on the south flank of Siple Dome lie about 20–30 m above the present level of Ice Stream C (Fig. 1). Relative to the active ice-stream surface, the DF scars are lower than SIS scars and are consistent with the hypothesis that streaming activity has ceased at DF more recently than at SIS. However, part of the difference could be due to the difference in accumulation rate across Siple Dome. Higher accumulation rates correspond to fast evolution and rates of scar uplift. Given the accumulation gradient over Siple Dome, with lower accumulation rates south of the divide (Fig. 6a; Reference Nereson, Raymond, Jacobel and WaddingtonNereson and others, 2000), DF scars are also consistent with the FD model for shut-down 200–500 years ago. It is possible that DF and SIS have similar stagnation ages.
An independent estimate of the stagnation age can be obtained by comparing the spatial pattern of thickening or thinning ∂ t h(x) inferred from field measurements to the pattern predicted by the FD model at various times after ice-stream stagnation. Field measurements made along a flowline on the south flank of Siple Dome enable calculation of ∂ t h(x) from the continuity equation,

where b(x) is the accumulation rate, the factor γ = 0.8 describes the ratio of the depth-averaged horizontal velocity
 to the surface velocity u
s(x), and W(x) describes the relative distance between adjacent flowlines. The righthand side of Equation (11) is determined from: (1) an accumulation pattern b(x) inferred from radar measurements of internal layers in the ice (Fig. 6a; Reference Nereson, Raymond, Jacobel and WaddingtonNereson and others, 2000) ; (2) GPS measurements of horizontal velocity u
s(x) of 33 survey poles positioned along a flowline on the south flank of Siple Dome (Reference NeresonNereson, 1998); (3) field measurements of ice thickness h(x) from radio-echo sounding (Reference Raymond, Nereson, Gades, Conway, Jacobel and ScambosRaymond and others, 1995; Reference Jacobel, Scambos, Nereson and RaymondJacobel and others, 2000); and (4) two assumed functions for W(x) which bracket a reasonable range of possible flowline divergence patterns: W(x) = 1 (no divergence), and W(x)/W(0) = (x/λ)2 +1, where λ = 35 km (Reference NeresonNereson, 1998). The main contributions to errors in estimating ∂
t
h are uncertainty in the flowline separation function W(x) and the inferred spatial accumulation pattern b(x).
to the surface velocity u
s(x), and W(x) describes the relative distance between adjacent flowlines. The righthand side of Equation (11) is determined from: (1) an accumulation pattern b(x) inferred from radar measurements of internal layers in the ice (Fig. 6a; Reference Nereson, Raymond, Jacobel and WaddingtonNereson and others, 2000) ; (2) GPS measurements of horizontal velocity u
s(x) of 33 survey poles positioned along a flowline on the south flank of Siple Dome (Reference NeresonNereson, 1998); (3) field measurements of ice thickness h(x) from radio-echo sounding (Reference Raymond, Nereson, Gades, Conway, Jacobel and ScambosRaymond and others, 1995; Reference Jacobel, Scambos, Nereson and RaymondJacobel and others, 2000); and (4) two assumed functions for W(x) which bracket a reasonable range of possible flowline divergence patterns: W(x) = 1 (no divergence), and W(x)/W(0) = (x/λ)2 +1, where λ = 35 km (Reference NeresonNereson, 1998). The main contributions to errors in estimating ∂
t
h are uncertainty in the flowline separation function W(x) and the inferred spatial accumulation pattern b(x).
The shaded region in Figure 7 represents ∂ t h inferred from measurements, and the range includes uncertainties in the measurements and the function W(x) (Reference NeresonNereson, 1998). The measurements suggest that the south flank of Siple Dome is thickening rapidly in a zone about 40–70 km from the divide. The thickening rates predicted by the FD model for 100, 300 and 500 years since stagnation of DF are shown with thin lines. The character of the thickening inferred from measurements (shaded region) is similar to the thickening pattern predicted by the FD model for 200–500 years after stagnation of the DF area, with the maximum thickening rates occurring at the former junction of Siple Dome and the ice stream. This comparison also suggests that stagnation of the DF area occurred 200–500 years ago. Survey poles measured along the north flank of Siple Dome do not coincide with an ice flowline. Therefore, a similar calculation is not possible for the SIS area given existing data.
Shaded area shows the thickening rate inferred from field measurements using Equation (11). Curves show predicted thickening-rate pattern from the FD model at 100, 300 and 500 years since stagnation of the DF area.

Discussion
For the Siple Dome calculations, the ice-stream margin at the edge of the domain is held fixed at its initial elevation by the activity of an adjacent actively streaming region outside the domain. The age of the scar features (SIS and DF) is inferred from their present elevation relative to the actively streaming regions. In reality, actively streaming regions thicken and thin over time, changing the assumed boundary condition and the reference elevation level. However, if the relict ice stream is sufficiently wide (l > 10H) small elevation changes at the boundary of the domain do not initially affect the evolution within the domain. For example, evolution of the ridge/ice stream at the position of the scar feature is the same for t < τ * regardless of the prescribed elevation history at the domain boundary (Fig. 4). Since Siple Dome is qualitatively in the early stages of dome/stream evolution, the assumption that the elevation at the new ice-stream boundary is fixed does not affect the quantitative estimate of the age of the relict flow features at the edges of Siple Dome.
Even when the area outside the domain is rapidly thinning, scar features are initially elevated for a short period as a result of accumulation and build-up of ice flow at the ridge-stream junction. Estimates of past ice-sheet surfaces from scar-feature elevation alone would overestimate the elevation of the past ice surface. Measurements of spatial pattern of thickening such as those shown in Figure 7 could be used with the FD model to determine the approximate age of stagnation. Integration of ∂ t h over this time interval would give the elevation of the scar feature at the time of stagnation. This method would give a more accurate estimate of ice-sheet elevation at the time of ice-stream stagnation. In the case of DF, this integration predicts that the relict margins were 40–80 m below their present level at the time of stagnation. Since the scar features now lie about 20–30 m above the present level of Ice Stream C, it is possible that Ice Stream C was 10–60 m thinner before stagnation of the DF area 200–500 years ago. Radar measurements of buried crevasses could further constrain the shut-down age and allow more accurate estimates of pre-stagnation elevation.
The slope discontinuity at the ice-ridge/ice-stream margin interface in the FD model is not physically realistic. In the model, ice flow from the dome proceeds as if the ice stream does not exist, and the ice flux to the ice stream is determined by the ice thickness and slope at the ice-stream margin (Reference Hindmarsh and PeltierHindmarsh, 1993). The model includes no longitudinal coupling between the ice dome and stagnated ice stream. This assumption is valid for modeling the general evolution of the ice sheet, but not for modeling the specific behavior at the ice-ridge/ice-stream transition where the scar feature is formed (Reference Hindmarsh and PeltierHindmarsh, 1993). On some small scale (O(H)), there is a transition zone between the ridge and the ice stream at t = 0. Accurate modeling of this zone at small t when the surface slope varies abruptly over this region requires consideration of longitudinal stress gradients. In addition, the transition zone must be initially concave in profile so that the ridge/stream boundary is smooth. Exclusion of these effects contributes to errors in the FD prediction of scar elevation at small t.
These errors do not affect the main conclusions. The elevation of the scar feature is constrained by the general evolution of the dome. After 100 years, the slope discontinuity is smoothed out and longitudinal stress gradients (∂xHσxx ) become small again (compared to ρg∂xh). The errors affect the particular evolution of the scar feature, but not the general character of thickening. Thus, the order-of-magnitude estimates for the age of the shut-down of the stagnated ice streams are unchanged.
Three-dimensional effects will affect the transient behavior of the ice sheet. The transient behavior of a three-dimensional dome is controlled by the local flux into the former ice-stream area. Areas of the dome with large slopes and ice thickness will expand more quickly. Therefore, scar features may not be elevated uniformly. At any given instant in the early evolution process, the scar feature may exist at several elevations along its length. Ultimately, the transient effects diminish and the evolution of the dome is governed by the volume-response time-scale.
Thermal or crystal-fabric evolution of the ice-stream margin area is not addressed in this paper. After stagnation, the ice stream is assumed frozen to its bed and rheologically indistinguishable from ridge ice. Reference Jacobson and RaymondJacobson and Raymond (1998) have shown the likelihood for basal heat concentration at the margin of an active ice stream. Concentrated heating of the ice at the ice-stream margin and the presence of water at the bed would affect deformation properties of the ice stream. However, these effects on the large-scale evolution of the ridge/ice-stream system are second-order and do not affect the conclusions presented here
The recent shut-down age implied for SIS and DF has implications for the explanation for the divide migration toward Ice Stream D which has likely persisted for at least the past 1000 years (Reference Nereson, Raymond, Waddington and JacobelNereson and others, 1998a). In order to cause the inferred divide migration, changes occurring at boundaries of Siple Dome must also have persisted for at least 1000 years (Reference Nereson, Hindmarsh and RaymondNereson and others, 1998b). The more recent shut-down age predicted by this analysis does not support the hypothesis that the divide migration is caused by thickening of SIS since its stagnation. The thickening inferred along the south flank of Siple Dome is also a recent event (< 500 years) and would tend to move the divide in the opposite direction to that inferred from the internal layer pattern (Reference Nereson, Raymond, Waddington and JacobelNereson and others, 1998a). It appears that the recent stagnation of these flow features is not the cause of the divide migration. A remaining possibility is past activity of the now-relict flow features when they were active. In particular, gradual (0.01–0.04 m a−1) thinning of the south margin of Siple Dome associated with past streaming activity of Ice Stream C and DF would move the divide in the observed direction (Reference Nereson, Hindmarsh and RaymondNereson and others, 1998b).
Conclusions
Topographic features left by relict ice-stream margins can be elevated relative to the former streaming surface by growth of the adjacent ice-stream ridge. Interpretation of the elevation of former flow features for the past configuration of ice streams or ice sheet may therefore be complicated. The time-scales governing the evolution can be estimated from the geometry and accumulation rate associated with the ice-ridge/ice-stream system as in Equation (9).
The modern elevation of scar features and the modern geometry of a ridge/stream system can be used to estimate the timing of ice-stream stagnation. For Siple Dome, the volume-adjustment time-scale relevant to SIS on the northeast flank is about 1700 years. The present geometry and elevation of Siple Dome and its existing scar features suggest that Siple Dome is in the early stages of evolution where t < τ *. Based on this analysis, shut-down of SIS probably occurred in the past 500 years. This age is consistent with other estimates based on analysis of the internal stratigraphy across the feature (Reference GadesGades, 1998; personal communication from B. Smith, 1998). The scar features on the south flank of Siple Dome could be associated with a flow regime which shut down nearly synchronously with SIS.
An independent estimate of stagnation age can be obtained by calculating modern values of ∂ t h from field measurements of ice thickness, accumulation rate and surface velocity and comparing the result to values predicted from the FD evolution model. Integration of ∂ t h can be used to estimate ice-stream elevation at the time of stagnation. These measurements are available for the south flank of Siple Dome and suggest a shut-down age of 200–500 years and a pre-stagnation elevation of the DF area of 20–60 m less than its modern value.
Acknowledgements
I am grateful to C. Raymond, E. Waddington and T. Scambos for valuable discussions, and to two anonymous reviewers whose comments led to significant improvements to the paper. This work was funded by U. S. National Science Foundation grant OPP-9316807.
Appendix: Adjustment Time-Scale
The volume-filling time-scale for the evolving ridge/stream system is the time it takes to fill the volume V per unit width, denoted by the stippled region in Figure 2, given the spatially constant accumulation rate b over the domain length D:

For a perfectly plastic ice sheet, V has an exact analytical solution. Consider a perfectly plastic ice sheet on a flat bed with thickness h(x) and horizontal coordinate x. Its thickness profile is given by the solution to the force-balance equation,

where σ b is the basal shear stress. Assuming σ b is everywhere equal to the yield stress σ b, the surface profile is given by

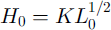
where K = 2σ b/ρg and L 0 is the initial span (Reference NyeNye, 1952).
Integrating Equation (A3) with respect to x for the initial (subscript “0”) and final (subscript “f”) profiles yields the non-truncated volume change:

The ice-stream volume is

where the ice-stream width l is equivalent to L f − L 0. The volume of interest V is then


Assuming the ice-stream width
 is some fraction
 of the initial span L
0, and its height h
0 is some fraction
of the initial span L
0, and its height h
0 is some fraction
 of the ice-sheet thickness H
0, then
of the ice-sheet thickness H
0, then
 and
and
 . Substituting these expressions,
 and V into Equation(A1), the characteristic time required for the ice sheet to evolve to its final state is



