


1. Background
The concepts of “balance flux” and “balance velocity” go back a long way (e.g. Budd and others, 1971) and refer to the conditions for steady state in a glacier or ice sheet such that the outward-flow distribution exactly matches the net accumulation, and consequently there is no ice-thickness change with time at any point. To be more precise, if over a horizontal (x, y) domain, A(x, y) is the net surface accumulation (or ablation rate) in ice-equivalent volume per unit area per unit time and M(x, y) is the net basal melting (or freezing rate), then at any point, with ice thickness Z (again in ice-equivalent units) and depth-averaged horizontal velocity  the steady-state balance condition implies that

In this context, the divergence operator acts over the x, y domain and may be represented as

where (i, j) are the unit vectors in the directions x and y.
An appropriate version of Gauss’s divergence theorem may be used to express Equation (1) in integral form. For any closed area S in the (x, y) domain where dl is the elemental line length along the boundary C and n is the outward-directed unit vector, normal to the boundary, the total gain (or loss) through the upper and lower surfaces is balanced by the net outward flow through the boundary, i.e.

The quantity Φ =  Z represents a vector horizontal-flux density for unit width (in km2 a−1) in the direction of flow. The quantity
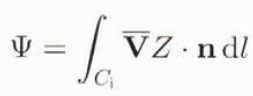
is a scalar flux integral representing the volume flux through the section C i of the boundary. The term Φ(x, y) will be referred to as the balance-flux distribution. The corresponding balance-velocity distribution is given by
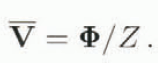
For many applications, there is interest in the variation of the velocity and flux along a flowline. For this case, if A(ξ) is the net accumulation (in absence of significant basal melt) at distance ξ along a flowline and η(ξ) is the width between a pair of neighbouring flowlines, one each side of the central flowline ξ, then the flux integral, from the start of the flowline to ξ, is given by

This technique was used by Budd and others (1971) to compute balance-flux and velocity distributions over the Antarctic ice sheet from a number of selected flowlines and an assumed accumulation distribution. The technique used by Budd and others (1971) was largely manually based with the time-consuming digitization of individual flowlines. Since then a variety of applications have been developed, as discussed below, using different schemes for automatic processing of digital gridded data sets to derive implied distributions of steady-state balance fluxes and velocities from prescribed distributions of net accumulation, surface elevation and ice thickness. So far, however, the details of an efficient numerical scheme for the procedure have not been presented. The purpose of this paper is to outline the basis and application of the current numerical scheme being used, which is rapid to compute, has an accurate integral-closure constraint and can be readily applied to a wide range of arbitrary ice-mass configurations specified by gridded data sets. The present computer code is freely available for general use from the authors.
2. Uses of Balance-Flux Calculations
Uncertainties in the flow properties of ice sheets stem from many factors, including uncertainties in the temperature distribution and in the nature and intensity of the ice-crystal anisotropy. Budd and Jacka (1989) showed enhancement of flow rates for anisotropic ice in tertiary flow under compression of about a factor of 3 relative to the minimum under compression of isotropic ice. For simple shear, the corresponding enhancement is about an order of magnitude. Strong anisotropy associated with horizontal shear appears to develop in the lowest third and fourth quartiles of depth but this may be greatly disturbed by flow over and around rough basal topography. Even greater uncertainties exist for the rate of basal sliding for ice.
As a consequence, the state of balance may be known in many cases to a greater degree of accuracy than the ice-flow or sliding properties. Also, since the balance-flux rates scale linearly with uniform fractional changes in the net surface balance over the domain, the balance-flux calculations can be used to assimilate a wide range of observations to construct complete distributions of derived features throughout the ice mass. This principle was used by Budd and others (1971) to compute a comprehensive range of derived features for the Antarctic ice sheet from the data available at that time. Similar results for Greenland have been presented by Budd and others (1982) and Radok and others (1982).
For glaciers, Budd and Allison (1975) showed that balance concepts could also provide the basis for the derivation of an extensive range of characteristics. Smith and Budd (1981) demonstrated that dynamic modelling of the response of glaciers to climate change could also benefit from rapid computations of balance fluxes and steady-state profiles. All of these studies used flowline-type techniques. An automatic numerical scheme for gridded data was devised and used for assessing the Antarctic mass budget by Budd and Smith (1985). Comparisons with observed velocities showed that the majority of points were indicative of a positive balance for the present accumulation-rate data. This same automatic gridded technique was used as an inverse technique to derive surface balances for the northern ice cap of Mars by Budd and others (1986). The use of Balance velocities also provided a useful technique, in the absence of observed velocities, to derive large-scale empirical relations for ice sliding of ice streams as given by McInnes and Budd (1984).
The power of the technique has been further illustrated by the application to basal-meltwater flux by Budd and Jenssen (1987). The basal-whaler flow rates are so high, compared with the ice flow, that the balance technique can be used for basal water in conjunction with time-dependent ice-flow modelling. An updated version of derived physical characteristics for the Antarctic on a 20 km grid was carried out by Radok and others (1986, 1987). Finally, the balance fluxes have been used to help tune the dynamic flow computations along with the limited observed surface velocities, e.g. Budd and Jenssen (1989) and Mavrakis (1993).
The balance-flux calculations now provide a powerful diagnostic tool for assimilating observations by adjustment of the fluxes at the observed points and then via continuity over the whole domain by best-fit statistical techniques. Since the basic procedure underlying the scheme has not been published, this paper presents the essential outline of the scheme and the basis of the numerical code.
3. Basic assumptions underlying the Balance-Flux Calculations
For the balance flux in its simplest form, if the distribution of surface elevation and net surface mass balance are given then, for negligible basal-melt flux, the horizontal-flux distribution can be derived from Equation (1) With certain assumptions:
-
i. The direction of ice flow is assumed to be orthogonal to the elevation contours. In practice, this assumption has been found to apply reasonably well for horizontal scales which are large (say 20 times) relative to the ice thickness, cf. e.g. Budd (1968), Budd and Young (1979) and Hamley and others (1985). For smaller scales, irregular bedrock can cause deviations in direction comparable with the corresponding fluctuations in slope, and basal, longitudinal and transverse stresses. Nevertheless, this assumption is also often used for large-scale dynamics modelling and it can be further tested by the comparisons with observations.
-
ii. The flux rector in the direction of flaw can be resolved into rectangular (x, y) components which can be suitably represented by finite-difference schemes to the resolution of interest. This entails that the grid-point density chosen is sufficient to represent reasonably the surface topography in enough detail to capture the essential flow characteristics. On the other hand, the small fluctuations in topography mentioned in (i) may need to be smoothed to represent properly the large-scale flow.
4. Data Sets Required
In the simplest form of application of balance fluxes, it is assumed that a surface-elevation data set is available and can be digitized into a regular rectangular (x, y) grid with grid spacing Δx, Δy, The spacing needs to be chosen to give sufficient detail, depending on the smoothness of the surface. No interior surface hollows (or exactly flat regions) are allowed (in the absence of net surface ablation). A corresponding digital data set for surface net accumulation is required over the same grid. These two data sets are sufficient to compute the balance-flux distribution implied by the condition of flow orthogonal to the elevation contours.
If data also exist for ice thickness or base elevation, then the balance velocities can also be computed from Equation (5). However, velocities can be calculated only at those locations where ice-thickness data exist, or are specified.
For more complex applications, if only some parts of these data sets are available, then the scheme could be used with inversion techniques or statistical assimilation methods to derive balanced, compatible, complete data sets.
5. Outline of Basic Algorithm
Only a brief outline of the basic principles of the scheme is given here with details available with the code from the authors. Many different numerical schemes can be used to represent the basic continuity Equations (1) and (4) with sufficient accuracy for the integral fluxes. In general, it has been found that for smooth data sets the results tend to converge for increasing resolution of the different schemes. The computer code has options for a number of these schemes. For simplicity, we consider here first a centred difference scheme for any point x i,j where the nearest neighbours are x i−1,j , x i+1,j x i,j−1 and x i,j+1.
The surface elevations at these corresponding points are denoted E i,j , E i−1,j , E i+1,j , E i,j−1 and E i,j+1.
The surface-slope vector components at x i,j are taken as

The magnitude of the slope is
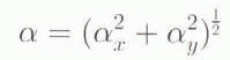
and the direction of the slope is at an angle θ to the x axis given by

This also represents the direction of flow and the orthogonal to the elevation contour through xi,j .
We take A
i,j
as the net accumulation at x
i,j
, Φ
i,j
= ( Z)
i,j
as the flux-density vector, and (n
δl)
i,j
as any line-element length vector intercepting the flow.
Z)
i,j
as the flux-density vector, and (n
δl)
i,j
as any line-element length vector intercepting the flow.
The resolved components of flux in the x, y grid directions may then be taken as

With the flow directions determined from the topography, a direct discretization of Equation (1) at each grid point would lead to a system of linear equations for the magnitudes of the vector-flux density at each grid point. For centred differences, this takes the form

This system could be solved by sparse matrix methods but this might be problematic as fluxes differ spatially by several orders of magnitude.
The key to the present scheme for determining the balance fluxes is to change the focus from the magnitude of the vector-flux density at each grid point Φ
i,j
to the total scalar flux of ice out of the (i, j) grid cell  and rewrite the discretized continuity Equation (3) as

where the total scalar influx of ice  is simply the sum of out-flowing contributions from neighbouring upstream grid points, and to apportion the outflow
  from the (i, j) cell into downstream neighbouring cells using the slope directions θ
i,j
.
from the (i, j) cell into downstream neighbouring cells using the slope directions θ
i,j
.
For example:

where these X and Y tractions of the scalar outflux,  ,
,  , contribute to the total influxes of the downslope neighbouring points in the x- and y-grid directions, respectively.
By sorting and treating the grid points in order of descending elevation, so that the total influx  is always known from the contributions of previously treated upslope points, the balance-flux integral out of each (i, j) cell can be straighforwardly calculated. This scheme allows the treatment of an arbitrary number of summits, ridges and basins in the elevation data set. For points of equal elevation, the relative order results directly from the order in the data array.
Using the scalar outflow and the slope directions, the vector flux-density field can be produced. We find that for some of the more Involved scalar outflux-apportioning schemes which we have used, simply dividing the outflow magnitude by the length of the grid-cell edge provides a good measure of the magnitude of the balance-flux density field.
This partitioning of the flux integral into rectangular fractions on the x, y grid is an approximation dependent on the finite-difference scheme used but it allows an exact accounting of the flux over the domain. The computation of the balance fluxes has also been found not to be very sensitive to the numerical form of the partitioning, provided the data fields are smooth and the resolution is adequate. As an example, an alternative normalized form of the flux-integral components  and
and  has been tried and has been found to give approximately equivalent results, i.e. with flux-integral fractions apportioned as

Similarly, more complex forms of the numerical grid or finite-difference schemes have been found to be not as important as the conditions of smooth fields and high resolution. For example, the staggered-grid formulation has the x, y components of flow towards and away from each point governed by the mid-interval slopes:


with corresponding relations for the mid-point flux integrals across the corresponding cell faces,  ,
,  ,
,  , and
, and  . The continuity equation for balance then allows the downstream flux to be computed from the upstream fluxes and the net accumulation rate through Equation (12) as before. For a staggered grid, the outgoing scalar-flux integral is partitioned between the cell faces in proportion to these positive (downslope) mid-interval slopes, e.g.

where N is the sum of all the positive (downward) mid-interval slopes from the point (i, j).
The staggered-grid scheme above can be modified to include the diagonal downslope neighbouring grid points by extending the role of the mid-interval slopes to include all elevation différences to the neighbouring points and scaling the diagonal directions by  . A corresponding modified form of Equation (16) is used to partition the outflows. This scheme has been found to relied curved topography more accurately when using coarser grids.
The routine provides that the net accumulation is distributed as flux progressively downslope to the outward boundary. For any closed domain, the integral over the region of accumulation (S) necessarily equates to the outward flux summed around the boundary (C) to the precision of round-off error, i.e.

This corresponds to the discrete form of Equation (3) neglecting basal melt. A more detailed analysis of the approximations and validity of the various numerical schemes will be presented elsewhere. Here, the emphasis is placed on an illustration of the application. It suffices to say that the discrepancies between the numerical schemes result primarily in small differences between neighbouring cells but very little difference in the fluxes across the outflow sections compared with the differences resulting from the alternative data sets as shown below.
6. Application to the Whole Antarctic Continent
Previous applications of this type of analysis have been carried out for the whole of Antarctica by Budd and Smith (1985) and with subdivisions for the major regional drainage basins by Radok and others (1986). The method is useful for assimilating new data and evaluating the state of balance and the dynamics. As an example, Figure 1 shows the distribution of balance fluxes computed from the accumulation distribution of Budd and Smith (1985) and their corresponding surface-elevation data sel digitized on a 20 km grid from Drewry’s (1983) folio map. This type of output was used by Budd and Jenssen (1989) to assess the state of balance by comparison with observations of fluxes obtained from products of surface velocities (V s) and thickness (Z) at points over the continent. There are now many more points for which such an evaluation can be made but this may be more appropriate for separate regional studies as shown below. The results can also be used to assess the ice-dynamics formulations as shown by Budd and Jenssen (1989). The balance and observations intercomparisons indicated that most of the continent is within about ±50% of balance and large areas within ±20%. Because of the uncertainties in basal temperatures, the ice-crystal anisotropy and the flow and sliding properties of ice, it is difficult to compute the velocities or fluxes (a priori) to this degree of precision, The balance fluxes, normalized to the observations, can be used to evaluate the dynamics formulations in relation to the ice-sheet stresses and other features. For this paper, we wish to emphasize that with new improved data sets for surface elevation and accumulation rate, the balance fluxes provide an even more accurate and powerful means of assessing both the state of balance and the ice dynamics. This is done by a re-analysis of the Wilkes Land observed fluxes previously examined by Hamley and others (1985) but using the new surface elevations derived from satellite-radar altimetry and additional surface-traverse observations from Medhurst (unpublished) and Hazelton (unpublished).
The pattern of ice-balance flux density over the Antarctic continent is shown as calculated from the balance-flux scheme using the SPRI-based elevations on a 20 km grid and the present-accumulation data set of Budd and Smith (1985). The graduated shading is shown using a log scale in units of km2 a−1. Over the ice shelves, the downslope flow is less applicable.

7. Wilkes land comparison of balance fluxes with observations
Hamley and others (1985) used the SPRI-based elevation data set to assess the state of balance of the Wilkes Land region by comparison of balance fluxes with observed values of surface velocity (V s) and ice thickness for V s Z. They concluded that the region was close to balance with the accumulation data set used, and using an implied column-average velocity to surface-velocity ratio of 0.89. Nevertheless, their traverse profile results showed a number of large discrepancies between computed and observed fluxes. Since then, additional traverse data have become available for the line between Casey and Mirny, and relatively high-resolution accurate surface elevations with practically complete coverage over the basin have become available from satellite-radar altimetry (Bamber, 1994). Bamber supplied these data analysed on the same 20 km grid as that used by Budd and Smith (1985) for the SLRI-based data. The satellite data provide a far more comprehensive basis for flow directions and computed fluxes. To illustrate this, a re-analysis of the interior and coastal (near 2000 m elevation) Wilkes Land traverse lines was carried out using the same accumulation data set and the same balance-flux algorithm but with the two different elevation data sets. The traverse lines are shown in Figure 2 with the points marked where the observed velocities used to compute fluxes were available. Comparisons between the two different balance-flux calculations and the observations along the traverse lines are shown in figure 3a and b.
An enlargement of part of Figure 1 over the Wilkes Land region is shown with the traverse routes inland of Casey: (1) near the 2000 m contour from about 93° E to 128° E; and (2) from Mirny to Pioneerskaya and Dome C. The locations where both surface velocities and ice thickness were measured are shown by the circles. The balance fluxes are shown in units of 10−2 km2 a−1.

The balance fluxes ( Z) computed along the traverse routes as derived from the SPRI-based elevations (dotted lines) and the ERS-1 elevations (full lines) compared with the surface-velocity and ice-thickness products (VsZ) from the observations (circles). The satellite elevations give rise to much closer spatial matching with the pattern from the observations. (a) Dome C to Mirny; (b) near the 2000 m elevation line from east to west. Units are in km2 a−1.

A summary of the mean flux calculations and correlations with the observations are given in Table 1. It is clear that the fluxes computed from the satellite-derived elevations represent much better the observed character of the flow. The strong flux in the major ice streams penetrates a long way inland and is noticeable to elevations over 3000 m. In both cases, the observed fluxes for the coastal line appear close to balance, depending on the ratio of column average to surface velocity. However, the spatial pattern of the satellite-elevation fluxes is much closer to the observed with much higher correlation coefficients between calculated and observed fluxes.
Comparison of fluxes (VsZ) from observations (Obs) with those computed from balance ( ) using satellite (ERS) elevations or the digitized (SPRI) map, shown for the inland line (In) and coastal line (Co)

For the more inland region, a positive balance of about 35% of the surface-accumulation rate is implied using an average to surface-velocity ratio of 0.87. This value is chosen as a broad-scale interior average from the range given by Budd and others (1971) of 0.85–0.92, going from the interior to the coast in this region. This would imply a rate of rise of the region’s interior to this line around 1–2 cm a−1. More detailed studies of the balance and dynamics will be treated in a separate paper. Here, it suffices to say that the improved surface-elevation data set will lead directly to improved estimates for the velocity and flux distributions over Antarctica.
8. Future Prospects and Conclusions
So far, the satellite-elevation data set only reaches to about 82° S. Nevertheless, many of the large accumulation basins of East Antarctica such as Wilkes Land and the Lambert and Shirase Glacier basins are completely covered. Eventually, complete satellite-elevation data may be obtained but in the interim much can still be done with a composite data set consisting of the satellite data to 82° S and the interpolated ground-based elevations further south. Additional surface velocities measured at strategic locations can then go a long way towards assessing the current distribution of the state of balance over the ice sheet or the expected rate of change of surface elevation (∂E/∂t). This then puts the emphasis on obtaining improved data sets for surface net accumulation and for the column-average to surface-velocity ratio (λ = 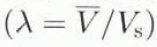 /V
s
), which is now contributing significantly to the remaining uncertainty. Eventually, from satellite altimetry (radar and laser), it should become possible to derive the rate of elevation change with time. Then, it will also become possible to derive the actual fluxes, from the existing routine, by distributing the quantity (A– ∂E/∂t) downslope over the surface.
/V
s
), which is now contributing significantly to the remaining uncertainty. Eventually, from satellite altimetry (radar and laser), it should become possible to derive the rate of elevation change with time. Then, it will also become possible to derive the actual fluxes, from the existing routine, by distributing the quantity (A– ∂E/∂t) downslope over the surface.
Acknowledgements
The authors wish to thank Dr J. L. Bamber of the Mullard Space Laboratory, University College London, for providing his data set for surface elevation from the ERS-1 satellite altimetry. The Wilkes Land traverse data were supplied from reports of the ANARE glaciologists: T. Hamley, T. Medhurst and W. Hazelton, and from N. Young, who supervised the traverse programmes, and to whom the authors wish to acknowledge their thanks.



