


Introduction
Improved data governance and access has the potential to transform the ways we live and work (Ritchie, Reference Ritchie2021; KPMG-Atkins, 2021). However, without accurate methods for measuring its value and understanding the mechanisms through which this value is created, the likelihood is that investment in this area will be sub-optimal. This is not a straightforward problem: data governance is an intangible concept that is woven across data management; understanding the value of good data governance requires a breadth and depth of information.
The challenges are heightened for agriculture based in rural communities where traditionally data infrastructure is slower to roll out. This can be further compounded in low- and middle-income countries (LMICs), where national and regional statistical infrastructures are under development.
In 2019, an attempt was made to measure the value of improving data governance and access in the GIZ-led, Bill & Melinda Gates Foundation-funded Supporting Soil Health Interventions (SSHI) project in Ethiopia (see Whittard et al., Reference Whittard, Ritchie and Nyengani2021). In order to do so, the study applied two separate but interlinked models to create an innovative framework that provided new insights into how and where value is created.
The Five Safes data governance model, widely used in data management but not in evaluation, was used to structure a qualitative investigation. The interviewees identified both tangible and intangible outcomes that should be measured as part of the wider economic and social benefits. This qualitative design was then used to structure a more traditional quantitative case study. This is an important step forward as social and public benefits of data governance have rarely been identified and quantified, particularly in developing countries. Such evidence can then help inform policy, shaping direction and economic growth of the country.
By combining the quantitative and qualitative framework, the study demonstrated that it is possible to generate plausible and credible quantitative estimates of both costs and benefits of data governance and access.
This study describes the new approach, the challenges faced by the project, and the lessons learned from implementation. Specifically, we
-
Develop a theoretical framework for estimating the value of data governance and access in agricultural projects in developing countries.
-
Demonstrate the application of the framework by evaluating the SSHI project in Ethiopia, while identifying the mechanisms through which value is created.
The paper concludes by suggesting some potential next steps in order to move this nascent process forward.
Materials and Methods
Desk research on previous attempts of valuing data governance and data access
A review of research material revealed that the benefits of improving data governance and access are widely acknowledged (European Open Data Portal, 2017; OECD, 2019; HM Treasury, 2018a). For example, McKinsey (2013) reported that open data had the potential to increase global GDP by $3 trillion annually, while Lateral Economics (2014) suggested that more open data could provide over half the G20’s 2% growth target. Although providing exact estimates is challenging, even in developed economies with well-developed statistical systems, the evidence suggests that nations can make considerable economic gains by improving data governance and access.
To estimate these gains, economic evaluations normally tend to take the form of a cost–benefit analysis (CBA), following a standard structure (HM Treasury, 2018b). To undertake a detailed CBA, the evaluation needs considerable amounts of well-defined, measurable, high quality data; all of which can be converted to a market price (Baker, Reference Baker2000; Raitzer, Reference Raitzer2003; Whittard et al., Reference Whittard, Ritchie and Nyengani2021).
In data related projects, this is potentially problematic. Data, data governance, and data access are intangible in nature and therefore difficult to define and measure (Corrado et al., Reference Corrado, Hulten and Sichel2009). Wdowin and Diepeveen (Reference Wdowin and Diepeveen2020) argue that data are neither a good nor a service, are not homogenous and, depending on the nature of the data, can be viewed as a “public good” making estimating a market price all the more challenging.
Even if it were possible to clearly define and therefore measure all concepts, a robust evaluation would need to be supported by a complex system of data collection, both within and external to the project. The experience of most economic evaluation experts, however, is that the planning for such evaluation starts too late and is carried out too soon after project completion for outcomes and impacts to manifest (Belmana, 2018).
Wdowin and Diepeveen (Reference Wdowin and Diepeveen2020) conducted a wide-ranging review to inform understanding of how value of data is generated and what approaches can be taken to measure this value. They concluded that it was important to identify the value for the different stakeholders across the value chain. Bergemann and Bonatti (Reference Bergemann and Bonatti2018) discuss the importance in market structure (e.g. monopoly, oligopoly, competitive) and resulting pricing strategy in understanding how the value will be shared along the value chain.
A number of different approaches have been used to measure value. PWC (2019) propose that the cost approach can give useful upper and lower valuation bounds. Mawer (Reference Mawer2015), however, suggests that data should be viewed as an intangible asset from which an income-based valuation approach can be taken based on estimating future cash flows. A key challenge with this approach is the difficulty of estimating a service length life of such an intangible, and therefore rate of depreciation. The third and most common approach is to use market-based data to approximate value; this can be achieved by either directly using a market price or indirectly taking the market price of an equivalent product. This again can be problematic due to the characteristics of the data. However, what is clear from the literature is that most estimates of valuation are economic and market-based, and there is limited discussion on the social and public evaluation of data (Wdowin and Diepeveen, Reference Wdowin and Diepeveen2020).
The value of agriculture projects in LMICs
CBA techniques have been used extensively to estimate the economic value of agriculture sector projects in LMICs (Baranchuluun et al., Reference Baranchuluun, Bayanjargal and Adiyabadam2014; Gotsch and Burger, Reference Gotsch and Burger2001; Lemaga et al., Reference Lemaga, Sekitto, Nsumba, Natabirwa, Namutebi, Owarwi and Tindiwensi2005; Mittal, 2018; Nkang et al., Reference Nkang, Ajah, Abang and Edet2009; Sain et al., Reference Sain, Loboguerrero, Corner-Dolloff, Lizarazo, Nowak, Martínez-Barón and Andrieu2017). These studies, however, were focused on the value of the project itself and provided no insight into the value of improved data governance and data access or how this was created.
Although not specifically focused on improved data governance, there are a number of explicit studies on information, communication and technology (ICT) type projects in LMICs. For example, Lio and Liu (Reference Lio and Liu2006) model aggregate production functions across multiple countries and argue that ICT does provide a positive return on investment (albeit lower in LMICs than in high-income countries). Ngwenyama and Morawczynski (Reference Ngwenyama and Morawczynski2009) investigate macroeconomic effects of ICT investment in Latin America, using a variety of techniques including econometrics models. They find that the effectiveness of such investment is strongly determined by the existing economic conditions and infrastructure at the time of the investment.
There is also evidence from detailed studies that look at data explicitly. For example, GODAN (2018) used data flows to structure their conceptual analysis of the opportunities from improved data access. GODAN (2016) notes, however, the exporting of data can cause concerns for the farmer who sees potential commercial gains for others rather than his or her own benefit. Regardless of outcome, Carletto et al. (Reference Carletto, Jolliffe and Banerjee2015)’s detailed study argues that there is a fundamental problem to be considered before the impact of improved data access can be established; this is the lack of quality agricultural data.
Overall, the desk research revealed that deriving the value of improved data governance and access is a very challenging, particularly in the absence of a dominant typology. The challenges appear to be amplified in LMICs demonstrated by the lack of work published on the value of data governance and access, part of which may be related to the difficulty in accessing evaluation data. The study attempts to fill this gap by developing and testing a new framework to estimate the value of improved data governance and access.
Methodological approach
There were three methodological stages to the study
-
Define key terms and project selection
-
○ Review of project documentation
-
-
Qualitative data collection:
-
○ Interviews (pilot, first and second round)
-
-
Quantitative data collection
-
○ Questionnaire.
-
Defining terms and project selection
To collect information on the value of data governance and access, the first task was to agree terminology. A workshop between funders and researchers approved the working definitions:
Data governance:
-
a framework for assigning decision-related rights and duties in order to be able to adequately handle data as an asset (Otto, Reference Otto2011, p.47).
Value:
-
The extent to which the project delivered value by meeting its commitments (e.g. project outcomes in relation to cost savings/investments).
-
The additional value to users.
-
The additional value to other stakeholders.
The second task was to be able to identify which project would make the most appropriate case study. Following an iterative process where various Gates Foundation-funded projects were considered and pilot interviews completed, the SSHI project was selected.
The overall objective of the project was to provide proof of concept for the impact of leveraged geo-spatial soil, agronomic, and health data on transformative agricultural development.
The specific aims of the project were to:
-
increase the quality, efficiency, and reach of government and private sector services;
-
improve national and regional resource allocation and policies; and
-
increase the quality, availability, and utility of data and evidence.
In order to meet the aims, the project was further broken down into six work packages:
-
WP 0. Conduct an inception phase to analyze data needs and bottlenecks, assess gaps for the “Use Cases,” and mobilize stakeholders.
-
WP 1. Craft a policy for stakeholders across organizations to share data and collaboratively develop solutions to easing Ethiopian soil system bottlenecks.
-
WP 2. Provide technical and operational support for, and facilitate inter-institutional consultation needed to establish, the Ethiopian Soil Resource Institute as the national IT host for a centralized data repository.
-
WP 3. Help convert the Ethiopian Soil Information System (EthioSIS) into a geo-spatial database with online access to serve users from a variety of sectors and with differing needs.
-
WP 4. Develop IT-assisted use cases to provide proof of concept for the impact of geo-spatial soil, agronomic, or health data.
-
WP 5. Link up and collaborate with several currently active investments that have complementary initiatives relevant to soil health, fertilizer use efficiency, and transformative agricultural development.
The final task was to isolate activities undertaken in the SSHI project that were (primarily) focused on improved data governance and access.
The final decision on which activities were in scope was taken by the research team following workshops with two partners (i.e. Centre for Agriculture and Bioscience International (CABI) and the Open Data Institute), review of documentation, and feedback from the pilot interviews.
Of the six project work packages, Table 1 lists the three work packages and associated activities within each work package that were identified as within scope.
Work packages and activities

Source: project documentation.
The team reviewed traditional methods for economic evaluation but decided that these fell short for two reasons. First, there was insufficient existing data to carry out a statistical study. Second, there was considerable uncertainty on how to identify the specific governance effects.
After alternative methods were explored, the review team proposed a novel solution based upon a two-stage process: a qualitative review employing an innovative structure, which would then inform data collection for a quantitative study using techniques that are more conventional.
Qualitative data collection
Qualitative data collection was structured using the “Five Safes” framework. Table 2 provides a brief description of the five safes, with a fuller description on the framework available via the supplementary information section.
The basic Five Safes framework

Source: adapted from Desai et al. (Reference Desai, Ritchie and Welpton2016).
The Five Safes is a recognized framework widely used to structure data governance planning; however, to date it has not been formally applied in evaluations. The framework was chosen to structure discussion as it is designed to allow data governance to be seen as a series of separable but inter-related operating dimensions.
The initial structure was developed and sent to CABI and its partners for review ahead of its formal application in the interviews. Following feedback, the framework was refined ahead of the first round of interviews.
Initially, a pilot semi-structured interview was completed with the two project managers to identify key themes. Within the initial interview, the participants were questioned on an understanding of the framework. As an initial framework, it elicited little opinion one way or the other, the framework was adopted for all subsequent interviews.
A snowballing sample methodology was used to identify further key personnel to interview. Following the pilot, four subsequent interviews with six individuals were completed (two in round one and two in round two). All interviews lasted approximately an hour and were digitally recorded and transcribed with permission from the respondents. The aims of the interviews were:
-
To test the suitability of the Five Safes as a framing mechanism
-
To gain a deeper understanding of the mechanisms and nuances by which value had been created through improved data governance and access
-
To structure the subsequent quantitative data collection.
Quantitative framework
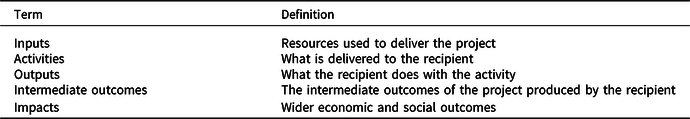
As in a standard CBA, the quantitative evaluation was to be based around developing a project specific theory of change (see Table 3). This would have to be tailored to the project context, depending on who is the recipient in the project context.

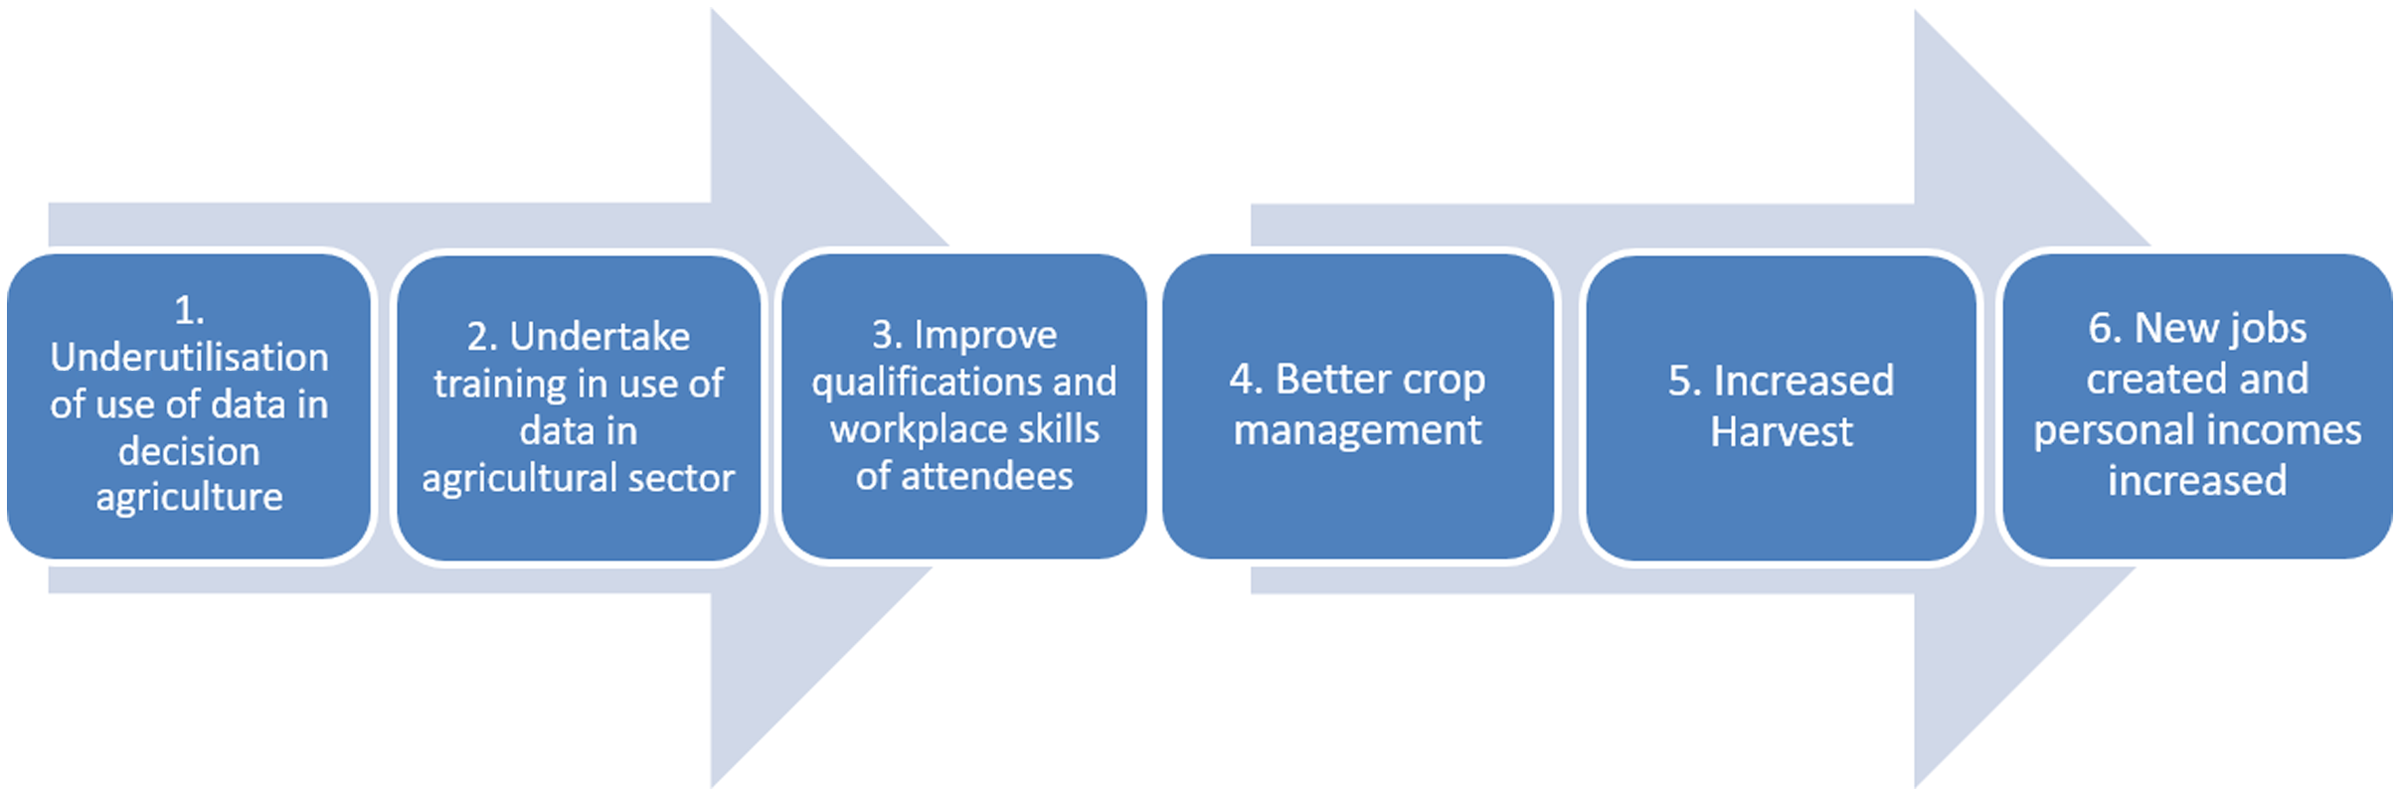
The mapping process involves identifying the start- (the challenge) and the endpoint (the overall objective), and then building a pathway between the two. It should also be tailored to the project context (i.e. who are the specific beneficiaries). In the absence of a sufficiently detailed theory of change to evaluate each work packages/activity, Figure 1 provides an example of a theory of change created by the project team, to understand how capacity-building investments in human capital could lead to improved downstream economic impacts.
Project specific theory of change. Source: authors’ model.
This CBA framework was used to guide the approach used to estimate the impact quantitatively. Costs are measured as the financial cost of funding the work package/activity. Benefits relate to measurable outputs, outcomes, and impacts observed from the work package/activities. However, given the limited availability of data generated within the project in relation to the value of data governance and access, it was recognized that any quantitative evaluation would be partial and at best illustrative.
To improve the quality of the data collection process, the results from the first round of interviews, which were structured on the Five Safes framework, were mapped against the theory of change developed for each sub-project.
Mapping the two distinct but interlinked frameworks (Five Safes and CBA) provided a more comprehensive overview of the potential impacts of each of the projects/activities and the mechanisms through which the value is created.
This then helped shape data collection by guiding the remaining interviews and informing the development of the questionnaire. This iterative process, illustrated in Figure 2, ensured that the quantitative and qualitative approaches both informed and were informed by both analytical frameworks.
Combining the framework. Source: authors’ model.

A detailed questionnaire was developed to gather quantitative data on the potential value of data governance. To limit respondent burden, questionnaires were personalized: questions were only asked of respondents on the parts of the project for which they had prior knowledge. Participants were informed any information provided would be confidential, with all questionnaires coded for analysis and then destroyed. Results were only reported at the aggregate level. The questionnaire was sent out to 12 experts with knowledge of particular aspects of the programme; eight were returned. While recognizing that this is a small sample, given that all who were surveyed were experts in at least some aspect of the project, including one project manager, the quality of the data collected was expected to be high.
The experts were asked to respond to all questions in their personalized questionnaire, even if uncertain about the estimates. To account for different levels of certainty, the questionnaire asks how confident the respondents are in the accuracy of the answers. This was used to weight any aggregate estimates when combined with other responses. Given the potential language and cultural challenges (the questionnaire was written in English but would be completed by mainly Ethiopian experts) the following additional support was provided:
-
A guide created on how to complete the questionnaire, including worked example
-
Questionnaire piloted and supporting guide reviewed by CABI staff in UK
-
Full questionnaire and support documents reviewed by CABI Ethiopian staff ahead of circulation
-
You Tube video created with an overview of the project, its aims and instructions for completing the questionnaire
-
CABI Ethiopian staff provided support on the ground to the experts completing the questionnaire.
Results
Results: qualitative study
The results from the interviews are summarized below under the heading of the Five Safes and are discussed in terms of challenges, best practice, and then implications for quantitative assessment.
Safe projects
Challenges
The full value of the project would only be achieved in the long term: For example, the interviews revealed that the genesis of the project went back to when the government was preparing its 10-year Soil Health and Fertility Improvement Strategy. In particular, the interviewees identified three main issues that needed to be addressed:
-
absence of comprehensive datasets to develop evidence-based strategy
-
data collected through public funds remained with researchers and were not necessarily shared
-
data were collected in different formats, for different purposes, and quality was not consistent.
The inference is that, at least from the government perspective, the full value of the project will only be achieved once all three issues are resolved.
Value is multifaceted and means different things to different people: The interviews revealed that there was no agreed definition of value and therefore how it should be measured. What was clear, however, was that stakeholders interpreted this concept to be multifaceted and much wider than just financial and economic.
Much of the value is generated by intangible mechanisms that do not lend themselves to quantification: For example, interviewees believed that considerable value was being generated due to a change in culture. The new culture that the project was encouraging individuals and organizations to exchange data and consider a more formal process for doing so.
It is challenging to set the boundaries of where value is created appropriately: The clearest example of this was when stakeholders identified spill-overs beyond the scope of the original project, particularly in relation to the wider agriculture sector. The inference is that the indirect value could be considerably larger than the direct value of the project itself.
Institutional challenges: Political and institutional instability, delays caused by institutional arrangements, and a stakeholder engagement plan that was too narrow were all cited as potential challenges to maximizing value. For example, there was some evidence of dissatisfaction in planning delays as a result of debates about whether to include data for the whole of the agricultural sector. Eventually, it was agreed that policies were to be limited to the agronomy sector, allowing for lessons learned to be applied later to the broader agricultural sector.
Value and ethics: In order to maximize the value of this project, while ensuring the project adheres to the highest ethical standards, it is important that there is engagement with a diverse set of stakeholders. The challenge with stakeholder engagement is that it is time consuming and potentially costly. The evidence here, however, is that with more time and with wider engagement, particularly in relation to regional policymakers, practical and ethical concerns can be identified and addressed in order to maximize value.
Best practice
Legacy effects: An unexpected spill-over effect was that the informal coalition created had a life beyond the project and was able to contribute to the evidence base needed to address other contemporary challenges such as the Covid 19 pandemic. This illustrates the difficulty of ascertaining value; a solution to improve data governance in the agronomy sector of Ethiopia found a substantial secondary purpose supporting the wider economy.
Building a diverse coalition: The project was able to build a coalition of international, national, regional, and local stakeholders which safeguarded that the project adhered to the highest ethical standards. Experienced government and non-government stakeholders ensured that the correct skills, knowledge, and levels of influence were in place to deliver the project, while combining experienced international and local institutions ensured that learning from previous projects was also taken into consideration.
Implications for quantitative assessment
-
Recognition that any quantitative assessment will be limited as only certain aspects of value can be quantitatively measured.
-
The direct impact of value will need to be tightly defined.
-
Indirect impacts should be included while recognizing they may be inaccurately estimated.
-
The timing of the evaluation means that only the short-term value can be accurately measured.
-
Attempts should be made to quantify the contribution of both tangible (e.g. training events/workshops) and intangible (e.g. trust) mechanisms that contribute to overall value. This observation is only listed here but is equally supported by the findings from other domains (safe people, safe settings, safe data).
Safe people
Challenges
Targeted engagement: Interviewees commented on the need to identify and work with high ranking officials to champion the project but also highlighted the importance of identifying key “blockers.” These had the potential to become “powerful advocates for the policy itself” once their issues were addressed. Attendance of the “right people” from donor organizations and international project partners was important in building momentum and attracting a diverse set of local stakeholders.
National and regional governance: The issue of federalism was a recurring issue within the interviews. The regional structure in Ethiopia is very important both institutionally and culturally. Training would not only be needed at the national level, but there would also need to be training focused on upskilling researchers in managing local datasets; these can then be combined to piece together the regional and national pictures.
Best practice
Local ownership and empowerment: One significant development in the project was the formation of the “Coalition of the Willing” (CoW). Initially, this included 26 participants from 17 major research institutions in Ethiopia; over time, this grew to approaching 100 members. This was set up by researchers to inform the development of the data sharing policy, demonstrating the value of sharing by doing so. This had the direct effect of creating local ownership of the project, improving communication between stakeholders, ensuring buy-in for the project goals, and providing a forum for momentum about the project to be generated.
Top-down, bottom-up: The project also drove forward the “top-down” development of the Soil and Agronomy Data Sharing Policy in partnership with the Ethiopian government; tight feedback loops between these approaches benefited the project. It also helped that the CoW fed directly into the government taskforce. Indeed, several individuals were members of both. This “bottom-up” and “top-down” approach is mutually reinforcing, in a dual approach of incentive-and-sanction working in tandem. The incentive demonstrates what can be achieved when working together; this gives impetus for the sanction (national data sharing policy) to be developed, to encourage those not actively participating. The CoW in particular contributed to the “bottom-up” approach by driving forward localized data sharing initiatives. It worked because there was a clear incentive for individuals to take part, inasmuch as they would be given access to other members’ data.
Building trust: The necessity of building trust (especially between international organizations and local stakeholders), forming strong relationships, and empowering stakeholders was clearly key to developing and potentially implementing the policy. To address long-held cultural and social norms (e.g. in Ethiopia, historically information had been shared as a result of personal relationships rather than through any systematic process), it was important to empower stakeholders to develop their own solutions. Co-created solutions were enabled through an agile and flexible approach to managing the project. The project team also had a significant role in building capacity through the identification of skills gaps and then co-developing materials and workshops to fill such gaps.
Upskilling: Much of the focus on training was for the long-term sustainability of the project which would ensure that individuals were trained to use data effectively and securely. In order to do this, the project identified key individuals who could be trained up, who in turn would be able to share the knowledge within their institutions and with future generations.
Implications for quantitative assessment
-
Potential to estimate the value regionally as oppose to just nationally: given the importance of the regional structure, additional benefit could be generated if regional estimates of the value were provided (but given the limited data this was judged to be beyond the scope of this study).
Safe settings
Challenges
Development of culture and systems: The principle of appropriate access was central to the development of the policy. Safe settings are often considered a technical or process matter. However, the evidence here pointed to the need for this to be accompanied by a cultural shift in relation to data access in Ethiopia. Prior to the commencement of the project, data sharing was often only advanced by the use of official letters to request that data be made available for a particular purpose. This process potentially created bottlenecks, particularly for those datasets where this level of formality may not be required. The evidence was that this project had shifted perceptions of at least some organizations.
Supporting framework conditions: The interviewees commented that investment in technology could automate data sharing efficiently and securely. However, some questioned the scope for automation and suggested the need for further investment in people and skills to build capacity to support and administer the technical solutions. Within the Ethiopian setting, the evidence suggested that investment in technology was not the problem, but the relevant framework conditions (e.g. legal, institutional, procedural) require adaptation.
Best practice
Technology: Within the project, interviewees suggested that the technology was either already available within Ethiopia or easy to acquire. As such, they stressed the need to look beyond the technical solutions. The suggestion was that in future, the role for CABI in Ethiopia would be to provide advice around infrastructure, connectivity, and the minimum requirements to enable data sharing in line with policy and procedures.
Knowledge transfer: One way to develop a safe model of delivery is to learn from other institutions who have similar data handling needs. In support of this aim, the discussion pointed to Members of CoW visiting the Bangladesh Soil Resource Development Institute to learn how it uses a safe setting to manage restricted-access data.
Implications for quantitative assessment
-
Technology is a considerable cost and can be directly measured, but complementary human skills may be harder to assess.
-
There are potentially significant indirect costs in relation to developing the supporting framework conditions; however, these have been judged to be beyond the scope of this analysis.
Safe data
Challenges
Expertise in data governance: The interviewees highlighted the fact that much of the success of the project was driven through local empowerment; however, much of this expertise was in soil and data science, rather than data governance and access. As such, it was highlighted that it was important to bring in additional (international) expertise to help upskill capacity in relation to the safe management of data.
Supporting framework conditions: The supporting framework conditions were highlighted as requiring modification. For example, the lack of consistency in data standards was considered a barrier to sharing data. However, there was some progress on developing harmonized standards and protocols; an example was cited of core treatments being standardized across a number of individual experiments. Some highlighted a lack of trust in institutions, people, and systems as additional barriers; others identified legal and technical issues, while the federal institutional setup posed its own additional challenges. The interviewees recognized the need to shift toward a culture of more open data, and it was suggested that, as a result of the project and its wide engagement, there had been progress in this area.
Shared understanding: Lack of clarity over terminology was identified as a limitation, particularly around the different dimensions of data (e.g. accuracy, completeness, consistency, timeliness, validity, etc.). This prompted suggestions to develop a clear language and clear definitions. This would include key concepts such as what is an identifier and what variables have statistical value. Using internationally accepted frameworks, such as findable, accessible, interoperable, re-usable data, can help develop a shared understanding that can be applied in multiple contexts. Interviewees also pointed to the lack of clarity over those datasets that should be funded, collected, and maintained nationally, compared to those that are only required and collected locally. Being able to clearly identify the former would be helpful.
Best practice
Local ownership and empowerment: Local empowerment and ownership were highlighted as important factors. For example, a data sharing task force was formed with the primary objective of developing “informal” guidelines for data access and sharing. It was hoped that the task force could add value to the project by advising on issues around data quality, accessibility, and governance procedures, while the group was also seen as being an important influence on the national soil and agronomy data sharing policy.
Implications for quantitative assessment
-
Reinforcing the need for clear definition of terms and agreement on what is/is not measurable.
Safe outputs
Challenges
Human capital development: Experience in confidentiality protection was mixed; some reported work on implementation being well advanced, while others suggested that progress was less developed, as they were considered second-order issues. This is potentially an issue, as ensuring that outputs are safe and confidentiality maintained is hugely important to build trust in the process.
Given the sensitivities of working with different types of data, it is important for clear data standard controls to be set and enforced. Training in disclosure checking was not practiced, but there was support for training to maximize the value of statistical analysis. Much of this was “on the job” rather than formal training.
Best practice
Top-down, bottom-up: Once again, the top-down, bottom-up approach was recognized as being important for this domain. The interviews discussed a dual approach using both incentives and sanctions. Promoting the value of safe outputs can act as the incentive to complement the legal sanction to enforce compliance from those yet to be convinced by the incentive. Interviewees stressed the importance of being able to demonstrate the value of how data collected at a local level can be combined into important national datasets. For example, workshops were used to present the results of using large datasets.
Implications for quantitative assessment
-
Research outputs (i.e. papers) are directly measurable.
-
Where possible, it is important to measure activities in relation to developing human capital (e.g. training events/workshops).
Results: quantitative study
The following section details the results of a CBA. In this section, we use this framework to illustrate how assessments may be made, generating some exploratory estimates as part of the illustration (for full details of assumptions made, see Supplementary Table S2).
Input costs: data gathered from financial reports
The costs presented in Table 4 provide a high-level overview of the inputs for: (1) the CoW and (2) activities undertaken to support the establishment of a national IT host for a centralized data repository (SIRM). Given the uncertainty with the coverage of the data, these input costs should be seen as indicative.
High level breakdown of input costs, November 2018–July 2020

Source: GIZ.
Input costs of activities in relation to improving data governance and data access in the SSHI project were approximately US$640 000. To return a positive net benefit, total benefits would need to exceed this figure.
Benefits: data gathered from questionnaire
Output: direct internal value
Estimates of direct internal value (DIV) are calculated by multiplying the number of activities (A) undertaken (e.g. workshops) by the number of people from each sector (broken down by six sectors) who have engaged with the event (Ps), hourly wage rate for the sector (HRs), and length of time in engagement, measured in hours (H). The assumption that underlies this value is that the expected value from the event is at least as high as the cost of the individual attending the event (measured in this case by paid-for hours). This may be an overestimate as: (1) individuals may be under pressure to attend, (2) individuals are attending to claim “per diem” expenses, (3) individuals may not consider the cost to their employer of attendance, and (4) the real value gained may be systematically lower/higher than the direct measure calculated. For example, using this methodology activities with large numbers of participants are always recorded as being of greater value than events with small numbers of participants, regardless of the outcome.
Equation 1: Direct Internal Value Footnote 2
 $$DIV = \mathop \sum \limits_{s = 1}^6 P{S_s} \times H{R_s} \times A \times H$$
Benefits arise from added value over and above that directly funded by the project. The total DIV was therefore allocated between those on the project payroll (labeled as funded) and those external to the project (labeled as unfunded).
Figure 3 records the DIV of nine activities measured. In total, it shows that they generated over US$353 000 DIV. Over 95% of the DIV was added value to the project as it accrued to individuals external to the project – this is shown by the orange (unfunded) segment of the graph, while 54% of the total overall benefit was generated by just one activity – CoW.
Direct internal value by activity. Source: authors’ calculations.

Output: indirect internal value
Indirect internal value (IIV) was estimated through asking project experts (including some, but not limited to, those individuals interviewed as part of the qualitative framework) to judge how an activity affected the delivery of subsequent activities within the project. They were asked to estimate the time saved and/or extra time needed of individuals working on the project as a result of each activity. For example, the experts judged that if the inception workshop had not been held, other work packages would have taken longer to complete – this was estimated to be the equivalent of one person working 141 days.
Respondents were then asked to attribute this increase or decrease to one of seven potential reasons for the time saving and/or extra time needed (i.e. trust, champions, blockers, culture, data governance knowledge and skills, consistency of data and other), identified in the qualitative research.
Equation 2: Indirect Internal Value Footnote 3
 $$NTS = T{S_w} - ET{N_w}$$
 $$AHW = \mathop \sum \limits_{s = 1}^6 H{W_s} \div 6$$
 $$IIV = NTS \times AHW$$
Due to a lack of responses to this particular question, there were insufficient data to generate IIV estimates for International Exposure Visits; estimates for all other activities are presented in Table 5.
Indirect internal value

Source: authors’ calculations.
Every category contributed to an indirect time saving, in total equivalent to 719 person-days. The single largest net contributor was the inception workshop, demonstrating the importance of this event in engaging the local community to support the project.
The experts were asked to apportion their estimates of the time saved to the mechanism through which it was most likely to occur. Figure 4 provides proportions of the time saved (719 days) attributed to the different mechanisms. As such, the total for all activities totals 100%.
Weighted average of the proportion of time saved allocated to the reason for the time saving. Source: authors’ calculations.

In support of the importance suggested in the qualitative interviews, working with “Champions” was judged to accounted for over a quarter (28%) of the IIV time saving estimated in Table 5 – this equated to nearly 200 days. Change in the culture toward more open data and an increase in trust between stakeholders were estimated to account for 22% (156 days) and 15% (106 days) of the IIV, respectively. What is of particular interest about these two indicators is that any positive change in culture and trust would be expected to extend past the length of the project and therefore generate longer-term impacts. This illustrates one of the difficulties of assessment where structural change is concerned.
Intermediate outcomes: external tangible value
Given the need for the evaluation to be proportionate and the limited availability of data, the (tangible) outcomes were limited to just measuring publications produced as a result of these activities (some of which will be published in the special edition of Experimental Agriculture). The strength of this approach is that the output is tangible and measurable, and can be directly attributed to the activity. A further step could attempt to monetize the value of the publications, but, given the limited information available on the quality of each publication at the time the evaluation was completed, the authors judged that any such estimation approach would lack validity.
As well as not directly monetizing the value of the output, the main weakness with this approach is that it does not capture the full indirect outcomes (e.g., publications leading to changes in policy and practice which result in the generation of additional value). Therefore in terms of a traditional CBA, this approach is an underestimate of the true benefit (assuming outcomes are generally positive).
Table 6 lists the 21 publications produced as identified by the experts.
Publications produced

Source: authors’ calculations.
The challenges in defining and accounting for data governance and access elements of the SSHI projects, and the difficulties of quantifying and monetizing what potentially is an unquantifiable concept, mean that the estimates here should only be considered as illustrative. Given these caveats, Table 7 summarizes the following results.
Total cost and benefits

Source: authors’ calculations.
The case study results suggested that, on a direct cost measure, the SSHI data governance activities yielded a negative net return of US$234 542 (column 3). These figures reflect the monetized direct measurable net benefit for the project.
The net return, however, does not include non-monetized benefits (column 4–5), including indirect benefits and longer term spill-over effects. In fact, Whittard et al. (Reference Whittard, Ritchie and Nyengani2021) in the full SSHI evaluation report that inclusion of relatively few un-monetized benefits is sufficient to generate a positive return, for example, valuing academic publications (column 4) on cost basis.
During the qualitative interviews, the respondents indicated that the overall impact of improved data governance and access was likely to generate wide-ranging spill-over impacts, potentially way beyond the soil and agronomy sector. Given the challenges of estimating a monetary value for these, the research team limited their analysis to estimating a long-term impact score based on likelihood and potential impact (column 5) – for more detail see Whittard et al. (Reference Whittard, Ritchie and Nyengani2021). Any score over 6.25 indicates a positive spill-over is likely and/or will be impactful, and the strength of the likelihood and/or impact is related to the size of the estimate (25 being the maximum score). Therefore, the results reported in column 5 indicate substantial positive spill-over effects, both within the soil and agronomy sector, but also on the wider economy itself. This would be a pure gain for Ethiopian society from the project if the direct benefit were positive or close to zero.
Discussion
This report has described both a framework for the evaluation of data governance and the results of applying that framework to a real-world project. The development of the framework was an iterative process, with multiple evaluation structures tried and rejected before the final framework was agreed.
The framework was most useful in providing a structure for qualitative data collection. In this phase, the use of experts was essential. Those individuals had in-depth knowledge and so were best placed to provide quantifiable estimates as required. As the experts are likely to have a vested interest in the success of the schemes being evaluated, they may have an incentive to over-emphasize the benefits and underplay the costs. In practice, the approach taken attempted to limit this effect as much as possible by asking experts to provide “contextual and factual” information: what happened, what led to something else, what stopped something happening. This information then allowed the evaluation team to draw the conclusions about costs and benefits. In addition, to encourage open and honest answers the authors expended considerable effort prior to interviews to reassure the experts about the nature of the evaluation: that this was a genuine attempt to explore understand and explain, rather than an exercise in monitoring.
The quantitative data analysis followed a more conventional “theory of change model” approach, but with a conscious decision to limit outputs to what was sensible and meaningful to measure. Evaluations need to make much use of assumption and extrapolation, because measurement data are missing or impossible to monetize. This is particularly true when the outputs are intangible, the project generates spill-over (indirect) effects, or the benefits are likely to arrive in the future. For evaluating the impact of data and data governance, all three of these challenges are present.
As such, in this type of evaluation the authors could have kept identifying, and monetizing, additional potential benefits, until the end result of the evaluation becomes positive. This would not have necessarily been duplicitous, especially when there is no clear limit as to what is in and out of scope, but inevitably there would be much uncertainty as to the quality of the estimate. Apart from appeasing funders and certain stakeholders, this approach can be criticized as it provides very little useful information in terms of lessons learned; however, the supportive qualitative approach does this.
For this project, the decision to limit the quantitative evaluation to “measurable” items was a conscious choice. This yielded the finding that the SSHI project did not appear to generate a positive return on the investment. The evaluation also identified a very large number of benefits that were not deemed measurable; with a few assumptions, a positive overall return could be generated. By not taking this last step, the evaluation effectively says “These are observable benefits and cost we could identify, and the direct gain or loss; these are additional effects which generate additional but unmeasurable benefits; the choice of whether the project is currently worthwhile can now be considered with reference to this evidence.” This seems a more honest approach when the outputs and impacts are intangible, diffused across society, dynamic, and persistent over time.
Moving from a definitive “number” to represent the value of the investment, toward a more nuanced evaluation of what the investment has produced, has one further advantage. It may reduce the incentive for boosting benefits and downplaying costs, as the “value” no longer rests solely on measurable effects. This may also lessen the impact of optimism bias, by placing more stress on interpreting results rather than taking them as definitive.
Next steps
In this paper, we have focused on developing a new methodological approach to the valuation of data governance. Although we did develop specific results, in some ways this project can be seen as a “proof-of-concept.” We propose two measures in particular that would help to develop a practical tool for evaluation and implementation of good data governance.
The first is the improved collection of effective information to inform the evaluation. It is a standard lament of every evaluation, that there is “not enough data,” and that more should be done to design in the collection of evaluation data from the project start (Alves et al., Reference Alves, Tava, Whittard, Green, Beata Kreft and Ritchie2021). Often this can just mean considering “what inputs/outputs can we measure and cost?” However, this project has demonstrated the limitations of focusing on measurable metrics, the importance of recognizing the limits to measurement and the value of understanding context. We propose the use of expert opinion early on to inform and direct the evaluation strategy, and to identify what is usefully measured and what is important but perhaps unmeasurable.
Second, the Five Safes was originally designed to create a simple language and framework for thinking about data governance decisions. Embedding this into strategic planning would encourage decision-makers to build on established tools and good practices which use the framework, as well as providing a ready-made structure for evaluation. The use of a recognized framework may also help to encourage trust between data partners as governance arrangements become more transparent.
Third, although the focus of the paper was primarily about developing and testing a framework to estimate the value of data governance and access in agriculture projects in developing countries, by applying the framework to the SSHI project in Ethiopia, inevitably we are also able to comment on the potential to drive this process forward.
Within Ethiopia, it is clear that there is a sizeable amount of agriculture data, and improved coordination and access to it has the potential to enhance evidence-based research which in turn can lead to better policy decisions. Our evidence shows that building trust between government bodies and researchers is, and will continue to be, central to the success of any such initiative. Therefore, as well as its usefulness for evaluation purposes, the authorities may wish to consider building capacity regarding the implementation of Five Safes framework. This framework has been adopted worldwide as it is engenders trust by creating an environment to maximize the use of detailed data, while keeping data secure at all times. In terms of operationalizing the Five Safes framework, best practice suggests that the government may wish to establish a review board to evaluate data request applications from potential researchers. This should be supported by the development of survey design and data collection guidelines, in order to ensure the collection of high quality data which is consistent across different surveys. By focusing on improving the coordination between data collection groups, this has the potential to standardize data sources, reduce data redundancy, and increase efficiencies. Indeed, the CADRE project (McEachern, Reference McEachern2021) provides detailed guidance on this.
Conclusion
Work on valuing data and data governance is still in its infancy, and there is no agreed or dominant typology. Data governance impacts are intangible: likely to generate many spill-overs; likely to have more effects in the long term than the short; and likely to be very dependent on how they interact with the rest of society. However, this study demonstrates that a novel mixed-methods approach combining a traditional CBA framework with qualitative framing can generate insightful and meaningful results. The case study of SSHI demonstrates the new approach is workable, even if there is much to be done on refining it.
The use of the Five Safes provided some consistency with the wider data governance literature, but the main value of it was providing a structure for the qualitative review. The expert input, gleaned from interviews, allowed the evaluation team to identify the events and activities that had an impact, and to generate the structure for the quantitative analysis.
Throughout both qualitative and quantitative analysis, the emphasis was on identifying impacts, outcomes, and causes, rather than measuring them. This is a break from the traditional cost–benefit approach, where having a final value of whether an investment generates a positive return is the prime driver. However, when dealing with an activity as nebulous as data governance, there is value in limiting the reliance on quantitative analysis and increasing the emphasis on identifying exactly what has happened without the need to monetize it.
Some of the challenges of traditional evaluations remain: timing (too late to start data collection, too early to identify benefits), optimism, and other biases, the need to make strong assumption even when limiting oneself to measurable activities. The estimates generated for this report are exploratory and tentative, being based on a small number of data points, highly subjective answers, and some very broad assumptions about costs and benefits. Nevertheless, we believe they provide a useful illustration of how something as nebulous as the return on investments in data governance may be measured. There is almost no literature on this to date – which means, amongst other problems, that there are no other studies to compare our findings with – but we expect this will open up opportunities for future research in this area.
One important finding is the importance of working with organizations, teams, and individuals who are open, prepared for challenge, and ready to explore many pathways, many of which lead nowhere. This approach was embraced by the various teams and individuals involved with the process as we attempted to identify suitable projects and frameworks to test before alighting on our chosen approach.
Supplementary Material
For supplementary material for this article, please visit https://doi.org/10.1017/S0014479721000314
Acknowledgements
The authors would like to thank all the stakeholders who participated in the development of the evaluation framework and assisted in its application. In particular, we would like to thank the many experts who invested their valuable time to take part in the interviews and surveys.
Financial Support
This study was supported by the Centre for Agriculture and Bioscience International (CABI) and the Bill & Melinda Gates Foundation.
Conflicts of Interest
None.


 Open access