


Introduction
There has been significant research in the last two decades on the factors that contribute to tax evasion and compliance; partly motivated by increased policy interest to motivate organisations to pay their taxes (Aaron and Slemrod, Reference Aaron and Slemrod2004; Slemrod, Reference Slemrod2019). Developing countries face significant tax evasion, limiting their capacity to offer public goods and services (Besley and Persson, Reference Besley and Persson2014). A considerable portion of tax revenue comes from consumption and sales taxes, but large-scale informality can keep revenue collected from these sources low.
When tax authorities have to depend on voluntary registration and self-reported information, dealing with tax evasion becomes especially challenging. This is because individuals involved in large informal economies have a strong motive to avoid registering and reporting their income (Allingham and Sandmo, Reference Allingham and Sandmo1972; Slemrod and Yitzhaki, Reference Slemrod, Yitzhaki, Auerbach and Feldstein2002; Sandmo, Reference Sandmo2005). Policymakers and scholars have shown an increasing interest in examining the potential impact of low-cost reminders to ensure tax compliance even in situations where the ability to monitor and audit taxpayers is limited (Slemrod, Reference Slemrod2007; Luttmer and Singhal, Reference Luttmer and Singhal2014). Traditionally, the approach to improving tax compliance has been to increase the economic incentives to file by enhancing the likelihood of detection and the associated penalties. However, results are mixed and rely on taxpayer beliefs about probability of detection (Slemrod et al., Reference Slemrod, Blumenthal and Christian2001). Recent findings suggest messages that highlight non-specific probabilities of audit and penalties can be as effective as specific messages, likely they force recipients to ‘fill-in-the-blanks’ with the most probable consequences (Floyd et al., Reference Floyd, Hallsworth, List, Metcalfe, Rotaru and Vlaev2022; Holz et al., Reference Holz, List, Zentner, Cardoza and Zentner2023). Further, measures that rely on punitive measures ignore intrinsic motivation for compliance, such as reciprocal altruism (Levi, Reference Levi1989; Frey, Reference Frey1997).
This study explores if text message interventions can promote tax compliance in the context of sales tax on services in the province of Khyber Pakhtunkhwa, Pakistan. The status quo setting is unique in that service providers registered with the provincial tax authority have been receiving at least one but not more than two text messages from the tax authority each month since 2019. The first is a reminder message sent out to all service providers, reminding them to file their monthly sales tax returns before the monthly due date. The second is a warning message: an additional message sent out to those who have not filed tax returns by the due date, warning them against potential legal action. In this study, we randomly allocate all 18,087 registered service providers to either continue to receive the status quo reminder and warning messages; to receive no messages at all; or to receive a combination of status quo and two additional types of reminder and warning messages. This resulted in a total of 10 arms in a 3 × 3 factorial design, plus one group receiving no messages.
We introduced two new reminder messages: a ‘reciprocity’ message that evokes a sense of social responsibility and relies on moral suasion; and a ‘loss aversion’ message that emphasised potential financial penalties and deactivation in the case of non-compliance. The two new warning messages consist of a loss aversion (LA) message highlighting financial penalties and deactivation and an ‘active choice’ message that framed continued non-compliance as a deliberate choice with legal consequences, rather than an omission or oversight on the part of the service provider. Registered taxpayers were randomly allocated to these arms in June 2022 and remained in the allocated group till November 2022, while one group of service providers did not receive any SMS message from the tax authority at all.
We track the filing patterns of study participants for the study months and find that the interventions did not have a significant, sustained effect on filing behaviour over the status quo messaging on average: none of the message combinations improved the likelihood of filing tax returns significantly or in a sustained manner, nor did they change the average amount of tax filed over the study period. Conversely, we also observe no deterioration in compliance amongst the group that did not receive any reminder or warning messages over six months of the study, suggesting the average impact of all SMS text messages was minimal. All our results are robust to the inclusion of length of time the service provider has been registered with the tax authority, the type of entity, and sector and region fixed effects.
Subgroup analysis revealed interesting heterogeneity suggesting that the impact may be different by types of taxpayers. In particular, we construct three proxies for the likelihood of compliance, or ‘receptiveness’ of taxpayers to messages from the tax authority: (i) whether the service provider is an early registrant and has been registered with the tax authority for at least the sample median of 30 months; (ii) whether the service provider is a corporate entity and (iii) whether the registered service provider filed an amount more than the sample median in the year prior to the study. We find that the likelihood of filing compliance, in terms of returns, is better for all treatment message groups, including the no-SMS group, compared to the status quo group among early registrants. Among those who registered early, the LA reminder and AC warning combination was particularly effective in improving filing rates over the status quo message group. Conversely, among those who had registered recently, all new SMS and the no SMS groups worsen the likelihood of filing tax, except among the LA and AC group, where compliance is statistically not different from the baseline (BM) group compliance. The LA reminder and AC warning pairing is effective among large taxpayers as well: the probability of filing among this sub-sample is statistically higher for this pairing compared to the status quo messages. However, participants who file positive returns are a relatively small sub-sample of the study sample, and the results of this subgroup analysis do not survive multiple hypothesis testing. Therefore, we interpret these results with caution. Finally, filing behaviour among the small sample of entities that are corporations is not significantly different from non-corporations in the treatment groups.
Our study contributes to the growing experimental literature that investigates if tax compliance can be improved via appealing to moral suasion or tax morale, (Dwenger et al., Reference Dwenger, Kleven, Rasul and Rincke2016; Hallsworth et al., Reference Hallsworth, List, Metcalfe and Vlaev2017; De Neve et al., Reference De Neve, Imbert, Spinnewijn, Tsankova and Luts2021; Bergolo et al., Reference Bergolo, Ceni, Cruces, Giaccobasso and Perez-Truglia2023), deterrence (Kettle et al., Reference Kettle, Hernandez, Ruda and Sanders2016; Alzate, Reference Alzate2022) and vague threats of penalties (Floyd et al., Reference Floyd, Hallsworth, List, Metcalfe, Rotaru and Vlaev2022). The study also adds to literature from other developing countries that study other cost effective methods of reaching out to taxpayers via email and SMS (e.g., Pomeranz (Reference Pomeranz2015); Brockmeyer et al. (Reference Brockmeyer, Smith, Hernandez and Kettle2019); Antinyan et al. (Reference Antinyan, Asatryan, Dai and Wang2020); Castro et al. (Reference Castro, Velásquez and Beltrán2022). The results are, on average, in line with literature that finds that soft nudges in the form of mailed messages or marketing campaigns with no in-person follow-up can have little or no sustained impacts on tax compliance (Blumenthal et al., Reference Blumenthal, Christian and Slemrod2001; Cyan et al., Reference Cyan, Koumpias and Martinez-Vazquez2017; Brockmeyer et al., Reference Brockmeyer, Smith, Hernandez and Kettle2019).
Our study adds to literature by testing how low-cost nudges can be used to influence consistency in tax filing compliance – sales returns have to be filed every month, and not once a year as is the case with other studies that study filing income, property and other taxes (see Mascagni (Reference Mascagni2018); Slemrod (Reference Slemrod2019); Antinyan and Asatryan (Reference Antinyan and Asatryan2020) for a review of literature). A single contact is unlikely to suffice for sustained compliance in such settings.Footnote 1 Changing habitual behaviour in such settings can be difficult. Our results suggest that soft nudges and reminders can nevertheless be effective if customised to recipient type and their tax filing habits. A novel feature of the study context is taxpayer exposure to periodic messaging from the tax authority. The absence of significant changes in compliance behaviour when no messages are sent, on average, suggests that after tax filing requirements have been acknowledged, less frequent messaging may be possible without foregoing tax filers (Koumpias and Martínez-Vázquez, Reference Koumpias and Martínez-Vázquez2019).
Second, the unique factorial design that we employ provides a clean test of the combination of short messaging that can work best. The LA and AC combination exhibits the most improvement in filing behaviour among early registrants. In a setting where precedence for implementation of financial penalties, or worse legal action, is rare, messages that have vaguely defined consequences can be particularly effective. This is in line with recent findings from a lab experiment on deterring lying (Agranov and Buyalskaya, Reference Agranov and Buyalskaya2022) and field experiments on income tax compliance (Wenzel, Reference Wenzel2006; Del Carpio, Reference Del Carpio2014; Kettle et al., Reference Kettle, Hernandez, Ruda and Sanders2016; Floyd et al., Reference Floyd, Hallsworth, List, Metcalfe, Rotaru and Vlaev2022).
Third, the study setting is similar to many developing countries – with low compliance, low enforcement and high informality. For Pakistan, in particular, this is the first field study that examines low-cost interventions to improve tax compliance and has important policy lessons, both for the local tax authority and the behavioural science literature.Footnote 2 The insignificant impacts on average highlight that subtle nudges, even if they are low cost and easy to implement, may not always work as intended. For instance, in contexts where enforcement is lax, these nudges can also undermine compliance behaviour (Cheesman and Peiffer, Reference Cheesman and Peiffer2024). On the other hand, sub-sample analysis indicates that low-cost, impersonal messages can improve tax filing rates if they are targeted to receptive taxpayers.
Experimental setting
Pakistan’s tax revenue has consistently remained around 10% of the country’s GDP (Sattar, Reference Sattar2023), similar to other South Asian countries.Footnote 3 Indirect taxes form the bulk of tax collected in the country: sales tax contributed 42% of the tax revenue collected in the country in 2021–2022 (Government of Pakistan, 2022). Collection of sales tax is fragmented, with sales tax on goods collected at the federal level and services sales tax administered at the provincial level.
The Khyber Pakhtunkhwa Revenue Authority (KPRA) was set up in 2013 to administer sales tax in Pakistan’s third most populous province of nearly 35 million people.Footnote 4 In 2021–2022, the KPRA collected PKR 30.3 billion (∼USD PPP 0.7 billion) in revenue, five times the amount that was collected in 2013 (KPRA, 2022).Footnote 5 While the number of service providers registered with the KPRA has been steadily increasing – from a little over 8000 in July 2019 to nearly 18,000 in June 2022, compliance has been decreasing with a little over half of the registered service providers filing their taxes within the allowable time. Among other initiatives to broaden the tax base, KPRA introduced an SMS campaign in 2019 to encourage registered service providers to file taxes on time. Under this scheme, service providers receive a ‘reminder’ text message to file taxes before the due date of the month and a warning message in the week after the due date if they fail to file taxes on time.
During the COVID-19 pandemic and the post-pandemic period, KPRA implemented several measures to alleviate the tax burden on service providers. These included slashing tax rates for multiple services, such as reducing the construction tax rate to 2% and the consulting tax rate to 5% from 15%. Additionally, KPRA occasionally extended filing deadlines for late submissions. These amendments may have influenced future tax filing behaviour by setting a precedent for flexibility in tax compliance.
Service providers registered with KPRA consist of businesses or individuals involved in construction, hospitality, advertisement, beauticians, IT and telecommunication-based services, automobile sellers and rent-a-car services, and other services. The status of taxpayers, whether individuals, associations of persons, or corporations depends on their mode of operation. For instance, consultants who work as individual service providers are registered as such. However, companies employing these consultants are registered as corporations due to their incorporation through legal business entities like the Security and Exchange Commission of Pakistan (SECP). KPRA sends registration notices to all service providers in KP as soon as they are incorporated or registered with the SECP. There is no revenue threshold for registration with KPRA.
Registered service providers are required to file sales tax returns for each month by the 15th of the subsequent month, but there are no legal or financial repercussions if returns are filed by the 18th. KPRA claims that the process of filing returns has been streamlined substantially over the years, possible both online and offline, with online being more commonly used. The process varies by the type of filing – null filers and service providers who have at least part of sales tax conducted at source go through a smaller process. On the other hand, the process for businesses and corporations is longer, typically managed by tax professionals due to its complexity.
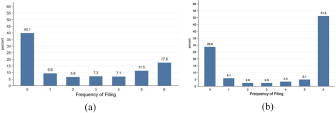
The experiment was conducted July–December 2022 with 18,087 service providers registered with the KPRA as of 1 June 2022, to affect filing compliance for the period June–November 2022. We observe that in the same period in the year before, i.e. June–November 2021, nearly a third of the providers had filed on or before the 15th of the month at least four out of six months (Figure 1a); and 17.6% had filed on time every month. However, 40% do not file on time or at all. We further explore these trends by analysing the timing of tax filing. Specifically, we are able to examine a period of five months after the due date of each month (15th of the month), and observe that the percentage of registered taxpayers who do not file at all within five months after the due date is 28.8% (reduced from 40% for timely filing), while 51.6% of the sample files for all six months within five months of the due date; and the remainder files returns for one to five months after the due date but within the 150 day window (Figure 1b). This suggests that many taxpayers file, but they file late, likely lumping the filing returns for a few months together. Additionally, it is worth noting that 80% of the taxpayers who do file, are ‘null’ filers, i.e., they file 0 tax returns (see Figure B1 in the Appendix).Footnote 6 Among those who filed, the average amount is PKR 104,122 (∼USD PPP 2361) between June–November 2021 and the median amount is PKR 0. Of those who file a positive amount, a median amount filed in the period June–November 2021 is PKR 27,761 (∼USD PPP 630).
Tax filing frequency June–November 2021. (a) Times filed before monthly due date (b) Times filed within five months.

Figure 1 Long description
The image A showing a bar graph with x axis label Frequency of Filing and y axis label percent. The x axis shows 0, 1, 2, 3, 4, 5, 6. The y axis ranges from 0 to 60. Bar values: 0 equals 40.1, 1 equals 9.6, 2 equals 6.8, 3 equals 7.3, 4 equals 7.1, 5 equals 11.5, 6 equals 17.6. The image B showing a bar graph with x axis label Frequency of Filing and y axis label percent. The x axis shows 0, 1, 2, 3, 4, 5, 6. The y axis ranges from 0 to 60. Bar values: 0 equals 28.8, 1 equals 6.1, 2 equals 2.6, 3 equals 2.6, 4 equals 3.5, 5 equals 5.1, 6 equals 51.3.
One-fifth (21%) of the registered taxpayers as of 1 June 2022, were corporations. A small proportion (2.7%) of the registered taxpayers were women. More than half the sample belongs to the construction sector (56%), followed by hospitality (9%) and transportation and courier services (8%).Footnote 7 Taxpayers have been registered with KPRA for an average of 2.7 years, with a quarter of the registered taxpayers having been registered for four years or more.
Design
Intervention design
Since 2019, the KPRA has sent monthly SMS messages to remind registered taxpayers that tax returns of the (previous) month are due by the 15th (of current month), and that they must file before the 18th to avoid penalties. Taxpayers, who did not file by the 18th, received a warning message to file as soon as possible to avoid penalties.Footnote 8
This experiment tested reminder and warning message texts to test if there are alternatives to the BM reminders that can improve compliance rates. The content of the intervention messages is informed by literature, and focuses on leveraging the power of civic responsibility, threat of penalty and salience of upcoming due dates. One reminder uses moral suasion to increase tax morale, by highlighting the social and public good that tax revenue can provide (Dwenger et al., Reference Dwenger, Kleven, Rasul and Rincke2016; Hallsworth et al., Reference Hallsworth, List, Metcalfe and Vlaev2017; De Neve et al., Reference De Neve, Imbert, Spinnewijn, Tsankova and Luts2021; Bergolo et al., Reference Bergolo, Ceni, Cruces, Giaccobasso and Perez-Truglia2023). It specifically mentions a state-funded health insurance scheme, illustrating an important social security provided by the KP government.
The other two messages made the possibility of financial, legal, and other penalties salient. However, instead of specifying the exact extent of the penalty, they were deliberately vague on this aspect. We do this for two reasons considering the context where tax evasion is common, and compliance is generally low. One, a harsh deterrence strategy could have the opposite effect, reducing future voluntary compliance (Hessing et al., Reference Hessing, Elffers, Robben and Webley1992). Second, recent literature has shown that punishment uncertainty can be more effective in increasing compliance than specific penalties (Floyd et al., Reference Floyd, Hallsworth, List, Metcalfe, Rotaru and Vlaev2022). In contexts with common tax evasion, specifying penalties may prompt evasion strategies. When respondents are uncertain about potential outcomes, they tend to fill in the blanks and assume likely and realistic enforcement actions.
The messages were restricted to 70 characters in the local language (equivalent to 150 characters in English). The exact wordings of the short text messages were designed following capacity building workshops held between August and November 2021. These workshops involved select members of the KPRA who later formed the behavioural insights unit known as Pakistan Mindlab. During the workshops, participants generated ideas for improving taxpayer compliance, considering factors like behavioural science principles, feasibility and clarity of messaging. The most promising ideas were then chosen for further evaluation and ultimately, the intervention design was selected based on feasibility, theoretical grounding and contextual relevance.Footnote 9
The design of the messages followed a deliberate strategy of increasing severity from the reminder to the warning messages. Reminder messages were intended to be firm yet friendly, offering a gentle nudge towards compliance by highlighting potential legal consequences. Warning messages, on the other hand, were crafted to be more direct and impactful. They explicitly mentioned specific fines and additional potential actions to emphasise the seriousness of non-compliance. This escalation in tone and detail aimed to heighten the perceived risk for the recipient from non-compliance.
The reminder messages were as follows:
• The control or baseline (BM) message: This status quo reminder message used content that KPRA had been implementing since the inception of the program and can be considered to be the message that existed at BM. The message stated: ‘Ensure the payment of sales tax liable by the 15th of [month]. To avoid any legal trouble/difficulties, file returns before the 18th of the [month]’.
• The equivalent reciprocity (EQ) message: This message used moral suasion, leveraging a sense of civic duty: ‘Your tax money is used to bring beneficial programs like the Sehat card to Pakistanis. Do your civic duty and file your taxes by the 15th’.
• The loss aversion (LA) message: This message made salient the financial and legal penalties of not filing tax on time: ‘Payment of sales tax is due on the 15th. File now or risk incremental monetary fines; account deactivation and strict legal action’.
Warning SMS were sent out to all registered service providers who had not paid before the due date and were as follows:
• The control or baseline (BM) message, with status quo content, stated: ‘According to KPRA’s record, you have not filed returns for [month]. To avoid any legal trouble/difficulties, file returns as soon as possible’.
• The loss aversion (LA) warning message had a similar content as the LA reminder message but also specified the penalty for failing to file: ‘Your continued failure to file taxes may lead to a penalty of PKR 5000 or more and deactivation of your account. Please file your taxes immediately’.Footnote 10
• The active choice (AC) message is informed by recent literature that suggests that framing non-performance as an AC, rather than omission, can influence individual repayment rates (Hallsworth et al., Reference Hallsworth, List, Metcalfe, Rotaru and Vlaev2024). It frames the continued failure to file tax as a choice with serious legal repercussions, rather than an oversight by the recipient: ‘Deemed an oversight till now, your continued failure to pay taxes will be now treated as a conscious criminal activity by the KP government’.
Messages that appeal to norms and moral suasion may be more effective when combined with deterrence messages (see Alzate (Reference Alzate2022) for a review). We test if the new text messages informed by recent behavioural literature can be effective in improving taxpayer behaviour over the status quo, basic message combinations. In addition, we test if specific combinations of text messages can be effective in improving filing behaviour.
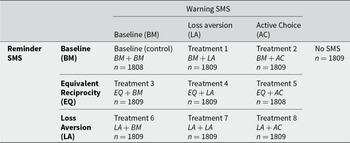
The reminder and warning messages were combined using a 3 × 3 factorial design, resulting in nine distinct reminder and warning message combinations. In addition to these nine groups, a group of service providers received no messages – neither a reminder nor a warning message. Table 1 summarises the structure of the intervention and control groups.
Structure of treatment and control groups

Table 1 Long description
The table lays out how registered taxpayers were assigned to reminder and warning SMS message combinations, plus a group that received no SMS. Columns list warning message types: baseline, loss aversion, and active choice, along with a separate no SMS column. Rows list reminder message types: baseline, reciprocity, and loss aversion. Each reminder by warning pairing forms a treatment group, labeled Treatment 1 through Treatment 8, while baseline reminder with baseline warning is the control group. Group sizes are highly balanced: most cells have 1,809 participants, with two cells at 1,808. The no SMS group also has 1,809 participants. Because counts are nearly identical across groups, differences in later outcomes are unlikely to be driven by unequal group sizes rather than the message content.
Note: The table summarizes groups that registered taxpayers were randomized into. Each group is represented by a different reminder and warning message. Shortened names of message types are given in parentheses.
Reminder text messages were sent out to all registered service providers before the 15th of the relevant month to remind them to file tax by the 18th of the month. Warning messages were sent out the following week to those who had not filed their monthly tax returns. For instance, for June filing, reminder messages were sent out on 14 July 2022; and warning messages were sent out to those who had not filed taxes by the 18th on 26 July 2022. The exact date on which SMSs were sent out in each month of the study is provided in Table A1 in the Appendix.
Based on other experiments conducted by the research team in a similar setting, the cost of an SMS to KPRA is approximately PKR 2. Over a six-month period, we sent reminder SMS to 16,278 respondents in nine groups, along with warning messages to those who had not filed by the 18th of each month. In total, each respondent could receive up to 12 messages (six reminders and six warnings). The total cost of the SMS intervention was approximately PKR 390,672 (USD 1,975.09), amounting to no more than PKR 24 (USD 0.12) per respondent. This results in an expected return of PKR 3,954 (USD 19.99) per respondent who received the SMS, yielding a favourable return-to-cost ratio of PKR 165 in tax filed for every PKR 1 spent.Footnote 11
Ex-ante, given the low cost per respondent; SMS is considered a cost-effective communication method. A modest increase in filing rates due to the change in SMS content could generate significant additional revenue. For example, if 1% more of the 16,278 respondents file, we would expect an increase of PKR 638,503 (USD 3,228) in additional revenue, without any incremental cost to KPRA.Footnote 12
Sampling
Service providers were randomly and individually selected to be part of one of the 10 groups. Once assigned to a group, each service provider remained in that group for the entire duration of the study. The treatments were implemented between June and November 2022. Table 1 provides the number of taxpayers randomly allocated to each group.
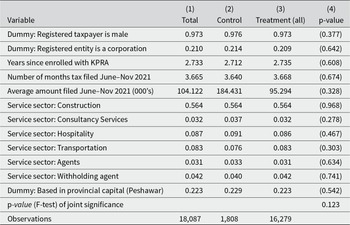
With individual randomization and a large sample size, the study has good balance on several characteristics across the ten groups (Table 2). Specifically, there is balance in terms of the gender of registered taxpayers, whether the entity is corporate or non-corporate, the time since first enrolment with KPRA, the service sector, and if the service provider is in the provincial capital. In the period from June to November 2021, on average, study participants filed taxes for three out of six months. The amount of tax filed, including instances of 0 or null filing, in the control group is approximately twice the amount in the intervention treatment groups, but this difference is not statistically significant. In Appendix Table A2, we report the sub-sample mean for all treatment groups (SMS and no-SMS groups) and find no significant differences in the characteristics of the study participants across the various groups.Footnote 13
Description of the sample at baseline
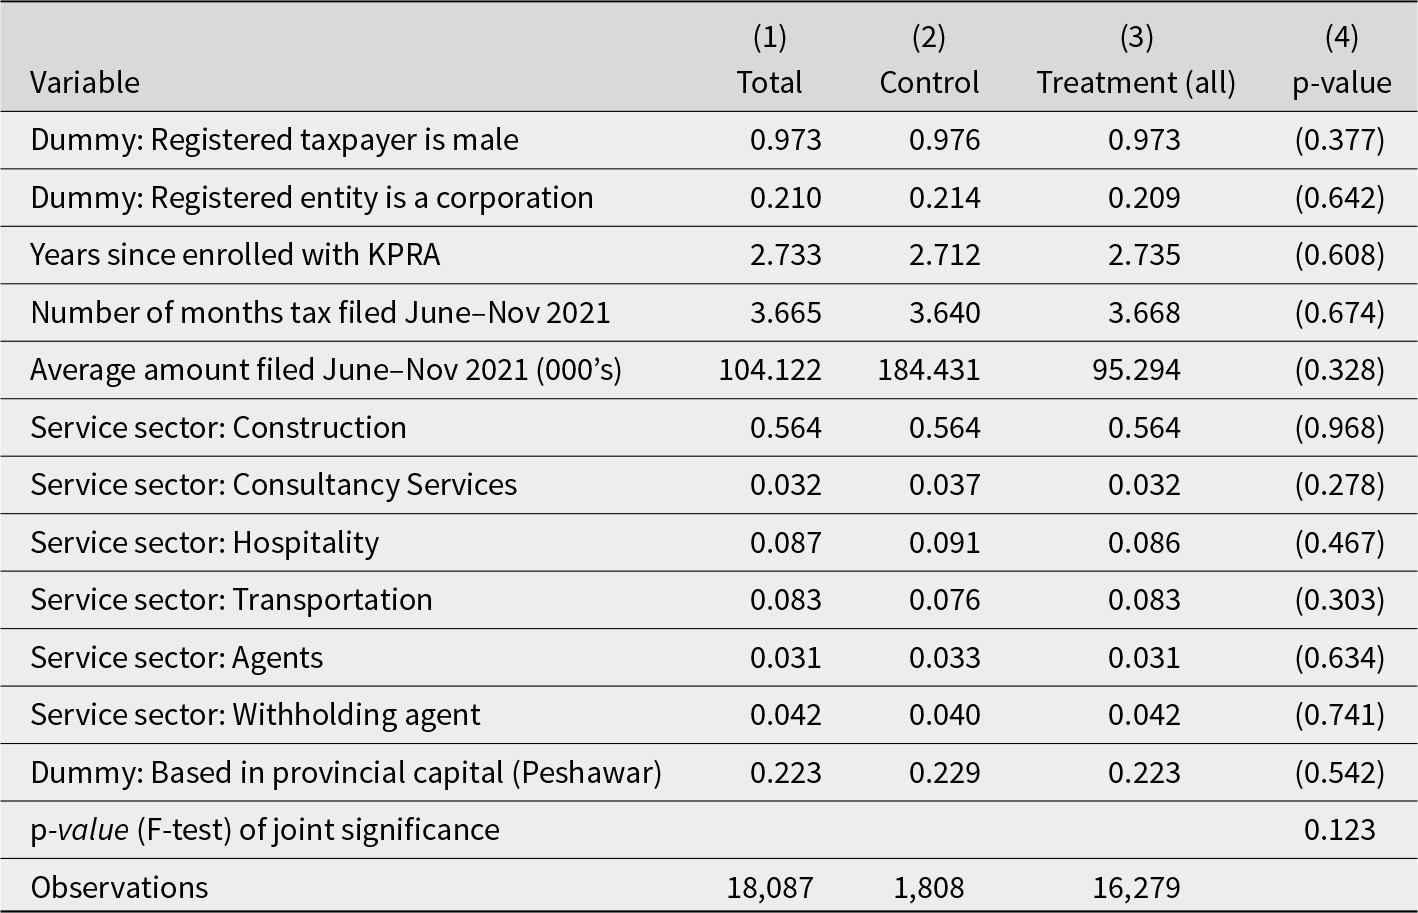
Table 2 Long description
Baseline means are reported for the full sample, the control group, and the combined treatment groups, with a p-value for each control versus treatment comparison. The sample is mostly male taxpayers, about 0.97 in both control and treatment. About 0.21 of registered entities are corporations, and participants have been enrolled for about 2.7 years on average, with nearly identical values across groups. Tax filing activity from June to November 2021 averages about 3.7 months in both groups. The average amount filed over the same period is higher in the control group than in treatment, but the difference is not statistically meaningful based on the reported p-value. Sector shares are similar across groups, with construction the largest category at about 0.56, and smaller shares for hospitality, transportation, consultancy services, agents, and withholding agents. About 0.22 are based in the provincial capital, again with little difference between groups. The joint significance test indicates no overall baseline imbalance between control and treatment groups. The table includes 18,087 observations total, with 1,808 in control and 16,279 in treatment; some variables have missing values, and the filing amount is computed only for those who filed in the period.
Note: This table provides sample means for variables mentioned in each row. Column 1 provides mean values for the total sample, column 2 provides the mean for control (‘BM + BM’) group, and column 3 provides the mean for all other SMS + no SMS groups introduced in the experiment. Column 4 provides p-value from a t-test on differences across control and treatment means. p-value from a F-test of joint significance is reported on the second last row. Gender and years since registration are missing for 47 and 42 participants, respectively. Average amount filed is calculated on a sub-sample of 13,036 participants who filed taxes in the relevant period.
Estimation strategy
Our basic estimating specification is:
 \begin{equation}\begin{gathered}
{y_i} = {\beta _0} + {\beta _1}.{T_{1i}} + {\beta _2}.{T_{2i}} + {\beta _3}.{T_{3i}} + {\beta _4}.{T_{4i}} + {\beta _5}.{T_{5i}} \hfill \\
\;\;\;\;\;\;\; + \;{\beta _6}.{T_{6i}} + {\beta _7}.{T_{7i}} + {\beta _8}.{T_{8i}}{X_i} + {\beta _9}.NoSM{S_i} + {\varepsilon _i} \hfill \\
\end{gathered} \end{equation}
\begin{equation}\begin{gathered}
{y_i} = {\beta _0} + {\beta _1}.{T_{1i}} + {\beta _2}.{T_{2i}} + {\beta _3}.{T_{3i}} + {\beta _4}.{T_{4i}} + {\beta _5}.{T_{5i}} \hfill \\
\;\;\;\;\;\;\; + \;{\beta _6}.{T_{6i}} + {\beta _7}.{T_{7i}} + {\beta _8}.{T_{8i}}{X_i} + {\beta _9}.NoSM{S_i} + {\varepsilon _i} \hfill \\
\end{gathered} \end{equation}yit is an outcome variable for individual i registered with KPRA, T 1i–T 8i are binary variables capturing exposure to treatments 1–8 described in Table 1, NoSMS is a dummy variable capturing exposure to the ‘No SMS’ group. In the appendix, we show robustness of this analysis when we include sector and region fixed effects, and with error clustered at the individual level. The main hypothesis we propose to test is that exposure to the treatments and not receiving SMS messages has no differential impact on compliance relative to the compliance in the control, BM + BM, group; i.e., H 0: βk = 0; k = 1, 2, …, 9. We will measure an intent-to-treat effect, as we do not have data on the delivery or open rates of the SMS messages. This limitation is a practical constraint in the field, given the phone numbers were collected at the time of registration and are updated only when taxpayers provide new information. We acknowledge that the unavailability of delivery or open rates may bias the overall results observed. For instance, if a significant proportion of SMS messages were never opened, the observed treatment effect could be an underestimation of the true effects.
KPRA collects data on the date that tax returns are filed and the amount of any return filed by all registered service providers. The primary objective, as stated by KPRA, is to encourage taxpayers to file their returns at all, rather than strictly by the specified dates. This approach also aligns with the expectation of the study participants who, under status quo, do not anticipate having to adhere to strict, date-based deadlines for filing returns. Correspondingly, our main outcome is in the likelihood of filing within the five months that KPRA typically waits before considering further action.
Our data tracks filing behaviour for a period of five months that the monthly tax returns are due. We estimate the impact of the intervention on three outcomes:
i. The average likelihood of filing monthly tax returns for the period June–November 2022, within the study observation period of 150 days past the due date (15th of the month).
ii. The delay in filing taxes. This is a continuous variable that measures the days past the due date that tax returns are filed and is only measured for those who file taxes.Footnote 14
iii. The amount of tax filed. This outcome is the amount of tax filed for June–November 2022 and is only measured for those who file taxes.Footnote 15
We expect the interventions may have differential impact over time. Specifically, that the new SMS messages may be most effective in the earlier months, when they are novel; and that the impact may reduce over time. To test for this, we test for treatment effects on delay (outcome ii) for each month.Footnote 16 Literature suggests that the impact of treatments may vary depending on the type of taxpayer, such as the size of the firm or income (Mascagni and Nell, Reference Mascagni and Nell2022), history of being monitored (Ortega and Sanguinetti, Reference Ortega and Sanguinetti2013), history of evasion and voluntary filing (Dwenger et al., Reference Dwenger, Kleven, Rasul and Rincke2016). Moreover, recent evidence indicates that non-specific threats in messages, such as those related to LA and AC, work by prompting recipients to anticipate likely consequences. The expected consequences of non-filing are likely to differ among taxpayers, considering factors such as their experience with KPRA, potential revenue loss from tax payments, or expected penalties for non-filing.
In the next section, we investigate whether the treatment effects vary based on the service providers’ compliance history, measured by the duration of voluntary registration with KPRA, corporate vs non-corporate status, and the amount of the tax return filed in the year prior to the study available in the administrative data. We re-estimate equation (1) for these sub-samples and examine the equality of predicted outcomes across these sub-samples.
To correct for multiple hypothesis testing, we calculate Holm–Bonferroni adjusted p-values (Westfall and Young, Reference Westfall and Young1993; Jones et al., Reference Jones, Molitor and Reif2019). The significance of unadjusted p-values is denoted by *, ** and *** for 10%, 5% and 1% levels, respectively, while adjusted p-values are denoted by A, AA, AAA for 10%, 5% and 1%, respectively.
Results
This section presents the results of our empirical analysis for the outcomes specified in the previous section, as well as the heterogeneity in treatment effects based on taxpayer behaviour at BM. For each result discussed below, we compare the new intervention text message combinations with the BM messaging (the status quo group). We summarise these results in the graphs presented below. The corresponding tables, from which the figures are constructed, are in the appendix. All the results presented here are robust to the inclusion of taxpayer controls, such as an indicator for the time since the taxpayer has been registered with KPRA and whether they represent a corporate entity, as well as sector and provincial region fixed effects (see Table 3 in the main text – Table A5 in the appendix).
Impact on likelihood of filing and amount filed
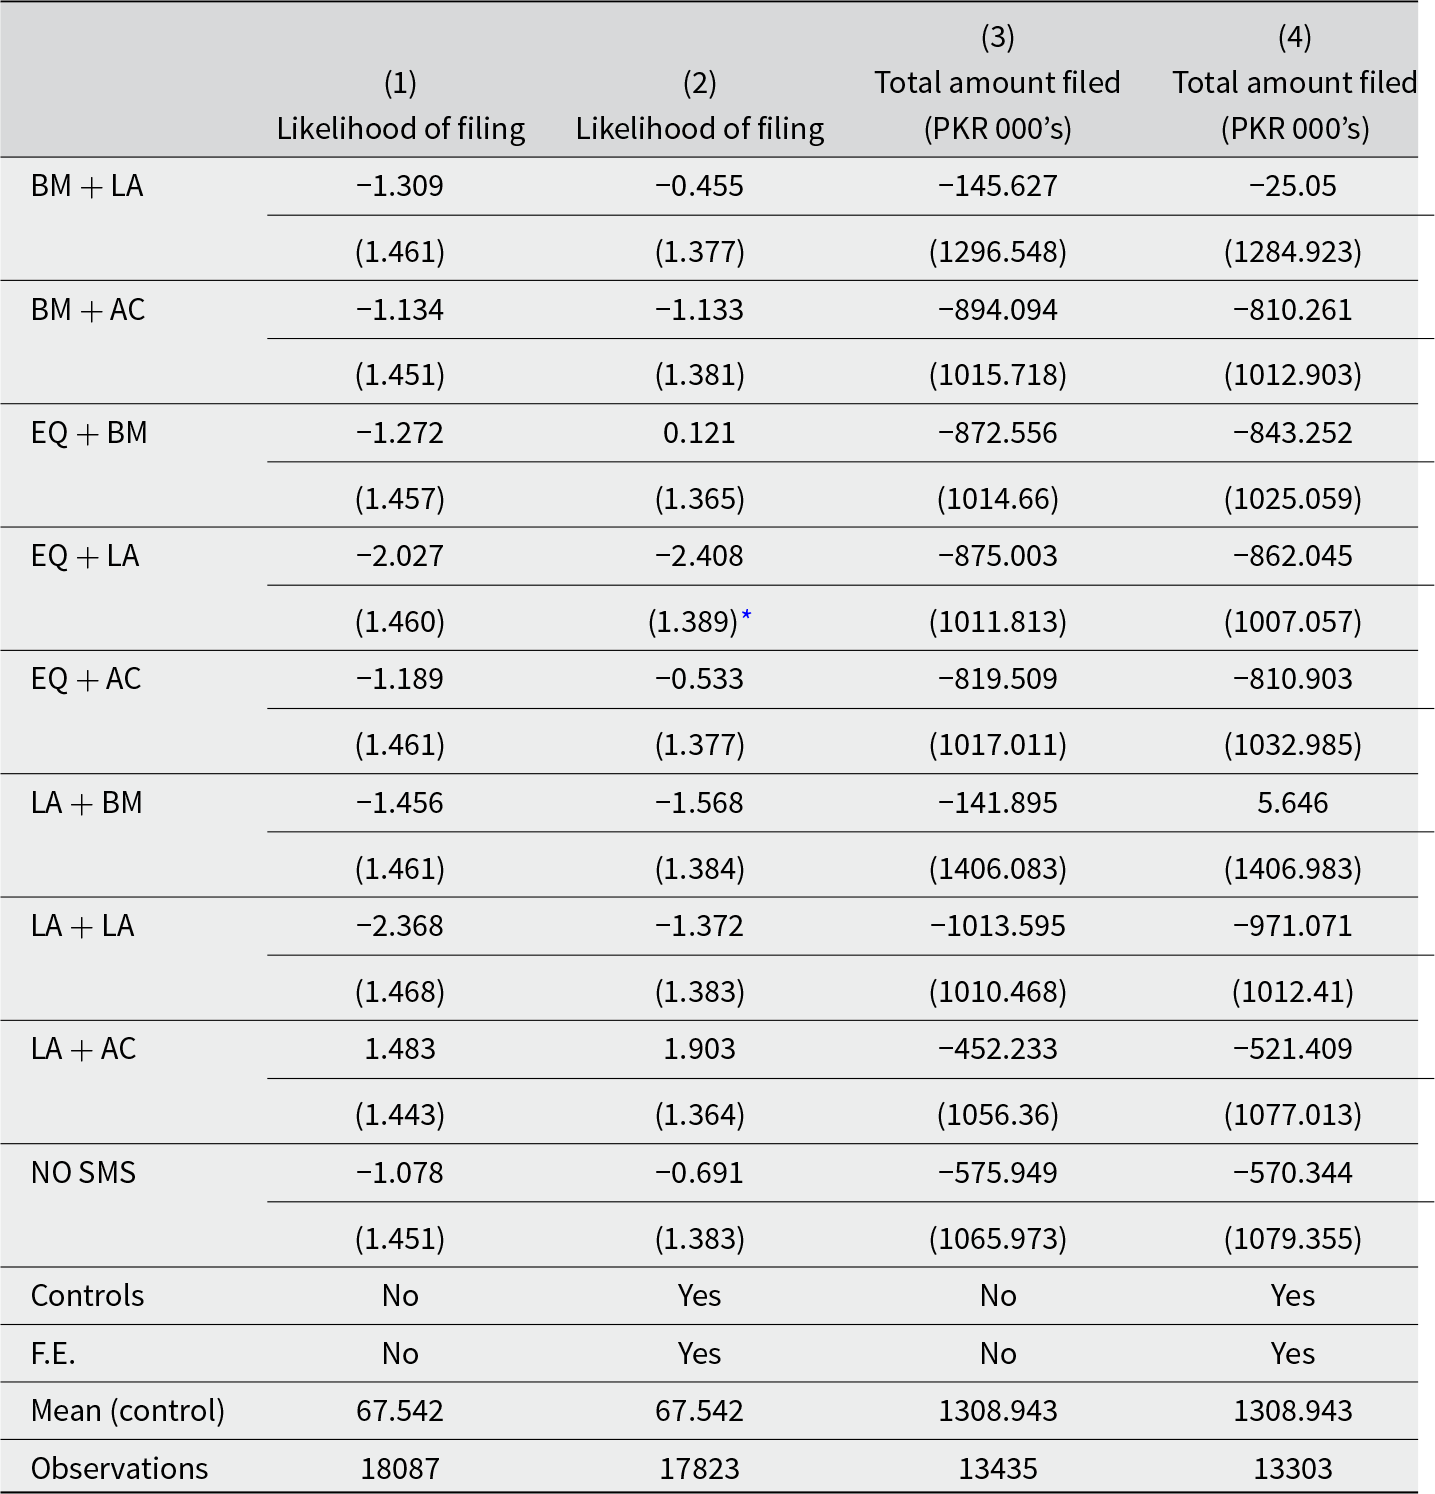
Table 3 Long description
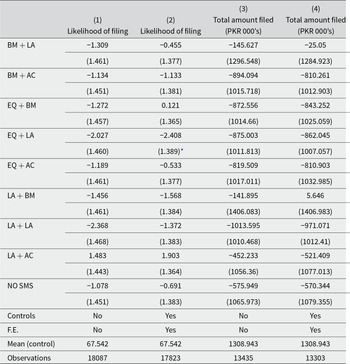
The table reports regression estimates for two outcomes measured within five months of the due date: likelihood of filing (columns 1 and 2) and total amount filed in thousands of PKR (columns 3 and 4). Each row compares a reminder and warning message combination against the baseline control group, with columns 2 and 4 adding controls and region and sector fixed effects. For filing likelihood, most message combinations have negative coefficients, and the only estimate marked as statistically notable is EQ plus LA in the controlled specification, which is more negative than the other groups. One combination, LA plus AC, is positive for filing likelihood in both specifications, but it is not marked as statistically notable. For amounts filed, all message combinations show negative coefficients in both specifications, with the largest reductions around one million PKR (in thousands) for LA plus LA and for BM plus AC, though none are marked as statistically notable. The control-group means are about 67.5 for filing likelihood and about 1308.9 thousand PKR for amount filed. Sample sizes are larger for filing likelihood than for amounts filed, and they drop slightly in the controlled specifications due to missing covariate data; standard errors are clustered at the individual level.
Note: The table summarizes OLS estimation of equation 1 for outcomes mentioned in column headers. Columns (1) and (2) present results on the predicted probability of filing within five months of the due date for each group. Predicted values from column 1 are plotted in Figure B2 in the appendix. Columns (3) and (4) present results on the predicted amount (PKR 000’s) filed within five months of the due date for each group. Data on location is missing for 240 participants, and time since registration is missing for another 24 participants. This explains why the sample size in columns 2 and 4 are lower than in columns 1 and 3. Predicted values from column 3 are plotted in Figure B3 in the appendix. BM refers to baseline, LA refers to loss aversion message, EQ refers to the equivalent reciprocity message and AC is the active choice message. Reminder messages are labelled first, warning messages type are reported second in the form reminder type + warning type. Controls include indicators for whether the taxpayer represents a corporation and the time since they registered with KPRA. Fixed effects (F.E.) include region and sector fixed effects. ‘Mean (control)’ is the mean outcome value for the control (BM + BM) group. Errors are clustered at the individual level.
* p< 0.1.
Likelihood of filing
We tested if respondents in the intervention groups were more likely to file monthly returns compared to the control, i.e., the BM + BM messages group. Results are provided in Table 3, column 1. Figure B2 in the appendix plots the predicted likelihood of filing monthly tax observed 150 days after the due date of each month. The control group (BM + BM) shows an average likelihood of filing monthly tax at 67.5%, which slightly decreases in all treatments except for the LA reminder and active warning message. In the latter treatment, the compliance or filing rate is 69.0%, a difference that is not statistically significant compared to the rate in the control text message group. No difference is statistically significant after adjusting for multiple hypotheses testing.
It is worth noting that the group that does not receive any SMS reminders or warnings does not exhibit a significantly lower compliance rate than any of the other groups, except for the LA + AC group. The p-value for the statistical difference in compliance rate between the LA + AC group and the no SMS group is 0.077, indicating significance at the 10% level. However, this result should be interpreted with caution, as it is not consistently supported by other outcome measures (discussed next). Overall, these results suggest that the continued use of text reminders and warnings in this context may have limited and insignificant impact on enhancing the filing behaviour of taxpayers.
There are several potential explanations for the overall insignificant impact. First, literature suggests multiple reasons for low compliance rates in response to non-personalized communication. Compliance may be higher if the message is personalised, accompanied by an in-person visit or notification, or supported by third-party data verification (Brockmeyer et al., Reference Brockmeyer, Smith, Hernandez and Kettle2019; Boning et al., Reference Boning, Guyton, Hodge and Slemrod2020; Ortega and Scartascini, Reference Ortega and Scartascini2020). Second, KPRA does not initiate audit or enforcement procedures if taxes are not filed by the 18th of the month and enforcement, when it occurs, is not automatic or rule-based. The experience of this general lack of strict enforcement may lead taxpayers to disregard the messages. Additionally, during the COVID-19 pandemic and the post-pandemic period, KPRA implemented several measures to alleviate the tax burden on service providers, including extending filing deadlines that may have set a precedent for flexibility in tax compliance. Finally, as noted earlier, there is a possibility that the frequently sent messages were not read, leading to a lack of significant differences between different groups, e.g. the BM messaging and no SMS groups.
Monthly delay in filing taxes
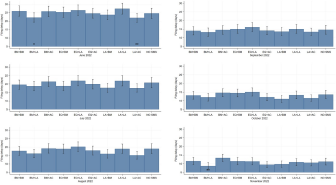
We examine whether the new behavioural text messages perform differently from the BM messages in reducing the delay in filing for each month. Specifically, we investigate whether the delay in days for filing taxes is statistically different for individuals in the new message groups than in the baseline (BM + BM) group. The results are presented in Figure 2.
Days delay in filing (past due date) for each month, June–November 2022.

Figure 2 Long description
The image contains six bar graphs, each representing filing delay in days for different message groups from June to November 2022. The horizontal axis for all graphs lists message groups: BM plus BM, BM plus LA, BM plus AC, EO plus BM, EO plus LA, EO plus AC, LA plus BM, LA plus LA, LA plus AC, NO SMS. The vertical axis shows filing delay in days, ranging from 5 to 30. June 2022: The BM plus BM group shows the lowest delay, while LA plus AC has a higher delay. Notable outliers are marked. July 2022: Delays are relatively consistent across groups, with slight variations. August 2022: EO plus LA shows a lower delay, while BM plus AC is higher. September 2022: Delays increase slightly, with EO plus AC showing a notable peak. October 2022: LA plus BM has a lower delay, while EO plus BM is higher. November 2022: Delays are generally lower, with BM plus LA showing the least delay. Error bars indicate variability in filing delays. Each graph allows comparison of message group performance over different months, showing trends and changes in filing delays.
In the first month of the experiment (June 2022 in Figure 2, top left corner panel), two combinations of LA messages reduce the filing delay by approximately four days each. The first combination consists of the BM reminder message in combination with a LA warning message, while the second combination includes the LA reminder message combined with the AC warning message. These results suggest that nudging taxpayers to consider the financial and legal consequences of not paying on time can effectively reduce the filing delay. A reduction of four days is meaningful as it signifies a shift for individuals who typically pay after the 18th of the month (the last allowable date for filing before KPRA can take action) to start paying on time on the 15th of the month, as intended by the tax authority. However, these effects are transient and disappear in subsequent months, and do not remain significant after correcting for multiple hypothesis testing.
Amount filed
Next, we restrict the sample each month to registered taxpayers who file monthly returns (whether on time or with a delay), and test if the behavioural messaging impacted the amount compared to the group receiving BM messages. We found that the total amount filed by each new treatment group was lower than the amount filed under the control group’s combination of baseline messages (BM + BM). However, none of these differences are statistically significant, including for the group that received no messages at all. Figure B3 in the appendix summarises these results.
The sub-sample of respondents who file during the study period are likely to be different from respondents who never file. Indeed, the never filers are also less likely to have filed taxes in the past (same period last year), are more likely to be corporations and less likely to be in the construction industry. Table A3 in the appendix describes the sample of respondents who file and never file in the study period. Results are robust to the inclusion of controls for BM characteristics, and region and sector fixed effects (column 4 in Table 3). However, because the sub-sample of filers is likely to be a selected sample, and due to the reduced statistical power and large variance in the outcome measure, precision of our analysis is reduced. We interpret these effects with caution.
Heterogeneity analysis
Though the differences between the new and BM SMS combinations are not significant on average, we test if certain sub-groups of taxpayers were more (or less) amenable to change in response to certain messages. Specifically, we explore if results vary by the quality of compliance. We exploit three characteristics in administrative data.
First, we examined the length of time that service providers had been registered with the provincial revenue authority. Since registration is voluntary and entering the tax net is generally met with reluctance, early registration can serve as a proxy for relatively higher compliance with the sales tax regime. This group can be considered as having high habit formation, with older taxpayers more likely to exhibit consistent tax filing behaviour.
Second, we consider corporate and non-corporate entities. Corporations, by virtue of their formal structure and regulatory requirements, may exhibit different compliance behaviours compared to non-corporate entities.
Third, we considered the fact that a significant proportion of the sample did not file taxes at all, and among those who did, the median taxpayer filed either zero returns or ‘null’ returns. The subset of taxpayers who filed positive and relatively larger amounts of tax returns, on average, can be regarded as more compliant taxpayers. Note, the amount of tax filed in the past is an imperfect proxy of taxpayer quality. The average amount filed may not accurately represent the actual economic activity (Waseem, Reference Waseem2023), and those whole file a non-zero amount are likely to be a select sub-sample. Nevertheless, despite this limitation, we believe that analysing these sub-samples will still provide valuable insights into the characteristics of taxpayers who pay attention to messages emphasising the social, financial, and legal consequences of non-filing.
The three groups of taxpayers can be regarded as having more at stake, not only in financial terms but also in relation to their reputation and established connections with state authorities. Reputations and networks could be jeopardised if the state follows through on the threats mentioned in the LA and AC messages.
Early vs recent registration
The median service provider in our sample has been registered with KPRA for 2.5 years. We carry out a median split, dividing the sample into two sub-groups: ‘early’ service providers who have been registered for equal or longer than the sample median of 2.5 years (or 30 months) and ‘recent’ service providers who have been registered for less than 2.5 months.Footnote 17 We re-estimate equation (1) for the two sub-samples.
Results for the likelihood of filing tax within the 150-day window of the due date are provided in Fig B3a in the appendix. Note, there is no significant difference in the likelihood of filing of early and more recent registered service providers in the status quo group that receives the BM reminder and warning messages (BM + BM). However, likelihood of filing among taxpayers who registered relatively early, shown in the black solid line, is significantly higher than those who have recently registered for all other message combinations, including the group that has not received any text messages. Except for the difference in one group (BM + LA), the significant differences in treatment effects across sub-samples remain statistically significant after correcting for multiple hypothesis testing.
Among those who registered early, the new SMS combinations and the no SMS group have a higher probability of filing than the control group but this difference is statistically insignificant for all groups except the LA + AC group. Service providers who received the LA reminder and AC warning message combination are 5 percentage points more likely to file returns than the early registered taxpayers who receive the BM + BM messages. This difference is significant at the 5% level (p = 0.015).
Interestingly, several message campaigns exhibited a decrease in compliance within the recent registration subgroup. The combinations of BM messages with AC and LA, along with combinations of EQ reminder messages with either LA or AC, as well as not receiving any messages (no SMS), reduced the likelihood of filing from 67.3% in the control (BM + BM) group to 61.2–63.7% in these groups. The combination of LA and AC messages continued to be of interest: recently registered taxpayers who received this combination of messages were not significantly less likely to file returns during the sample period compared to the BM group. The difference was small (1.7% points) and statistically insignificant (p = 0.392).
These trends are in line with the trends seen in the day’s delay: service providers who registered earlier have, on average, fewer delays in filing tax across control and intervention groups (Appendix Figure B5). However, the difference in delay in filing for the BM + BM group and the other messages as well as the no SMS groups are never statistically significant.Footnote 18
Overall, these results indicate that the new messages had an impact on improving the filing behaviour of the more ‘compliant’ taxpayers, but it was a limited one. Specifically, the likelihood of filing was statistically higher for the LA reminder and AC warning message combination compared to the control group.
Corporations vs non-corporate entities
Our analysis shows that corporations are slightly less likely to file on time compared to non-corporate entities but this difference is statistically significant only for groups involving EQ reminders (specifically, EQ + BM and EQ + AC in Figure B4, panel b). When examining the filing delay per month, the behaviour is very similar across both sub-groups (Figure B6). This suggests that the organisational structure may have influenced the immediate responsiveness to specific types of reminders, but the long-term filing behaviour remains relatively consistent across these groups.
Large vs small filers
We consider the tax filed in June 2021–May 2022, before the experiment was implemented. A little under one-fifth of the sample (or 3486 registered service providers) had filed non-zero returns in at least one of the months during this period. We use the median amount of total tax filed (PKR 141,828 or USD PPP 3,216) to split the sample into small and large tax filers. We rerun the analysis for the sub-sample of median-and-above and below-median amount filers.
We find that the large-tax filers are more likely to file than small tax-filers, and this difference is always significant for all but the control, BM + BM, group (Figure B4c). Among the sub-group of high tax filers, the difference in likelihood of filing for the LA + AC group is higher relative to the BM + BM group by 3 percentage points and statistically significant (p = 0.047). This suggests that the LA + AC intervention may be effective in improving compliance among those who have historically filed a high amount. Those who previously filed a higher amount, also file with less delay than those who file a low amount, though this difference is not consistently large or statistically significant (Figure B7).
The analysis suggests that the subgroup of high-service providers is potentially more responsive to messages that emphasise financial and legal penalties, and as expected, we observe their reaction to such warning messages. However, these results do not survive multiple hypothesis testing correction, indicating that the effects are not robust. It is also important to note that this analysis is based on a selected and smaller sub-sample of study participants and is to be interpreted with caution.
Conclusion
Dealing with tax compliance can be challenging when tax authorities rely on voluntary registration and self-reported information. Traditional approaches focus on economic incentives, detection likelihood and penalties. However, recent findings suggest that non-specific penalty messages can be as effective as specific messages (Floyd et al., Reference Floyd, Hallsworth, List, Metcalfe, Rotaru and Vlaev2022).
In this study, we conducted a randomised controlled trial to estimate the impact of SMS interventions on sales tax return filing. From July to December 2022, we randomly assigned 18,087 registered service providers to 10 groups as part of a 3 × 3 design: three monthly reminder messages (status quo saliency, moral suasion, and hinting at financial penalties and deactivation) and three warning messages if returns were not filed (status quo saliency, suggesting financial penalties and deactivation, and highlighting legal consequences). One group received no messages, serving as the control group.
Over a 150-day period after each month’s due date, the new intervention messages did not improve filing rates compared to the status quo messaging on average. The no message group did not experience a decline in filing behaviour. However, sub-sample analysis revealed heterogeneity. Among early registrants, the combination of reminders hinting at financial penalties and deactivation (LA) with warning messages highlighting legal repercussions (AC) significantly improved filing rates compared to status quo messages. However, among recent registrants, the interventions worsened filing likelihood, except for the combination of LA reminder and AC warning, which showed no difference from the status quo group. These findings suggest certain groups of taxpayers may be more ‘receptive’ than others, e.g., those who have a longer history of dealing with the state authorities or could have financial or reputational costs from state action.
The study contributes to literature in three key ways. One, instead of relying on infrequent contact and allowing lags between the receiving reminders and due dates, the design makes use of frequent messages sent out close to relevant dates to encourage follow through.
Second, the study setting is similar to many developing world contexts, with low compliance and high tax evasion rates. For Pakistan, in particular, this study represents the first field experiment exploring the impact of a low-cost intervention on tax compliance.
Third, the factorial design provides a clean test of whether SMS interventions work and the combination of messages that may be most effective in such settings. In this study, it was a combination of messages that made salient the possibility of financial and legal repercussions without specifying the extent of penalty and enforcement that was most effective for particularly receptive taxpayers. The study highlights that periodic messaging from the tax authority may not significantly change compliance behaviour on average. After initial tax filing requirements are acknowledged, less frequent messaging might be adequate, aligning with findings that deadline reminders often show null effects on tax filing compliance. Documenting null effects is useful for KPRA and the broader behavioural science literature. They highlight the importance of context in determining the effectiveness of interventions. Subtle nudges, even if they are low-cost and easy to implement, may not always work as intended. In some cases, they can signal to taxpayers that enforcement is not strict, potentially undermining the intended compliance behaviour. Recent studies indicate that messaging about compliance issues can backfire by reducing confidence in enforcement and encouraging negative attitudes toward authorities. In other cases, threats of punishment that are vague in nature, rather than those that specify the likelihood and extent of penalties may be more effective (Floyd et al., Reference Floyd, Hallsworth, List, Metcalfe, Rotaru and Vlaev2022). These insights are valuable for designing future interventions and understanding the nuances of taxpayer behaviour (Cheesman and Peiffer, Reference Cheesman and Peiffer2024).
We cannot comment on the effects persisting for periods longer than the months observed in our analysis, or if the impacts of the new intervention messages will taper off when the service providers don’t find the messages to be novel or credible. Literature suggests that the impact of any soft-touch intervention may be higher if they are provided in a setting where credibility of the information is high (Carrillo et al., Reference Carrillo, Pomeranz and Singhal2017; Brockmeyer et al., Reference Brockmeyer, Smith, Hernandez and Kettle2019; Eerola et al., Reference Eerola, Kosonen, Kotakorpi, Lyytikäinen and Tuimala2020). Future research could explore if complementary interventions, such as personal follow up visits, could lead to sustained improvement in filing behaviour over time.
Supplementary material
To view supplementary material for this article, please visit https://doi.org/10.1017/bpp.2024.61.
Acknowledgements
We thank the UK-aid and the Foreign, Commonwealth Development Organization’s (FCDO) Sustainable Energy & Economic Development (SEED) Programme, implemented by Adam Smith International, for their generous support in making this research endeavour possible; and to Qatar’s B4Development (B4D) for technical inputs and support throughout the experiment. The experiment would not have been possible without the guidance and ownership of our implementation partners - the Khyber Pakhtunkhwa Revenue Authority (KPRA), and the KP Mindlab, Government of Khyber Pakhtunkhwa, Pakistan.


 Open access

