During the 14 years from 1947 through 1960, choreographer Katherine Dunham spent over 5,000 days in approximately 190 unique cities over 433 trips on every continent but Antarctica.Footnote 1 At various moments during that time, 189 dancers, drummers, and singers traveled with Dunham, performing over 166 pieces of active repertory in various configurations.Footnote 2 We know this because we have been working through Dunham’s extensive archives, manually curating datasets that trace these people, places, and pieces as part of an ongoing project combining qualitative and quantitative methods to explore the questions and problems that make the analysis and visualization of data meaningful for dance historical inquiry.Footnote 3
Although digital methods have become increasingly commonplace in most humanities fields, dance historians have yet to propose how such tools are useful, or to adapt them to dance’s specific questions, concerns, and traces. In “Against Cleaning,” Katie Rawson and Trevor Muñoz point to pervasive lingering suspicions of data‐driven approaches, based on the fear that data models are reductive (Reference Rawson, Muñoz, Gold and Klein2019). However, they argue that these very approaches can demand deeper research into the meaningful messiness of distinguishing features, overlaps, and similarities, which reintroduces the kind of ontological complexity that more conventional historical narratives sometimes occlude in favor of discrete, easily narratable chunking. Dance scholarship often relies on such narratable units of analysis as “the work,” “the company,” or “the tour,” in order to manage historical complexity, but looking closely at the Dunham archives complicates these organizing fictions. For example, Dunham consistently remixed her repertory for new contexts by adding components, changing titles, growing and shrinking casts, and otherwise adapting her choreography on an as‐needed basis. Similarly, the number of performers touring with Dunham expanded and contracted, shifting our understanding of what constitutes a company from a semi‐stable organization toward a porous and dynamic “movement community” that traveled the world. Touring here is most appropriately retained as a gerund, since Dunham’s company was almost always traveling, without discretely identifiable starting or stopping points for years on end. Such touring further connects people, places, and pieces; Dunham reimagined and circulated African diasporic representations through her choreography, and new performers brought practices with them when they joined. As they moved on, Dunham dancers spread the embodied knowledge of their movement community.
Working in relation to data challenges typical models of thinking dance history at the scale of the privileged example and the signature work, or what we have previously described as the “mid‐field view [used] to build broad narratives through a small set of exemplary moments that anecdotally illustrate an argument about the arc of an artist’s lifetime or their body of work” (Bench and Elswit Reference Bench and Elswit2020a). The scales of digital analysis range from the quotidian minutiae that underlie each individual datapoint, to the systemic connections they cumulatively reveal. When employed in tandem with conventional approaches to archival research, such methods can further dance studies’ ability to tackle critical questions that arise from the global circulation and diffusion of artists, practices, and ideas,Footnote 4 including retaining the complexities of company membership, touring, and repertory both separately and as intersecting phenomena.
In a 1994 essay, VèVè Clark argues for the need to study Dunham in relation to the entanglement of multiple elements simultaneously, from Dunham’s own travels to the touring of her productions, and from her own embodied learning to the transmission of repertory among company members. Dunham’s approach to choreography drew from practices around the world, in a manner that Clark describes as a “research‐to‐performance method” that enabled her to stage “dance forms recreated from African diaspora memory” and teach audiences to see diaspora as both cultural and performative ([1994] Reference Clark, Clark and Johnson2005a:323).Footnote 5 In order to better understand the complexity of this phenomenon, Clark theorizes this “memory of difference” as “a paradigm for examining the dialogues between research and performance; between research and the training of dancers; and between the established order of repertoire and the ways it changes over time” (327). Working with data offers a complementary approach to maintaining the complexity of these layers. For example, with regard to the distinction between the tour and touring, a granular approach to cataloguing where Dunham was located every single day can help us to think about the individual venues and locations where she appeared, which, in turn, rebalances the geographic distribution of Dunham scholarship and reveals the embodied politics of the everyday. While many mid‐century dance artists used touring as a source of income and inspiration, Dunham was also invested as an anthropologist in dance’s relation to place, even as her pursuit of solvency was intertwined with her extraordinary transnational circulation—what we describe as Dunham’s “global method” (Bench and Elswit Reference Bench and Elswit2020a). Artistic questions cut into and across the particularities of such touring, the flow of personnel in and out of Dunham’s company, and the remixing of repertory.
Dunham was an extraordinary self‐archivist and our datasets draw almost entirely from undigitized archival materials that Dunham herself saved and donated.Footnote 6 The process of manually curating data from archival materials draws us closely into the lived experiences they index, as we grapple with the multiple and conflicting stories behind each datapoint, and what each signifies.Footnote 7 Ultimately, the Everyday Itinerary dataset will encompass where Dunham was for approximately 25 years of her performing career, of which we currently have documented 97% of the days from 1947–1960. Whereas the Everyday Itinerary accounts for Dunham’s own daily travels, the Performer Check‐In dataset accounts for the comings and goings of her dancers, drummers, and singers over that time, helping to discern who was in the studio and theatre together. The Repertory dataset catalogues the various titles and descriptions by which pieces of choreography were identified in programs, the fluid relationships among them, and the associated performers and years performed. Concurrently developed, these multiple datasets support one another. As an example, when we find a program in Italian that does not list a theatre or year, we first look to an evolving dataset of Performer Check‐Ins to begin to identify the timespan during which named performers were employed by Dunham; we then return to our Everyday Itinerary dataset to determine when we have identified that the company was performing in Italy within those date parameters, and we may further refine that dating using newspaper reviews that reference specific pieces of repertory. Once dated these programs in turn provide further information for other datasets, including additional entries to Performer Check‐In and Repertory.Footnote 8
Feminist and antiracist approaches help us to think about how such data can open out the material nature of lived experience, rather than subjecting it to a kind of technological exploitation by which data is mined through a process of extraction and refinement (D’Ignazio and Klein Reference D’Ignazio and Klein2020:45). They counter the dehumanization that so often accompanies the transformation of bodies into data by insisting upon the ways in which the critical digital humanities can attend more closely to people themselves. This is especially important when seeking to represent Black peoples’ embodiment and experiences while resisting what Jessica Marie Johnson calls the “devastating thingification of black women, children, and men” that is entangled with histories of quantification from the Atlantic slave trade onwards (Reference Johnson2018:65). Digital methods engage with imperatives to address African diasporic practices transnationally and transhistorically on a broad scale, without losing sight of the particularities of specific connections and discontinuities that characterize their transmission (Clarke Reference Clarke2004; McKittrick Reference McKittrick2006; Parham Reference Parham2019; Johnson Reference Johnson2019). As dance scholars, we are also interested in how our disciplinary approaches to embodiment might push the digital humanities toward a more expansive approach, in particular extending calls for greater inclusion of the body and embodiment as part of a critical orientation to data (D’Ignazio and Klein Reference D’Ignazio and Klein2020; Losh and Wernimont Reference Losh and Wernimont2018).
Although dance history has established precedents for curating data as part of its analytic practices, from timelines to appendices of works even without recourse to digital methods (see Bench and Elswit Reference Bench and Elswit2020b), approaches from the digital humanities and other data‐driven analytic frames were not designed with dance in mind. Yet, by attending to the bodies in the data, digital methods can evidence and elaborate bodily experience, or even, as Takiyah Nur Amin argues, make visible Black intellectual genealogies (2020). The methodology we call “visceral data analysis” focuses on data drawn from and reflective of embodiment. The language of the “visceral” is most familiar in the digital humanities from Kelly Dobson’s use of “data visceralization” to describe visualization strategies that resist the priority of vision in favor of “designing and building apparatuses that render data and information palpable and experiential and real” (Reference Dobson2012). Following Rebecca Schneider’s “visceral cultural analysis” (Reference Schneider1997:17), our approach to archival research draws out the visceral experiences that underpin and haunt such data to begin with. This methodology—in which bodies are articulated as experiential, in which practices of embodiment arrange knowledge, in which bodies stand as repositories of memory, in which they are recognized as in process, and in which physicality produces relationality—serves dance history while modeling ways to retain the materiality of the body in a manner that is also relevant to interdisciplinary digital scholarship.Footnote 9
The Company as Dynamic Movement Community
The company referred to as Katherine Dunham, Her Dancers, Singers, and Musicians was an unstable entity. While key performers such as Vanoye Aikens, Lucille Ellis, and Lenwood Morris provided a sense of coherence to the organization over time, who was on the payroll changed on a monthly and even weekly basis in relation to available work. Although some surviving performer contracts in Dunham’s archives indicate start dates alongside minimum durations of service, paid work within those dates was far more flexible. For example, the full company might play a concert venue in one city, then half of the company would be laid off while Dunham played a nightclub gig with the other half, and then the full cohort of performers would later reconvene for a concert performance in another country. Therefore, what we ordinarily call “the company” appears in Dunham’s archives as a dynamic movement community with shifting membership. In addition to Dunham’s continuous movement between contexts, including concert venues and cabarets,Footnote 10 her core movement technique fused a range of theatrical concert and social dance forms from around the world, at the same time as performers from various international locations joined and left Dunham’s employment. The boundaries between Dunham’s “dancers,” “drummers,” and “singers” were often fluid, with performers changing roles, and all were vital to the company as a movement community in a manner that aligns with African diasporic practices.
US American theatre‐dance history tends to periodize performers’ employment in two phases: early‐ to mid‐20th‐century dancers working primarily for a single choreographer with a dominant and unique technique, and a late‐20th‐century aesthetic requiring dancers to both meld multiple techniques within a single project and to move with versatility among projects and choreographers (Foster Reference Foster and Desmond1997). While the exceptional artist‐led dance company has become a key unit for narrating such histories, this further disguises the ways in which dance artists regularly crossed the artificial boundaries of genre in the mid‐century.Footnote 11 This also sits within a longer conversation of how dancers‐for‐hire have always navigated multiple genres within their own bodies, and intersects with how dance historians have largely disavowed the financial realities of crafting a life in dance, among other ways by distancing commercial work and material circumstances from the core of dance’s artistic history (Elswit Reference Elswit2018; Hamera Reference Hamera2017; Wilbur Reference Wilbur2021).Footnote 12 Looking to the dynamic movement community of Dunham’s performers therefore allows us to trace a more realistic picture of artistic work in mid‐century US American theatre dance, and the ways this, in turn, is reflected in the development and transmission of an aesthetic. With no consistent source of public or private funding, and often without the support of a dependable impresario, Dunham constantly maneuvered to string together short‐term engagements, touring for years on end rather than cyclically like other contemporaneous dance companies of equal status (see Bench and Elswit Reference Bench and Elswit2020a). Dunham picked up international performers as the group traveled around the world, which then shaped the group’s embodied knowledge of culturally specific rhythms and gestures. The company that traveled around the world with Dunham was thus a porous entity that worked across multiple contexts, tethered together by the system of training that Dunham developed and disseminated, as well as by the affective continuity through which performers understood their relationship to the group and to diaspora more broadly.
We built the Check‐In dataset to track the flow of individual performers coming and going over time at a granular scale, in place of more conventional measures such as years, seasons, or tours. From this, we can discern who among the almost 200 performers were in the studio and theatre together over the 14 years from 1947 through 1960. Our check‐ins come from a range of formal and informal documents, from programs, payroll logs, accommodation lists, and travel visa requests; and from first name references in letters, preliminary casting notes, and even orders for new shoes.Footnote 13 We visualize this dataset of shifting performer presence as a flow diagram in figure 1 to reflect the contours of this community, the nature of employment within it, and ultimately the potential lines of transmission for dance‐based knowledge that moved through it. We have already elaborated how we date programs through processes of inference and deduction to reconcile itinerary, repertory, and personnel check‐ins, which in turn also provide us with further data. However, the porosity of the company means that there is a greater level of ambiguity in the Check‐In dataset than in our Everyday Itinerary, with dates sometimes approximated in order to achieve chronology.Footnote 14 We further delineate the boundaries of the community that this dataset represents by tracing only onstage performers—dancers, drummers, and singers—because other personnel do not appear consistently enough in the archives to be accurately accounted for. This means our dataset omits many of Dunham’s vital and longstanding relationships, such as with business manager Dale Wasserman, secretary Margery Scott, or music directors Vadico Gogliano and Leslie Harnley.Footnote 15
Performer Check‐Ins, 1947–60 (189 performers). Performers present over longer durations stand out in the flow diagram because each individual line is shaded by the first time the performer is checked in, graduated from dark to light. Explore interactively online at https://visualizations.dunhamsdata.org/1947-60personnelflow/. Data: Harmony Bench and Kate Elswit. Visualization: Antonio Jiménez‐Mavillard. (Courtesy Dunham’s Data)
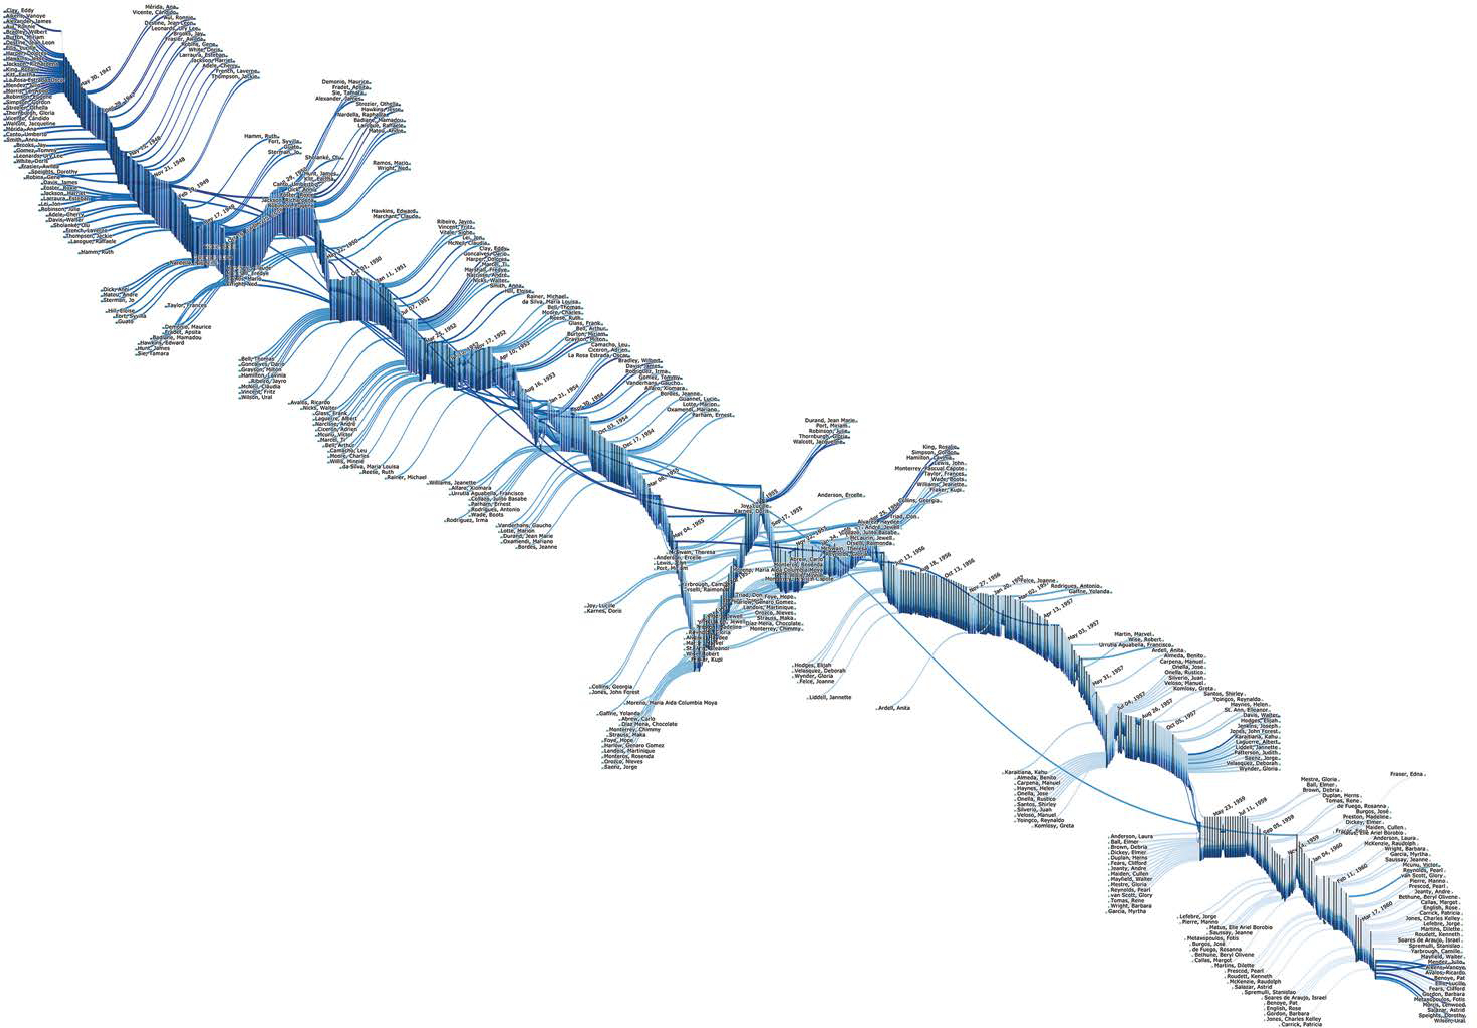
The Check‐In dataset draws attention to the flow of the company‐as‐community; with each entry dancers, drummers, and singers brought something to contribute and with each departure performers carried Dunham’s influence into the broader dance world. As personnel turned over, Dunham regularly invited previous performers to return because of their specific expertise with the body of work. There were occasions when former performers stepped in at the last minute, such as the moment in which Clessia Williams (aka Boots Wade) was involved in a car accident on the way to a Los Angeles theatre, and Julie Robinson, a former company member who lived nearby, was called in to substitute for her in four numbers, beginning with that night’s show (see Dunham Company 1955c, 4 April). Even the flow of individuals functions relationally. For example, drummer Julio Mendez first worked for Dunham between the late 1940s and 1951, his brother Mariano Oxamendi worked with the company during 1954, and then Mendez returned from 1956 to 1960. Such flows were also shaped by particular threshold events, including Dunham’s Broadway run in 1950, which functioned as an extended audition for a substantial number of new performers, some of whom stayed on or later returned to tour with the company. Likewise, studying and teaching at the Dunham School in New York served as a feeder into and exit from the company, as well as a bridge between an audition or one‐off engagement and a longer‐term contract.
While select performers appear consistently throughout the duration of our 14‐year dataset, many others appear for only short periods—sometimes a single check‐in as a local guest appearance — and for 64% of performers the span of time from their first to last check‐in is less than a year. Yet the check‐ins for almost 17% of Dunham’s people span more than four years. Gaps in employment for performers who spent some time away can usually be measured in weeks or months, although some lasted over five years. We base this on 534 check‐ins over the 14 years, averaging just over three check‐ins per month. However, because programs are among our data sources but are used less often outside of concert venues, the Check‐In dataset does not capture the frequency with which Dunham resized the company to accommodate shifts between concert venues and the alternate venues in which Dunham regularly worked, such as nightclubs, casinos, and dinner cabarets. In a 1955 letter, Dunham claimed to have pioneered “a whole new approach in night clubs” (Dunham Reference Dunham1955), and our Everyday Itinerary shows that this kind of work accounted for roughly a quarter of the company’s performances between 1947 and 1960. Although select hotel casinos had large stages, nightclubs were generally smaller, and so the number of dancers was reduced.Footnote 16 While Dunham’s concert shows tended to engage around 30 performers, a 1947 article describing an appearance in Las Vegas noted that the movement of the 14 performers was hampered by the size of the space (Walters Reference Walters1947:4). At the same time as such alternate venues were necessary for solvency, they always served as fillers in Dunham’s pursuit of concert performance opportunities, and she noted in retrospect that this reduction in cast was a balancing act: “There was a certain amount of re‐shuffling of the company for nightclub appearances, but I dared not reduce it too much in size,” presumably out of concern for both morale and not being able to collect the larger group back together again (Berenson and Dunham c. Reference Berenson and Dunham1980:238). Although it is beyond the scope of our Check‐In dataset, such venues also might bring additional performers in for an evening, for example in casinos and nightclubs, where her group was generally one of many acts that made up a show. There were also occasions when contracts stipulated that Dunham must incorporate a venue’s regular performers into her own numbers. For example, according to production notes for the Sahara Nightclub in 1955, Dunham had to use a “[kick]line of local girls” and chose to put them into Afrique du Nord as well as the multiple finales (Dunham Company 1955c, 20 February).Footnote 17
Scholars of African diasporic dance have argued for the importance of thinking in terms of community, from representational forms that include the recurrent but renegotiated dramaturgy of “the village‐on‐the‐stage,” to the risks inherent in the circulation of Black social dance forms via media beyond “the circle” or tight community of insider transmission (Edwards Reference Edwards2019; DeFrantz Reference DeFrantz, Nielsen and Ybarra2012). Writing about the imperatives that such understandings pose for scholars, Jasmine Elizabeth Johnson notes:
To study black performance communities within an academic space that devalues the significance of the embodied as efficacious knowledge production must negotiate how to put down in text performances which move through the world generally disinvested in a hierarchy of expressive forms.
(2012:72)The Check‐In dataset and visualization in figure 1 make differently visible the embodied knowledge flowing into, within, and out of a performance community, in a manner that builds on arguments from dance studies more broadly regarding how embodied knowledge moves between and among bodies. Judith Hamera argues in Dancing Communities for the need to attend to real and vicarious intimacies of dance technique as a kind of “relational infrastructure” that creates and sustains community through “the accumulation of small exchanges” (Reference Hamera2007:59). As Hamera summarizes, “Dance technique offers community protocols for reading the body; techniques for fashioning subjectivity and solidarity; and an archive, inserting all of these into an accessible, repeatable history” (Reference Hamera2007:138). Such archives draw on cognitive and corporeal as well as emotional and relational labors in order to contain and organize the residue of dance (139). In other words, at the same time as bodies carry and transform movement, the migration of gesture also circulates affective properties that transform those subjects through whose bodies they pass, both as individuals and in concert with one another, in a manner that builds commonality and allows for difference (see also Noland and Ness Reference Noland and Ness2008).
The interactive version of figure 1 visually develops our argument regarding the formation of such a community through the continuities and changes that are contained within but exceed a single moment of shared time and space. In the interactive version, users can highlight the trajectory of an individual performer, or they can highlight a particular check‐in to view the trajectories of every performer who was present at that moment. There are some performers whose trajectories stretch back past the beginning of our dataset in 1947 and some whose trajectories continue beyond the end of our dataset when the company disbands for a time in 1960. It is also possible to highlight multiple performers at one time, for example to simultaneously view the trajectories of everyone who ever appeared in a given piece of repertory. This is not to suggest that every performer who was copresent had a meaningful connection; however, through their colleagues they could have encountered knowledge that preceded them, and passed on knowledge that carried forward from that moment.Footnote 18 From this perspective it is not only Dunham herself who holds such a community together—although her force of will was critical to the company’s capacity to continue—but rather the performers’ many nested and entangled relationships that facilitated embodied exchanges, both individual and collective.
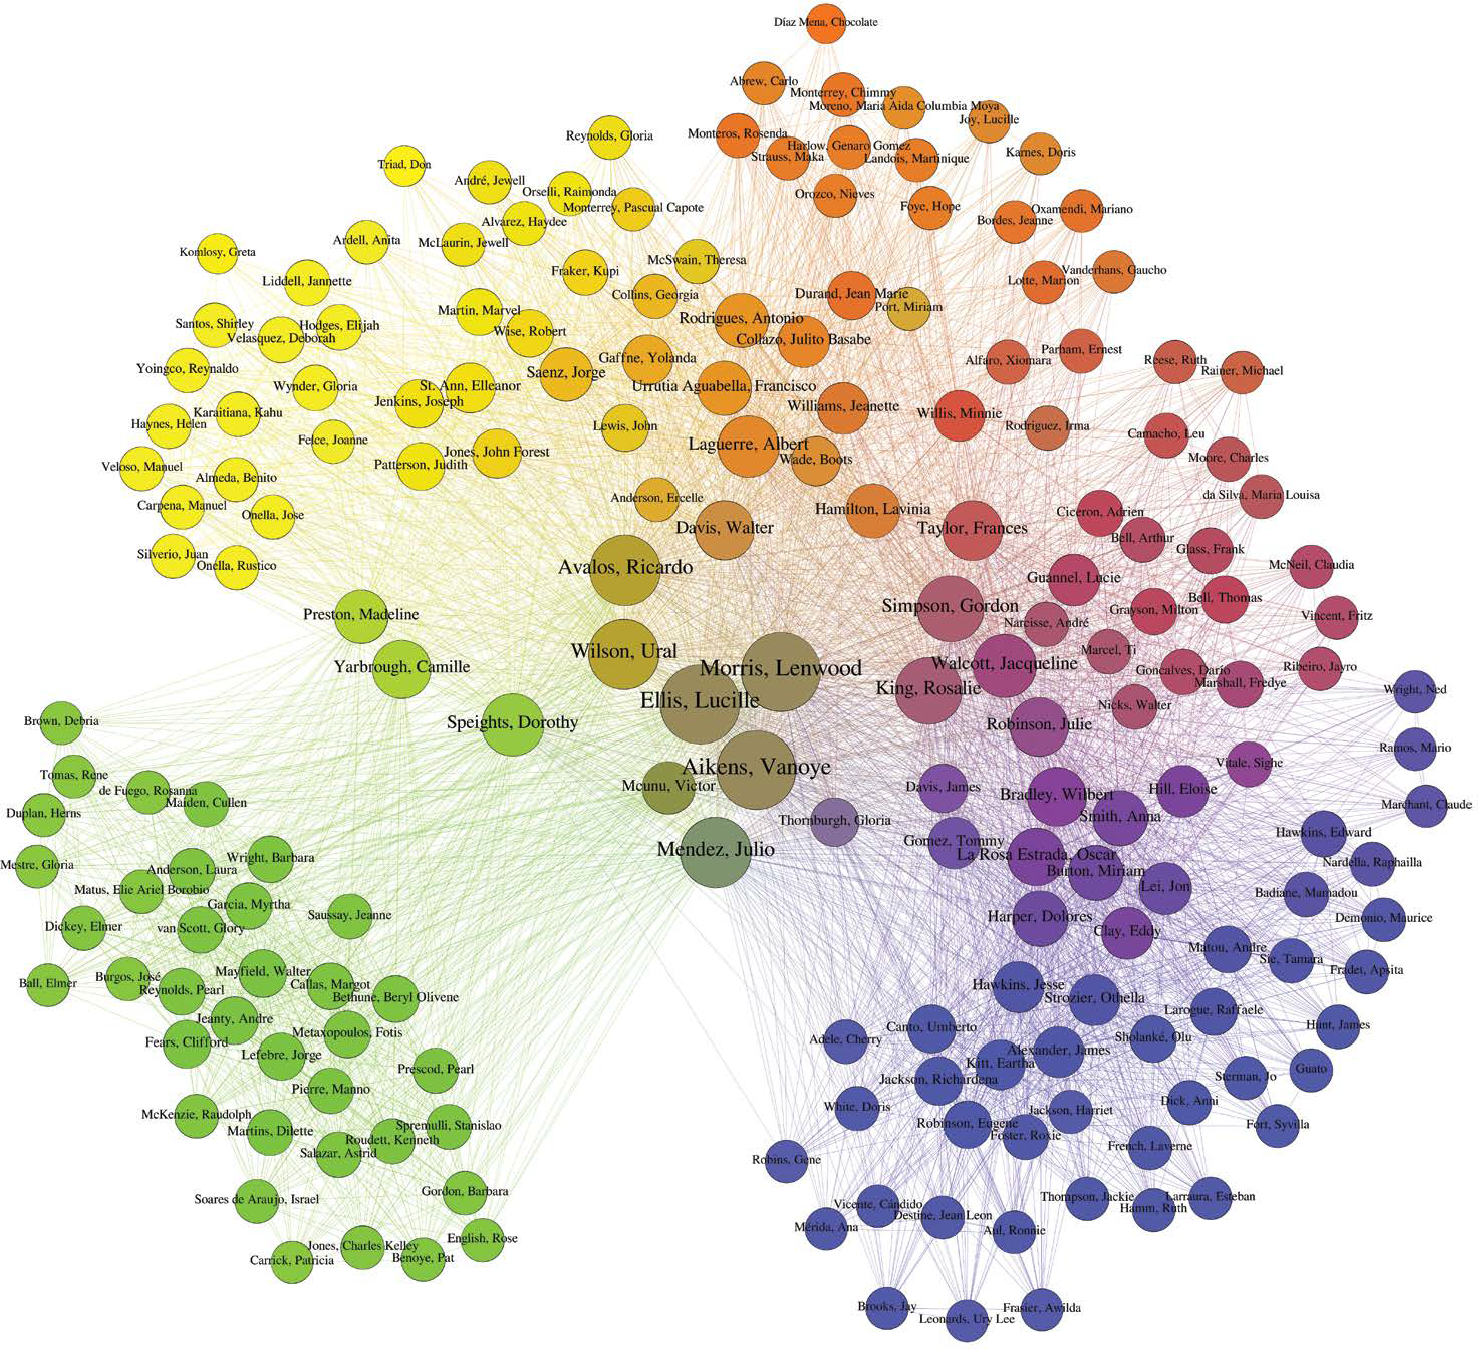
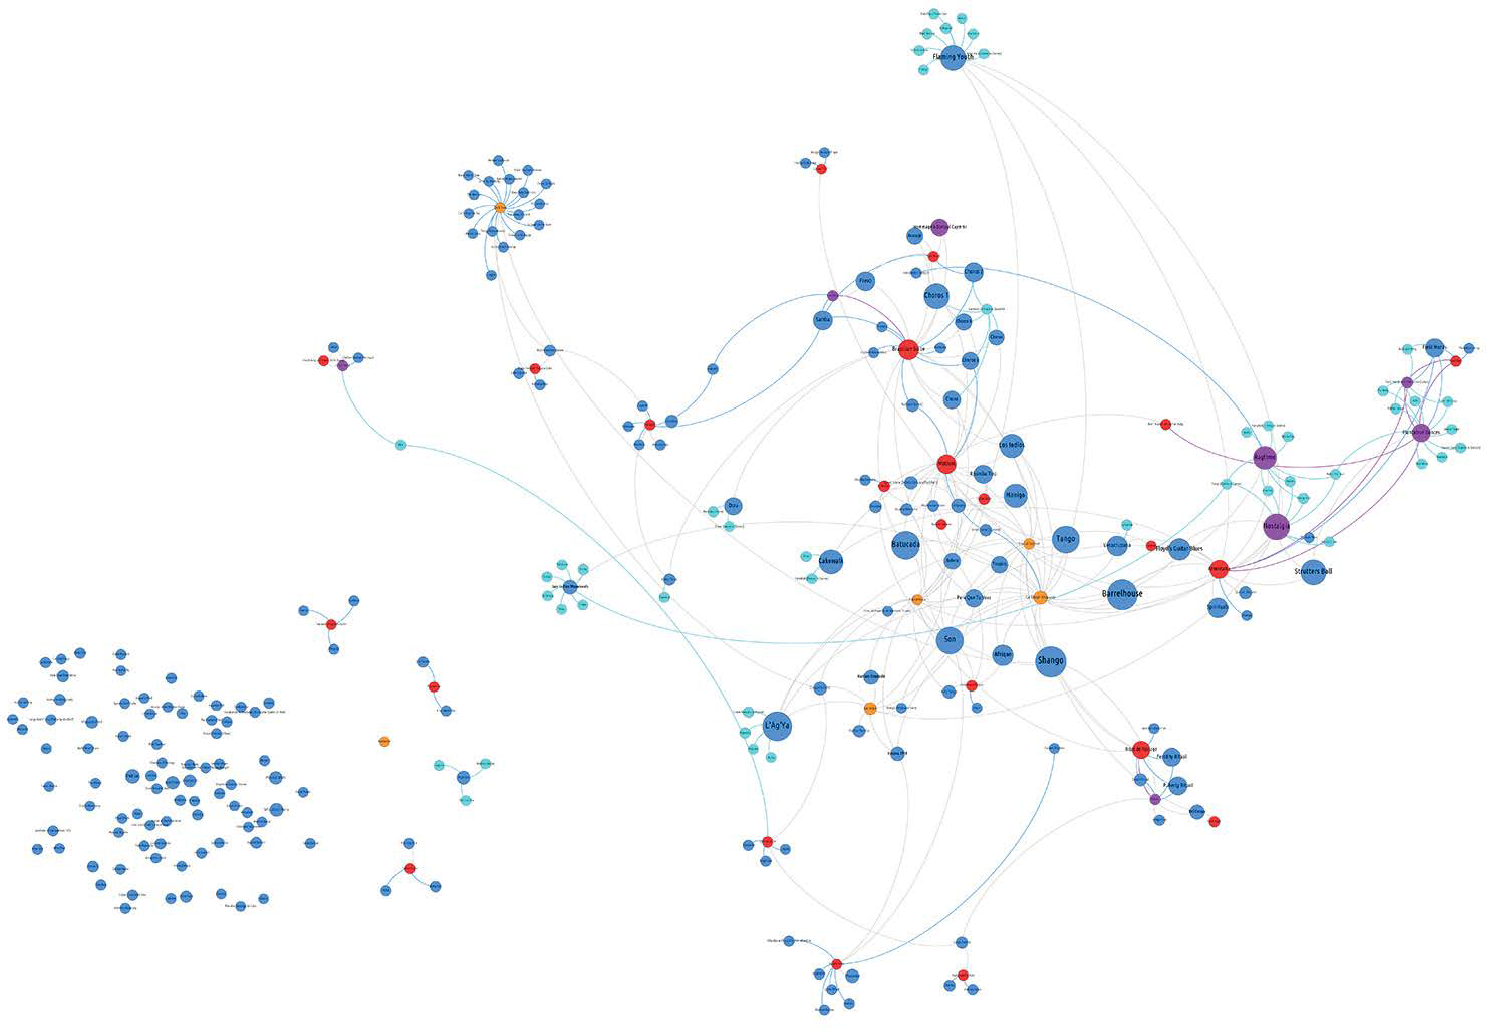
As an alternate approach to exploring these speculative lines of transmission, we also ran what is called a community detection algorithm on the Check‐In dataset. While we have been discussing the constitution of movement communities from the perspective of dance, community detection is a computational method used to discover groupings within complex networks based on the density of their connections—in our case, the performers who shared the most check‐ins between 1947 and 1960 (see Kadushin Reference Kadushin2012:108–34). Four groups emerged from this analysis, shown in figure 2. Each group is assigned a distinct color (blue, red, yellow, or green), and the coloring of each performer node reflects the degree of belonging to each group. Performers with a high degree of belonging to a single group will appear more distinctly in that specific color, whereas color mixtures indicate the performer belongs to multiple groups. While the algorithmically determined communities generally cohere around temporal relationships and thus indicate “generations” of the company, certain individuals stand out in a manner that also reflects back on the coherence of this community. It is not surprising to see familiar names such as Vanoye Aikens, Ricardo Avalos, Lucille Ellis, Lenwood Morris, and Ural Wilson as some of the most mixed colors in the center of the network; these group members were critical to facilitating the process of body‐to‐body transmission that held the group together. However, there are also other individuals who straddle multiple groups and thus form crucial cross‐generational links, including Camille Yarbrough, Julio Mendez, Victor Mcunu, Frances Taylor, Albert Laguerre, Walter Davis, and Lavinia Hamilton. At the same time, it is important to note that being part of multiple communities or generations of Dunham’s company is just one of many ways to think about continuity; for example, certain figures such as Glory Van Scott and Julie Robinson, who have emerged as central to preserving the Dunham legacy, are less visible from this perspective. Likewise, this doesn’t include anyone beyond the company, whereas Joanna Dee Das points out that today, “In the absence of regularly performed choreography, Dunham’s legacy more noticeably lives on through the Dunham Technique” (Reference Dee Das2017:199; see also Sutherland Reference Sutherland2019). This is why we talk about potential lines of transmission for embodied knowledge; by tracing which performers shared the stage together across different periods of time, we call attention to just some of the many possibilities of exchange that may have been enacted within this dynamic movement community.
Performer Cohorts, 1947–60. Performer nodes are sized by their number of check‐ins, and colored by the degree of belonging to various cohorts. The timeline moves counterclockwise from the blue in the lower right to the green in the lower left. Data: Harmony Bench and Kate Elswit. Visualization: Antonio Jiménez‐ Mavillard. (Courtesy Dunham’s Data)
Diasporic Movement in Motion
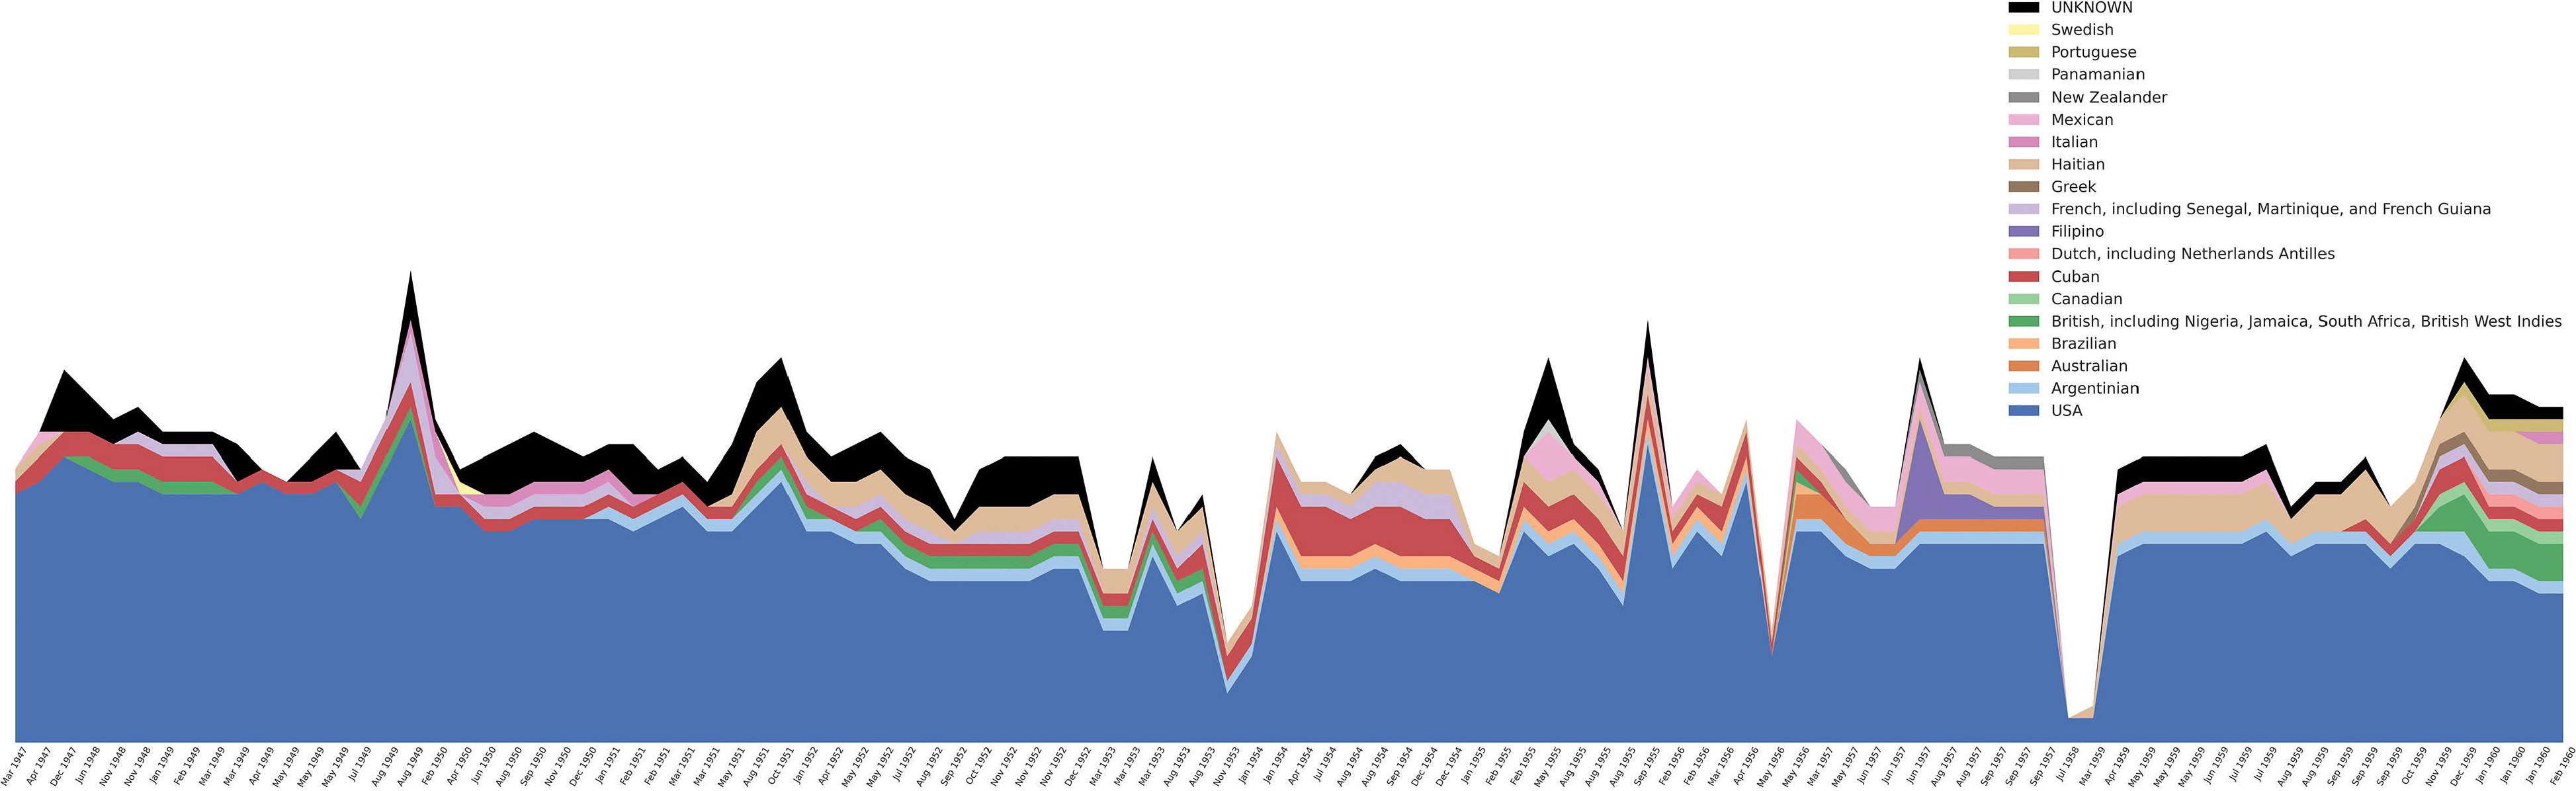
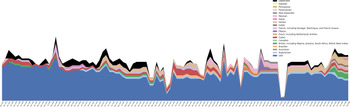
Dunham’s decades of travel and the performers who toured with her contribute to the imperative to shift diaspora away from specific anchor sites such as Africa or the US, toward a broader approach to the ways in which “journeying black women” in the first half of the 20th century participated as critical subjects in what Jayna Brown calls “the articulation between remote and local realms” (Reference Brown2008:10, 283). Although Dunham had previously traveled widely on her own, including for her anthropological research in the 1930s, 1947 marks the moment when her company began touring internationally, starting with Mexico and then Europe in 1948. The period on which our previous research focused, 1950 to 1953, represented an expansion of Dunham’s geographical coverage to include countries throughout South America, as well as North Africa. Touring throughout Oceania and East Asia followed in 1956/57 and, following a period of convalescence in Japan after a serious injury, Dunham resumed international touring in 1959 before the company again disbanded while in Europe in 1960. Visualizing the makeup of Dunham’s performers by passport nationality over 1947–1960, as shown in figure 3, it is conspicuous that as her international travel increased, so too did the multinational makeup of her company. Almost all company members were US citizens in 1947 when she first started to tour internationally. By 1960, at least 17 nationalities were represented within the group, and most of the performers who joined were connected to countries through which the company had recently toured.
Company Makeup by Performer Passport Nationality over Time, 1947–60. Because citizenship and nationality are complex identities, this stacked area graph is sorted by the passports under which performers traveled. When international tours began, most performers traveled under US passports, but by 1960, the representation was international. Data: Harmony Bench and Kate Elswit. Visualization: Antonio Jiménez‐Mavillard. (Courtesy Dunham’s Data)
In addition to transmitting knowledge within the movement community, dancers, drummers, and singers also brought rhythms and gestures from outside into the group, which contributed to maintaining and developing Dunham’s choreography. This account of Dunham’s diasporic aesthetics is entangled with her work as an early pioneer of participant‐observation and the lecture‐demonstration in anthropology, which had implications for her choreographic representation of cultural practices (Chin Reference Chin2014; Osumare Reference Osumare, Clark and Johnson2005, Reference Osumare2010). Yet Dunham scholars have always understood how Dunham’s diasporic imagination played a part in bringing the contributions of Black dance modernism into focus for dance studies.Footnote 19 Following Clark’s “memory of difference,” Halifu Osumare argues that the Dunham Technique facilitated a means for performers to participate in this process of transmission and transformation: “Each body interpreted the choreography, while accessing his/her own embodied knowledge emerging from their part of the Black Atlantic” (2020). We further this account of creativity by tracing how Dunham cultivated and drew on the diasporic practices that circulated through her performers; looking in this way extends discussions regarding the choreographic representation of diaspora to the ways in which diaspora moved through the bodies of Dunham’s performers.
The underpinning data for figure 3’s visualization of performer passports comes by joining the Check‐In dataset with a Performer Attributes dataset that we created to keep track of detailed information about each individual, including alternate names (stage names, nicknames, and married names), as well as their affiliations to nations and geographic locations. Such data offers loose proxies for the connections a performer might hold to parts of the world, including embodied knowledge that they brought into the movement community. However, every datapoint adds questions of how to categorize individuals with regard to shifting geopolitical landscapes. In particular, grappling with how colonial subjects circulated through the cosmopolitan hubs of imperial powers has been challenging. For example, Lucie Guannel carried a French passport and joined in Paris but came from Martinique, and Astrid Salazar came from the Dutch Caribbean island of Curaçao, carrying a Dutch passport, and went to Rotterdam after she left the company.Footnote 20 Even as we mark both passport nationality and birthplace, therefore, we do so toward an account of diaspora that decenters national boundaries, following Brown’s argument that “bodies of music and performance transcend boundaries” at the same time as “they also stay tethered to specific performance sites, particular bodies in physical contact” (2008:283).
In figure 4, we bring together the Everyday Itinerary, Check‐In, and Personnel Attribute datasets in order to evidence how consistently Dunham picked up performers while touring, and thus how the complex dynamics of place unfold and are reconfigured over time in relation to the company’s travel. During our 14‐year period, 64 performers joined Dunham’s company, carrying 17 different non‐US passports that represented 25 countries. Of those, over two‐thirds joined during or soon after Dunham had spent time in the country for which they held a passport.Footnote 21 Certain of these examples are known anecdotally, such as Ricardo Avalos, an Argentinian performer who became one of the central nodes of the community network (see fig. 2). Avalos first joined around the end of an extended run in Buenos Aires in late 1950 and is marked present in most check‐ins up through the end of our dataset in 1960, a decade later. Other examples may be less familiar, including Jannette Liddell, an Australian dancer who was first contracted as a temporary performer for a local run as part of an effort to expand the cast “in order to make the stage appear more luxurious as well as for publicity purposes” (Scott Reference Scott1956), but who subsequently stayed on for a year and a half, which took her beyond Oceania and into East Asia.
Select Performer First Check‐Ins, by Country and Passport Nationality, 1947–60. This table shows only countries through which Dunham traveled (orange bars), and for which performers holding that passport join the company (blue dots). Data: Harmony Bench and Kate Elswit. Visualization: Antonio Jiménez‐Mavillard. (Courtesy Dunham’s Data)
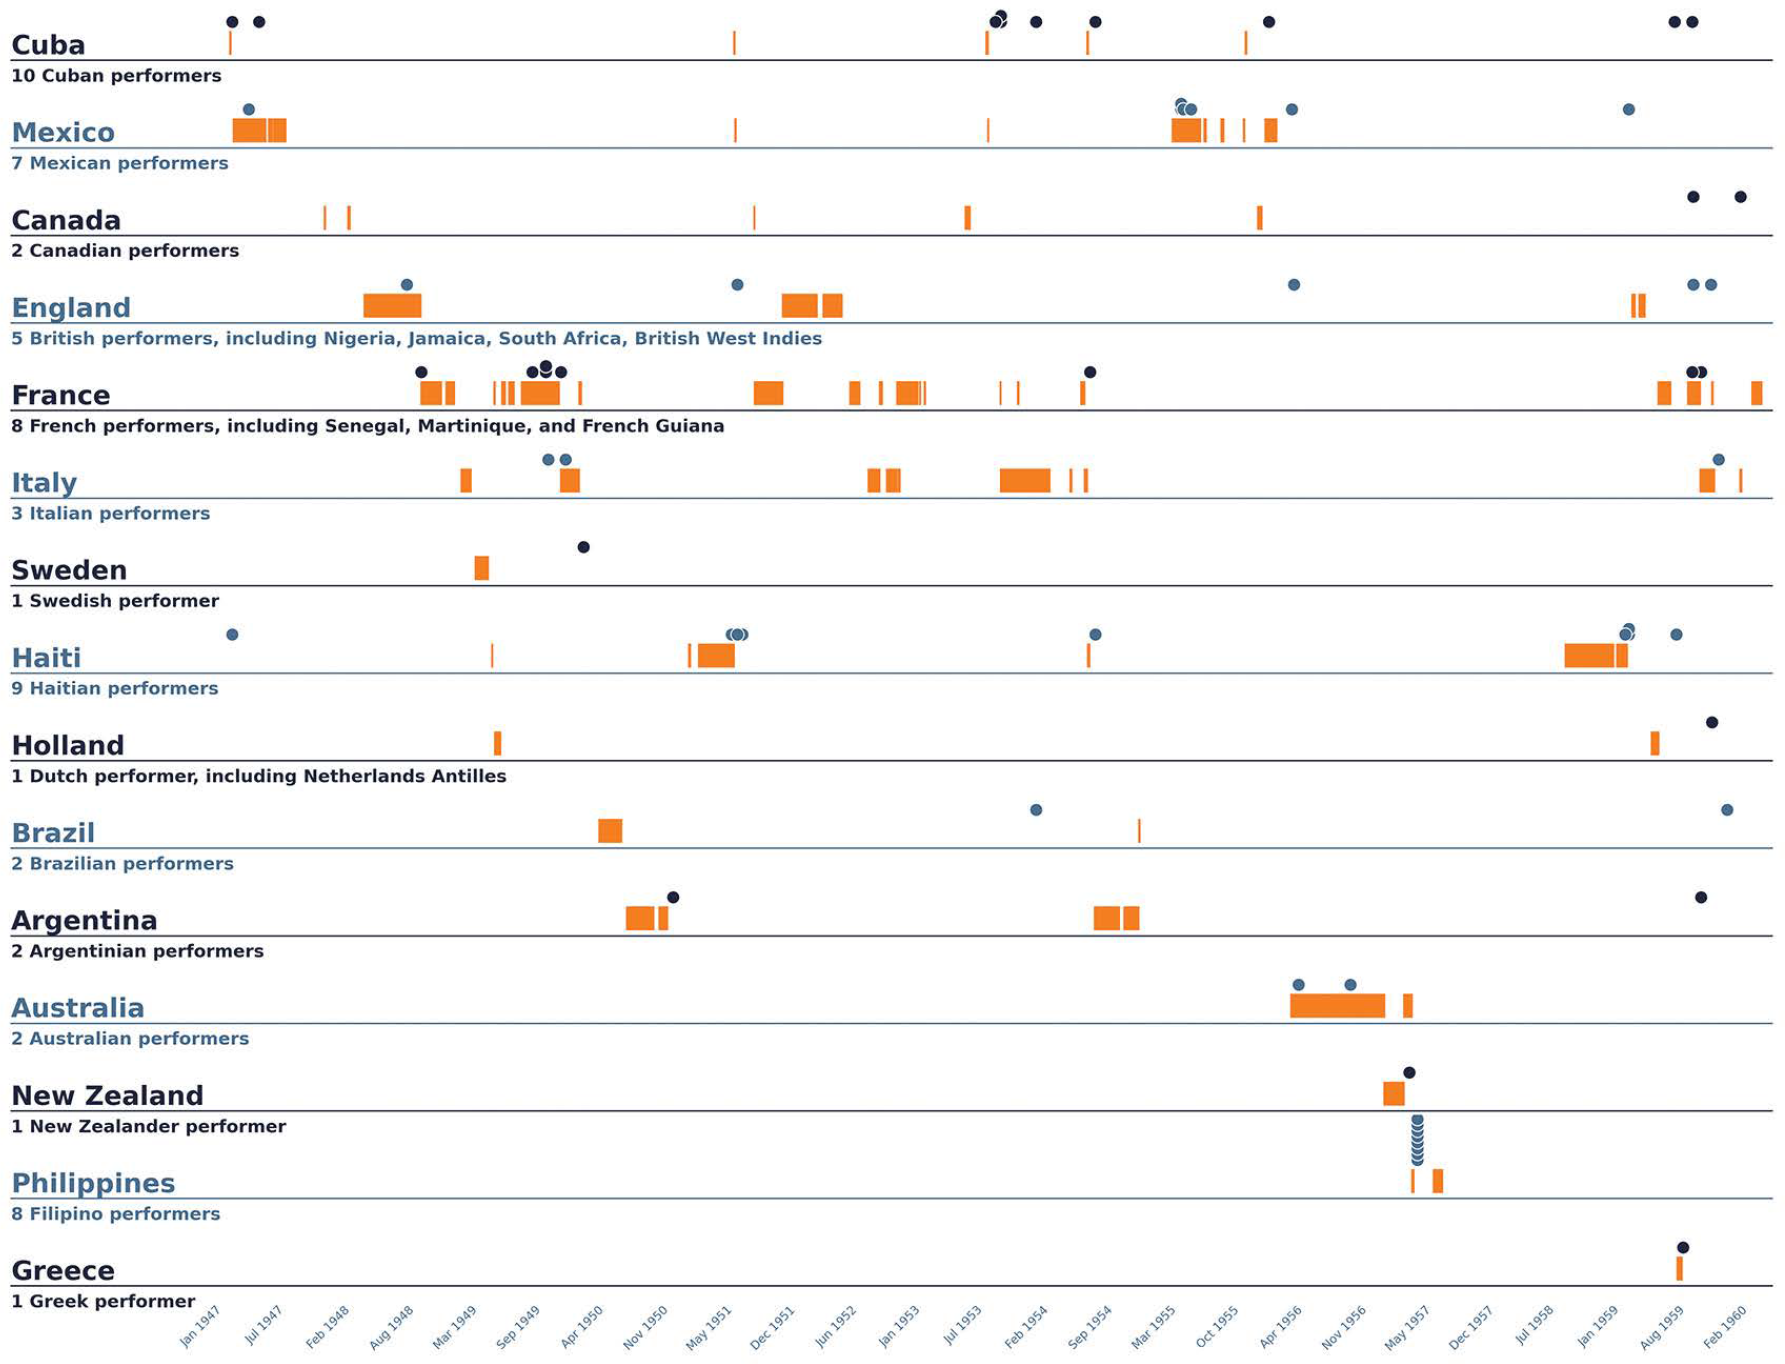
The connection of these performers to various places served Dunham’s project of staging a wide range of cultures through dance. Dunham made explicit the importance of performers to this overall aim when she wrote on their behalf for visa applications to enter or reenter the US. In one 1956 example, she began by explaining the context as a whole, before delving into the specialties of individual performers: “over the years it has been of utmost importance that foreign components be maintained with the company in order to keep the atmosphere of authenticity of the work which we are presenting.” In the descriptions of performers that follow, she described Avalos as “our sole contact with Argentine folklore”; the connection with Francisco Urrutia Aguabella as the result of a specific trip to Cuba to find drummers with the help of anthropologist Fernando Ortiz; Albert Laguerre from Haiti as “our chief drum authority in primitive drumming”; and Antonio Rodrigues as “an accomplished dancer of special Afro‐Brazilian Macumba rhythms […] and at present being our only Brazilian element is extremely important.” She sometimes also explained performers’ value in terms of their versatility with respect to “the requirements of the diversity of our own techniques,” for example, describing Jorge Saenz as an expert in both Mexican forms and ballet (Dunham Reference Dunham1956). Clearly the success of these visa applications was contingent on Dunham demonstrating her inability to find appropriate personnel within the US, and so Dunham necessarily emphasized the uniqueness of each performer. However, it is telling that she turned not only to the authenticity of representation onstage, but invoked the specific practices that performers brought into the rehearsal studio based on their backgrounds. This was not limited to performers from outside the US. Just as many of Dunham’s drummers and dancers from Haiti, Cuba, Argentina, Brazil, and elsewhere may have brought with them personal knowledge of the rhythms used for pieces like Shango and Macumba, American dancers would likely have come with familiarity of some of the social dances in numbers such as Ragtime and Flaming Youth. Through rehearsal these practices migrated between performers and from the studio to the stage, challenging dance history to account for not only Dunham’s creativity, but also as Priya Srinivasan has argued, “the possibility that the kinesthetic interaction of multiple laboring bodies creates new dance forms” (2012:72).
Such collections of particular national representations were always part of a broader transnational imaginary that circulated through the company in multiple ways. At the same time as performers were called upon as local informants, Dunham also invited all of her company members to join her in becoming what Clark calls “an anthropological band of beings” as the company traveled through the world (Reference Clark, Clark and Johnson2005b:378). Dunham’s archives are full of references to side trips taken where they encountered dance forms that were, as Clark points out, stylized even before Dunham put them onstage herself (Clark [1994] 2005a:327).Footnote 22 Although Dunham tended to center African diasporic practices, particularly those indexed to the Americas, the company’s transnational circulation brought them into contact with a broader range of rhythms, gestures, and referents. For example, documents from their time in New Zealand in 1957 include sign‐up sheets for Ma\ori dance performances at community centers in multiple cities (Dunham Company 1957a and 1957b). During this period, the company began to perform a number based on the Ma\ori haka, which was later combined with Baby San and Planting Rice, pieces that referenced later East and Southeast Asian travels, and together titled Eastern Suite.
Dunham’s sourcing of her choreographic inspiration from extant cultural practices was always a negotiation, as Aikens explained it: “face it, folk dancing is boring as such. But to keep the flavor, to keep the basic and add a little theatre to that without disrupting it or making the basic more interesting, that is what she did” (in Clark Reference Clark, Clark and Johnson2005c:286; see also Dunham [1941] 2005). In addition to learning cultural dance practices with which they would not have been personally familiar prior to joining the company, performers were also called upon to represent imagined rituals of mythical peoples, such as in Rites de Passage. The globally expanded version of what Dee Das calls Dunham’s “imaginary landscape of the African diaspora” had been passing through the company’s repertory for a long time (Reference Dee Das2017:1); Dunham’s first Melanesian‐referencing dance was Rara Tonga, which premiered two decades before she toured Oceania. Even when travel did precede the creation of repertory ostensibly representing place, the relationship between performers’ experiences and what appeared onstage was liberally narrativized for theatrical purposes. In 1951, the scripted patter introducing a Las Vegas nightclub number suggested that “The Frevo from north Brazil was Jackie’s [Jacqueline Walcott’s] favorite dance, so the whole Dunham company had to learn it,” but two weeks later in Reno an almost verbatim version of the story replaced Walcott with Robinson, who had also been on that tour (Dunham Company 1951, 15 and 30 August).
Thus far we have focused on the ways in which diasporic practices moved into and were developed and transmitted through the porous and dynamic movement community of Dunham’s company as it traveled through the world. However, it is important to acknowledge the ripple effects the group had as it traveled—for example, the ways in which the presence of Dunham and her company catalyzed local dance knowledge. Amanda Reid writes about the development of Jamaican dance in relation to Dunham (2020:40–89). When performers left the company and established or joined schools and other performing companies in Sweden, Argentina, Australia, and so many other places, they shared the practices they acquired from travel, from other company members, and from Dunham’s repertory itself. Dunham’s archives reference early examples of this global dispersion concurrent with the touring we have been describing, showing how the world Dunham’s company navigated on tour was populated by former dancers.Footnote 23 While this proliferation sometimes limited Dunham’s own touring options, such transmission beyond Dunham’s company has been critical to her global legacy. For example, Scandinavia tends not to feature prominently in histories of Dunham but Osumare recounts experiencing residual influences of Dunham Technique in Stockholm in 1970 (2018:71).Footnote 24 Building similar Everyday Itinerary, Performer Check‐In, and Repertory datasets for every Dunham performer and their own students, dancers, and collaborators would further expand an account of circulation through and beyond this community, toward what Thomas F. DeFrantz and Anita Gonzalez describe as the continual and relational interplay of diaspora (Reference DeFrantz, Gonzalez, DeFrantz and Gonzalez2014:11). In the next section, we add Dunham’s repertory as another layer for analyzing the incorporation and dissemination of embodied knowledge.
Reconfiguring Repertory and Repertoire
Choreographies that stayed in Dunham’s company repertory long‐term functioned as a kind of shared memory that connected performers who may not have shared time and space within the company. For example, although Veracruzana is rarely discussed in Dunham scholarship,Footnote 25 it was regularly performed from 1948 until the early 1960s. Because it featured a relatively large cast of 15, a substantial proportion of Dunham’s dancers, drummers, and singers performed in this work at some point. Archival images of Veracruzana lend the impression that it was a rather opulent concert piece, with its large hammock and other props, but it was first performed at a Ciro’s nightclub in Hollywood, California, and was one of many pieces in Dunham’s repertory that regularly moved between concert venues and nightclubs. Choreographed after the company’s first tour to Mexico in 1947, Veracruzana not only references a geographical location and set of cultural practices, but its subsequent performance while touring around the world also circulated those rhythms and gestures to other places. Using the interactive version of the flow diagram of Dunham’s personnel, we can highlight the 56 individuals whom we have identified as appearing in Veracruzana to see how a single work creates a chain of body‐to‐body knowledge across generations of performers (see fig. 1).
Focusing on how Dunham represented her repertory through programs to mid‐century audiences further allows us to imagine Dunham’s choreographer‐led company as a decentralized community of practice in which Dunham, while prominent, is not the only connector. Looking at performers’ level of connectedness to each other within a network formed by their shared repertory, a piece’s cast size and its relative frequency of performance emerge as particularly important factors.Footnote 26 Dunham generally appeared in approximately half of the numbers on a given program; however, she tended to be a featured soloist or in small duets and trios, skipping some of the large group works and the musical interludes, as well as the works that featured only men. As a result, her connections are slightly weaker across the entire ensemble than certain performers who appear in more numbers with larger cast sizes during the 1947–1960 period. In our preliminary research, Ural Wilson emerges as the performer most highly connected over that time through repertory, followed by Lucille Ellis and Lenwood Morris. Clearly, there are many other offstage means of connecting performers within a broader account of company relationships—from friendships to formal roles such as rehearsal director and understudy—that help tell the story of bodily transmission. However, analyzing how programs connect performers to each other offers insight into the inner workings of a movement community, making performers’ shared histories as well as their contributions and labor more visible.
The fields of dance and performance studies have developed a variety of arguments over the past three decades that take seriously the capacity of performance to act “as a system of learning, storing, and transmitting knowledge,” from surrogation to the performative commons (Taylor Reference Taylor2003:16; see also Roach Reference Roach1996 and Dillon Reference Dillon2014). This critical concept, sometimes summarized as “repertoire” after Taylor’s The Archive and the Repertoire, is embedded in the idea that cultural practices are held in bodily archives, which not only store and transmit knowledge, but also allow for change.Footnote 27 Rebecca Schneider further highlights the role of embodied practices when she argues that the temporal logic of a performance archive is fundamentally different from a text‐based one. For Schneider, performance’s repetition itself is a site of residue for historical memory, forming “a network of body‐to‐body transmission of affect and enactment—evidence, across generations, of impact” (Reference Schneider2011:100; see also Schneider Reference Schneider2001). Dance scholars have employed different language to address similar phenomena. Randy Martin has described the dancing body as a multitemporal “moveable archaeology” that links together what is “durable and ephemeral” (Reference Martin, Klein and Noeth2011:33). Looking to the place of the researcher’s own embodied knowledge as well, Srinivasan discusses the “bodily archive” of physical histories “captured in muscle memory […], bodily labor and kinesthetic contact” (2012:17) that dance scholars tap into when encountering and fleshing out archival evidence of bodies and practices from the past, by engaging with physical practices shared across generations. These scholars all theorize bodily knowledge as entangled with community, whether among those who are copresent or separated in space and time.
Within the dance field, there has been substantial discussion of how individual pieces of repertory may change over time, however, such arguments tend to rely on the organizing fiction of the choreographic work as relatively discrete, even as they push the limits of stability (see Elswit Reference Elswit2008; Franko Reference Franko2017). For example, in his analysis of Alvin Ailey’s long‐performed work Revelations, DeFrantz has used the concept of “generational ‘versioning’” to describe the incremental but noticeable shifts to the work across generations of performers (Reference DeFrantz2004:83). There are also, as Hamera notes regarding community, the ways that relational protocols of technique always exceed individual works (Reference Hamera2007). Between repertoire and repertory, then, is the possibility to recognize the specificity of particular practices in transmitting embodied knowledge, while simultaneously letting go of ontological stability. Tracy C. Davis contends that understandings of repertoire within theatre history need to be expanded from transmission among performers, to encompass tacit knowledge mutually shared among artists and their contemporary audiences, which enables “reiteration, revision, citation and incorporation” within a “circulating recombinative discourse of intelligibility” (Reference Davis2009:7). Drawing these scholars together, we might understand repertory as it appears in Dunham’s programs to be a malleable set of choreographed sequences transmitted across generations of performers that evidences and perpetuates embodied knowledge, changes in response to new performers coming into certain roles, and actively cultivates shared literacies among performers themselves as well as between performers and their audiences.
Opening up the definition of “repertory” beyond the choreographic “work” better reflects Dunham’s practices of constantly reimagining and repackaging her choreography. To build the Repertory dataset, we draw primarily from performance programs and other archival materials, in tandem with the datasets previously discussed, to catalogue the various titles and descriptions by which a piece might be known; the years in which it was performed; and all of the singers, dancers, and drummers who are ever listed as having performed in it. We also document program notes that indicate real or imagined connections between different pieces and different places or historical time periods. For example, the program notes for several works, including Bahiana, Dora, Batucada, Choros variations 1–5, and Los Indios indicate that inspiration came from various sites in Brazil, whether the 1810s, 1920s, or Dunham’s present. Other pieces have multiple affiliations or evolve over eras of performance. First performed in 1955, Mambo, also called Mambo Havana, exemplifies such subtle yet significant shifts as it draws multiple locations into proximity in what is ultimately called a “comment on tourist life in Havana”: “In the dance halls of Harlem, the ‘Boogie Woogie Bop’ met the ‘Rhumba’ from Havana and ‘Mambo’ was born. This offspring of rhythms returned to Cuba and from there traveled all over the world” (Dunham Company [1957c]). In 1959, Spanish Harlem appears with nearly identical program notes regarding the “mixing of Cuban and North American tempo” but is located specifically in the “Spanish section of Harlem,” and launches globally from there.Footnote 28 We have also documented other aspects of each work such as composers of the music, the varying cast sizes, and whether the pieces were performed in concert venues, nightclubs, or both. Another particularly complex element in the datasets are alternate titles, since many pieces appeared under variations or complete renamings over time, as well as in translation.Footnote 29
While the various titles alone contribute a degree of instability to the datasets, the process of building out the Repertory dataset drew our attention to the various degrees to which Dunham repurposed existing choreography, resulting in pieces performed under different titles but sharing substantial components. Dunham’s revue‐style approach meant that numbers constantly rotated in and out on a monthly, weekly, and even nightly basis. Her programs were designed to appeal to many types of audiences and incorporated a host of movement vocabularies, from theatricalized versions of “traditional” dances and cultural impressions, to jazz‐ and ballet‐inflected modern dance, to social and popular dances. As DeFrantz has observed of Alvin Ailey’s repertory, but could equally apply to Dunham’s, a “diverse repertory amplifies African American strategies of versatility as survival” (Reference DeFrantz2004:659–60). We therefore need a broader way to think about how pieces circulated gestures and rhythms, in turn producing further connections within the movement community. Such choreographic reworking simultaneously foregrounds the flexibility of repertory as something that holds people together in intergenerational relation even as it shifts and changes.
To track the fluid relationships among the almost 300 named choreographic entities that we have identified so far in Dunham’s programs, we began to categorize them in a nested hierarchy of four tiers.Footnote 30 What we call “dances in dances” are the smallest components; they primarily draw from African American vernacular and social dance forms and were often identified in programs and show patter for audiences as building blocks of pieces. Then there are “pieces,” which may stand alone and/or be absorbed into other, larger entities, which we call “containers.” “Container” is a loose category of varying size and structural integrity that describes multiple pieces drawn together under a shared name. For example, the container Brazilian Suite usually holds 4 to 5 pieces, but across the 63 archival programs listing Brazilian Suite in our dataset, we have identified 20 different pieces it included at one time or another. Finally, there are named “shows,” which collect these disparate elements into a named evening‐length event such as Caribbean Rhapsody or Bal Negre.Footnote 31 Although we include known repertory from the 1930s to ’60s, to date our data on the nested hierarchies is far more nuanced and detailed regarding the numbers that were actively performed in the 14 years from 1947–60.
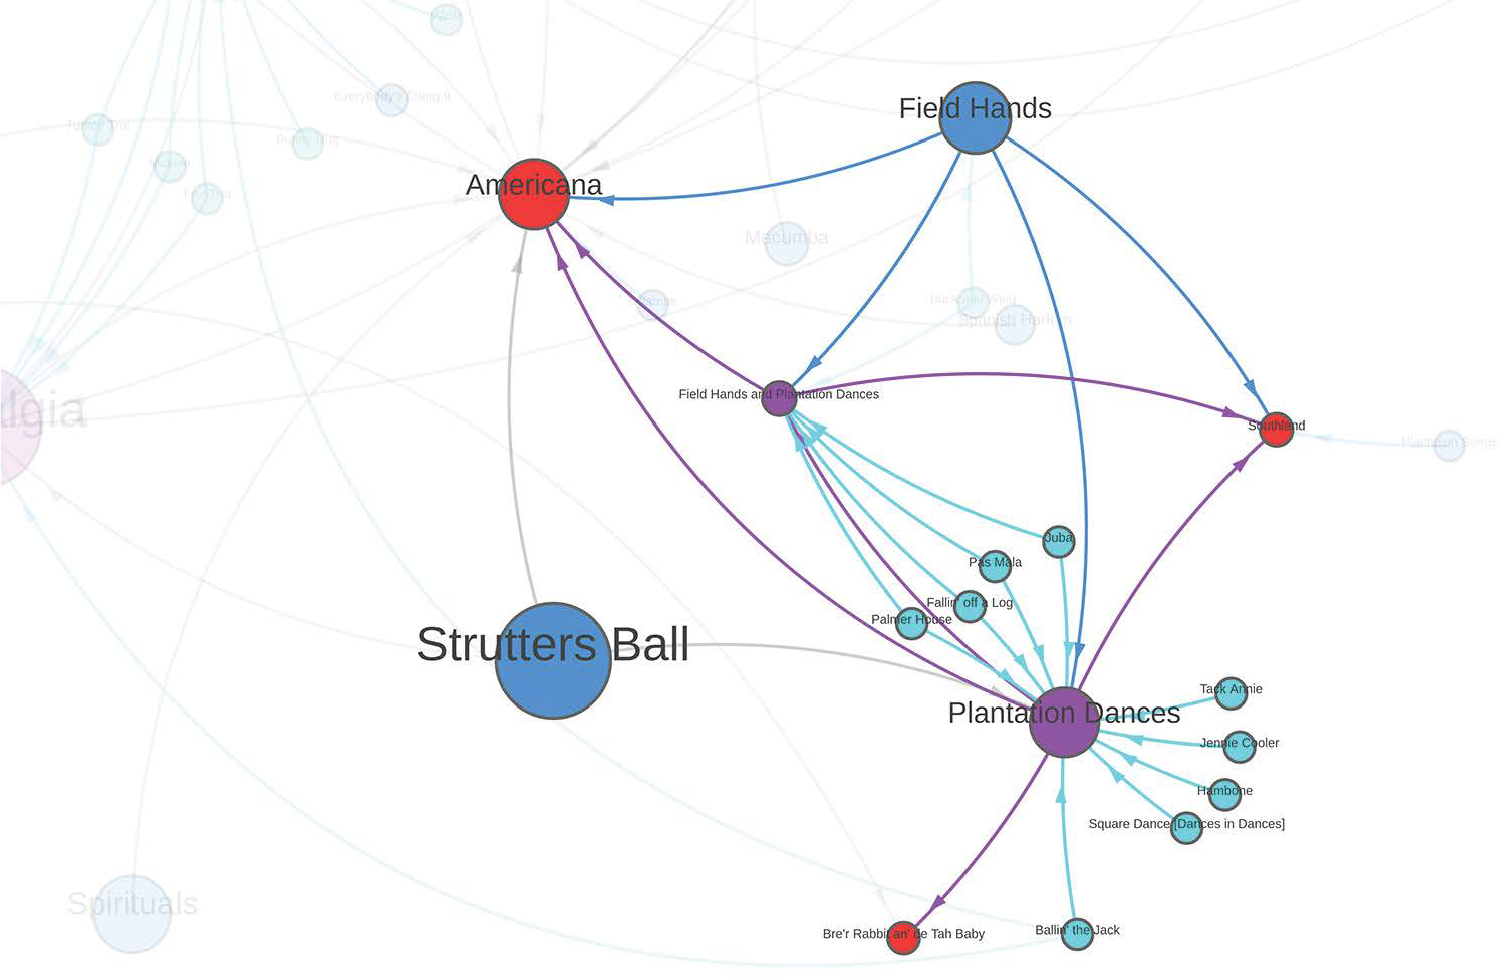
We graph the complex interconnections among these three categories in figure 5.Footnote 32 In Dunham’s programs, approximately 40% of what dance scholars would typically categorize as a piece appear as part of two or more different containers, while Son is an outlier in being included in five. The detail in figure 6 focuses on a piece called Plantation Dances. Plantation Dances comprises a variety of dances‐in‐dances, including Hambone and Fallin’ Off a Log, many of which were originally part of Bre’r Rabbit an’ de Tah Baby from 1938, and then presented subsequently as part of the smaller container Plantation and Minstrel Dances from the Ballet Bre’r Rabbit. The designation of this piece as Plantation Dances emerges in retrospect, with the building blocks having been reimagined as the opening of the infamous work Southland in December of 1950, but not listed as distinct until later, when Plantation Dances appears in programs with the annotation “from the ballet Southland.” Subsequently, Plantation Dances appears as part of the container Field Hands and Plantation Dances, or most often as one of the many pieces integrated into a highly variable container called Americana. Footnote 33 In other words, Plantation Dances connects repertory from as early as 1938 through the 1950s. Whether performers appeared in versions from Bre’r Rabbit, Southland, or Americana, they shared in it as common embodied knowledge within a community of movement.
Dunham Company Repertory: Shows, Containers, Pieces, and Dances‐in‐Dances. Static version. “Shows”–orange; “containers”–red; “pieces”–blue; works that are both “pieces” and “containers” at various times–purple; “dances in dances”–aqua. Edges are colored when pieces always belong to containers, and gray when pieces stand on their own. The cluster in the lower left represents pieces that are not currently connected, whether because they are nightclub‐only works, or because the bulk of their performances pre‐date 1947. Explore interactively online at https://visualizations.dunhamsdata.org/repertory/ . Data: Harmony Bench, Kate Elswit, and Tia‐Monique Uzor. Visualization: Antonio Jiménez‐Mavillard. (Courtesy Dunham’s Data)
Detail of Plantation Dances from Dunham Company Repertory. Interactive version. Data: Harmony Bench, Kate Elswit, and Tia‐Monique Uzor. Visualization: Antonio Jiménez‐Mavillard. (Courtesy Dunham’s Data)
Conspicuously, Clark likewise chooses Southland to illustrate how Dunham repurposed her own choreography with a difference. According to Clark, Southland included the Apache dance from Windy City, the habanera from L’Ag’Ya, and the plantation and blues dances that appeared through multiple pieces of repertory ([1994] 2005a:336). Clark’s account of remixing is developed in terms of the dance literacies that Dunham built among her performers and audiences as she repurposed elements.Footnote 34 The Repertory dataset and the full figure 5 network graph offer complementary accounts of the systemic nature of such interconnections, making visible that extreme mutability is not anomalous, but rather that movement practices were remixed throughout Dunham’s choreography. The recycling of dance across new contexts undermines a stable understanding of what constitutes a work, in a manner that acknowledges gestural, rhythmic, and affective coherence, while also allowing for changes including duration, cast size, context, and content.
At the same time, as the example of Plantation Dances points to the slipperiness of pieces and containers, certain combinations of repertory cohered, even as they formed unstable and temporary wholes. An interesting limit case here is the container Rituals, presented as part of Dunham’s Reference Dunham1955 run at the Broadway Theatre, which combined the two most‐performed pieces from Rites de Passage, Fertility Ritual and Puberty Ritual, with two other pieces: Shango and Congo Fran. The 1955 program note for Rituals employs the same text that usually accompanied Rites de Passage.Footnote 35 Rites de Passage, which Beckford (Reference Beckford1979) dates to 1941, grew from two to four pieces over time, although the later additions of Women’s Mysteries and Death Ritual were performed much less frequently than Fertility Ritual and Puberty Ritual. All four were rarely performed together, but some combination thereof remained consistent over decades. Therefore, even though the later Broadway remix Rituals repurposed materials from the semiflexible Rites, the two were distinct such that conjoining them—despite the two overlapping pieces and shared description—would expand the container of Rituals too far.Footnote 36
Focusing on repertory in this way complicates Dunham’s canon and, together with the data on personnel, also recenters the contributions of individual company members. Proportional representation in dance scholarship would suggest that Dunham’s works of greatest historical importance include L’Ag’Ya, Barrelhouse, Rites de Passage, and especially Southland, even though the latter was only performed a few times. However, there are ways to account for key works other than those most remarkable, including which had the most number of performers pass through, indicating a broadly shared and intergenerational reference point. Analyzing Dunham’s repertory from the perspective of company members with an emphasis on ensemble size would yield a very different canon, in which Veracruzana and Afrique would feature prominently. Another approach would be to look at which pieces were performed most frequently or the number of years they stayed in repertory. For example, L’Ag’Ya appears for 13 years of our 1947 to 1960 dataset, but so do Nostalgia and Son, with Batucada, Shango, and Nanigo just behind (12 years), followed by Rhumba Trio, Flaming Youth, Floyd’s Guitar Blues, Ragtime, Tropics, and Choros 1 (11 years), and so on.Footnote 37 Likewise, choreographic styles could become visible not in individual pieces, but in distinctive patterns of combination, such as which pieces appeared in the most containers, evidencing content being repeatedly reworked and therefore core to the company’s memory, perhaps even scaled from the popular gesture to the performed evening.
Because Dunham’s programs represent her repertory as so highly interconnected, within our main repertory network graph, most pieces are no more than three or four steps from one another, and all are connected within ten degrees. In this period, the Caribbean Rhapsody show is a particularly central bridge between various clusters within the repertory network (exhibiting what network analysis would call significant “betweenness centrality” as well as “closeness centrality” [Rodrigues Reference Rodrigues and Elbert2019]), which makes sense because we have documented 24 entities that are part of it at various times.Footnote 38 Among containers, Americana, Brazilian Suite, and Motivos similarly contain the most pieces (15–20). Or looking in reverse, between 1947 and 1960, 13 pieces belong to 3 to 5 containers, many of which also stand on their own.Footnote 39 Privileging such versatile interconnections and changing configurations over time directs scholarly attention differently, and there are even more avenues than have been pursued here, in particular given how such structural reworking of material has implications for understanding Dunham’s compositional and aesthetic choices. While the Repertory dataset begins from archival documents, namely what Dunham articulated in print as the building blocks of works, there is so much more to learn about the passage and transformation of dance‐based knowledge that might be traced through different datasets that begin from technique, from movement analysis, or from oral history.
Dance/Data
The organization of ideas, archives, and information shapes the types of questions that researchers can ask. Rawson and Muñoz highlight the difference between fitting data into existing models versus beginning from the data itself to build new structures for inquiry, and how such a process “freed us to attend to difference and detail, rather than attempting to clean it away” (Reference Rawson, Muñoz, Gold and Klein2019). Although useful for making 20th‐century dance history narratable, the “company,” the “tour,” and the “work” are organizing fictions that reduce complexity. In the example of Katherine Dunham, gathering data foregrounds the nuances of such fictions, highlighting dynamic processes of performer collaboration within the porous and dynamic movement community that traveled through the world in service of Dunham’s project of using the stage to represent a wide range of dance cultures. The data also show how repertory further circulated such diasporic knowledge through a complex network of interwoven gestures that exceeded performers’ own shared time and space. A critical mixed‐methods approach to data analysis and visualization complements archival research to make sense of the scale of information necessary to account for so many people, places, and pieces and the interconnections among them. In turn, such analysis can help to illuminate visceral histories of performance, giving us new tools to think systemically about foundational concepts such as bodily transmission, that are so well understood anecdotally within dance yet so difficult to make visible or understood beyond the field.
In 2010, Glen Worthey wrote a white paper for the Dance Heritage Coalition in which he posited: “I believe—public opinion to the contrary—that it is generally easier to teach a little bit of programming to an interested dance historian than to train a programmer in the subtleties and depths of dance history” (Reference Worthey2010:6). A decade later, we are still just starting to figure out what it might mean to take up this invitation. The field of dance has embraced digital approaches to the collection, dissemination, and even analysis of dance’s digitized traces, but the project of historical inquiry has been left behind. Visceral data analysis enables us to reframe questions about Dunham’s repertory, company membership, and touring; how might these or similar approaches extend to broader conversations surrounding mid‐century American theatre or the mobility of Black modernity? And what can dance history offer back to digital methods? Expanding Worthey’s proposition, we contend that it is not about programming alone, but about bringing dance historical questions into the discussions about data and lived experience that are occurring in the fields of spatial history, geohumanities, feminist science and technology studies, and other experimental arts and humanities, to develop new means of negotiating bodily complexity in a manner that neither positions embodiment as outside of knowability and intelligibility (Bench and Elswit forthcoming), nor overdetermines bodily possibility vis‐à‐vis systems of governance and digital surveillance. While we have much to learn from all of these fields, there is also so much that dance can do as an interlocutor, once we are better able to grapple with the questions and problems that make such work meaningful for performing arts research in the 21st century.Footnote 40


 Open access