
It is 30 years since Anthony Ryle gave the name cognitive analytic therapy (CAT) to the integrative and relational psychotherapy approach he had been developing since the 1960s. Since then, CAT has continued to grow in the UK and in a dozen or so countries overseas, most notably Finland, then Ireland, Spain, Italy, Australia and Greece. The Indian Association for Cognitive Analytic Therapy has recently been established in Bangalore. To celebrate CAT’s 30th birthday, it seemed timely to present an overview of the therapy for this journal and its readers. It was hard to decide what to include or discard in a relatively short article. We hope that what we have chosen will give readers something of a ‘gut feel’ for CAT from the perspective of therapist and patient, as well as knowledge of the research base and its clinical applications.
We have written this article in sections attributed to different co-authors so that the first-person voice of Tony Ryle can be heard in the first section, where he gives a personal account of CAT’s development and its theoretical and ethical roots.
Features and sources of CAT
By Anthony Ryle
The main features defining CAT (Box 1) emerged over time, many of them preceding any plan to develop a psychotherapy model. I will describe their sources (Box 2) in the approximate order in which they emerged, showing in italics ideas and practices that endured as part of the CAT model.
Features of CAT
-
• Designed for use in the public sector/National Health Service
-
• Applicable to a wide range of psychological disorders
-
• Delivered within predetermined time limits (16 or 24 sessions)
-
• Involves early joint descriptive reformulation of patients’ problems in terms of underlying processes in relational terms
-
• Extends patients’ capacity for self-reflection and change
Sources of CAT
-
• Derived from clinical work and research in general practice
-
• Contains the common therapeutic features identified in Persuasion and Healing (Reference FrankFrank 1975)
-
• Influenced by identifying the factors behind patients’ failure to revise dysfunctional behaviours (non-revision) and also by repertory grid research
-
• Involves a model of self and relationships influenced by object relations theories, Reference VygotskyVygotsky’s (1978) description of the social formation of individual self-processes, and observational studies of early infant–caretaker interactions
Early origins
I proposed CAT as a formal psychotherapy model in the mid-1980s. I had developed the defining features of practice and the core theoretical principles over the preceding three decades, during which I had worked largely on my own in general practice and in a university health service in England. I had not completed a formal training in psychiatry or psychotherapy and had therefore experienced neither the support nor the constraints of established theories, therapies or institutions. While many others have contributed new ideas and have pioneered new applications in the past 25 years, the core features of the CAT model can be understood as being derived from both my personal and social attitudes and from my clinical and research experience.
Therapeutic technique
In practice, CAT therapists make use of techniques which are shared with, and often derived from, other therapy models, in particular behavioural and cognitive models. The specific technical aspects of CAT are concerned with establishing a collaborative and mutually respecting working relationship with patients and with the descriptive reformulation of their problems, on the basis of which past and present problems, the impact of the therapy relationship and of specific therapeutic procedures will be understood. In essence, therapeutic ‘technique’ involves the continuing application of CAT theory.
Influence of general practice
The diagnosis of general practice patients consulting with physical and psychological symptoms involves careful listening, and this (and my curiosity) encouraged many patients to discuss emotional problems in ways which they found helpful. As my interest in psychological issues evolved, I responded more actively and my practice came to embody the common features described in Persuasion and Healing by Jerome Reference FrankFrank (1975), and I was influenced by behavioural and the emerging cognitive models. But I felt that treating many of the ‘problems in living’ which my patients brought to my door required more complex theories. The appeal of psychoanalysis lay in its claim to understand these broader existential issues, but it had many practical and theoretical inadequacies.
Developing practice relevant to the NHS
Epidemiological studies of general practice populations, including my own, demonstrated a high prevalence of largely untreated psychological problems. I was deeply committed to the egalitarian principles embodied in the National Health Service (NHS) and realised that a practicable psychotherapy approach would have to be time limited. In my attempt to make sense of psychoanalytic ideas I restated them in cognitive terms and eliminated assertions about unconscious processes. Having attempted to develop a common language with which to describe how therapists of different schools worked, I came to believe that integration at the level of theory was needed. Such a theory should be compatible with work outside the psychotherapy world, notably in developmental and social psychology.
Supervision
While practising I sought occasional supervision, but avoided formal training. At Sussex University, I received supervision of my clinical work from a psychoanalyst and, although I remained very dubious about the theory, I was helped by the understanding of the feelings between therapists and their patients (transference and counter-transference). I was also encouraged to take more account of the focus of object relations theorists on the internalisation of early infant–caretaker interactions, even though psychoanalysts showed little interest in observational studies and obscured the field by contrasting and rival assertions about unconscious, innate factors.
Developing a theory
My theoretical development was fuelled by two lines of research, one focusing on why the negative outcomes of dysfunctional thoughts and actions do not lead to their useful revision, the other using repertory grid techniques to investigate relationships and self-processes.
Outcome research – the focus on non-revision
In outcome research, I focused on trying to understand why people continued to think and act in ways that produced unwanted outcomes. A study of the case notes of completed therapies revealed three general patterns underlying patients’ failure to revise problem processes:
-
• traps, where underlying negative assumptions are reinforced by outcomes
-
• snags, where desired outcomes are avoided because they provoke, or are felt to provoke, forbidden or dangerous outcomes
-
• dilemmas, where possible modes are restricted to polarised alternatives.
Impact of research on practice
Therapists worked with patients to create descriptive reformulations of the presenting problems in these terms. These were recorded in writing and diagrams, collaboratively constructed with the patients’ participation. CAT aims to recognise and challenge the restrictions and distortions imposed by persistent dysfunctional intra- and interpersonal patterns. The psychotherapy file, which explains symptom monitoring, describes traps, snags and dilemmas and labels problematic states, helped patients to identify which descriptions particularly applied to them. These patterns became the focus of patients’ self-monitoring and supported therapists’ recognition and non-collusion with their manifestations in the therapy.
I later recognised that the processes accounting for the non-revision of dysfunctional processes were similar to those accounting for the stability of normal processes. This contributed to the first general theory: the procedural sequence model, discussed below.
Research using repertory grid techniques
People can describe their individual thoughts and acts, but not the repeated patterns of memory, assumptions, activity and avoidance characteristic of their relationships with others and their sense and management of their selves. In completing repertory grids, patients rate how far individual elements (objects, experiences, actions, people, relationships and so on) are described by a list of relevant constructs. Statistical analysis of the ratings can demonstrate the underlying patterns of judgement. This work suggested an alternative account of the phenomena described in object relations theories, without involving the acceptance of psychoanalytic beliefs. Parallels between self–parent relationships and self-management patterns empirically supported the formative role of early experience. Dyad grids, where self to other and other to self were rated, suggested that relationships rather than individuals were internalised and illustrated the concept of the reciprocal role.
The procedural sequence model
Psychotherapy models need to understand the nature of stability and change. Behavioural models of reinforcement and cognitive models of belief–behaviour links are incomplete and frequently cannot account for the success or failure of attempts to change human behaviour. The procedural sequence model of aim-directed action (Box 3) offers a more adequate indication of how change may be achieved or resisted. A procedural sequence describes the aim, context, memory, enactment, outcome and the confirmation or revision of the aim and sequence. In human relationships, the aim of each is to find or elicit the reciprocating response of the other. For example, someone with dependent needs will seek a caregiving other, whereas a domineering person will find a submissive other. Everyone will acquire an individual repertoire of reciprocal role procedures which determines and restricts how they interact with others.
The procedural sequence model of aim-directed action
-
• Describe the context and aim
-
• Consider capacity to pursue the aim and consequences of doing so
-
• Consider possible action plans
-
• Enact selected plan
-
• Review effectiveness of the plan
-
• Review consequences of the enactment
-
• Confirm or revise the aim and the underlying assumptions
Origins of the self
A person’s repertoire is derived from the interaction in infancy between their genetically determined temperament and the attitudes/actions of their caretakers and siblings. As well as shaping relationships with others, they are internalised as patterns of self-care, self-management and self-judgement, and may be manifest in internal dialogue. Clinical management and psychotherapy are supported by the reformulation of the presenting problems in the reformulation letter, based on this understanding of how the individual is socially formed and sustained. For the patient, the reformulation offers a non-judgemental basis for self-reflection. For the therapist, it allows the patient’s expectations and pressures to be recognised – and not colluded with.
Symptoms
Symptoms and symptom complexes such as eating disorder or obsessive–compulsive disorder (OCD) are seen to originate in the need to replace or avoid forbidden or feared reactions to unmanageable experiences. The role of many symptoms is illustrated by a story – I think a Buddhist one – of a drowning man who was saved when a raft drifted by. In recognition of his gratitude he strapped the raft to his back and carried it for the rest of his life. Many symptoms can be relieved by the recognition and modification of the avoided procedure.
Structural dissociation and the multiple self-states model
The model was further elaborated to make sense of abrupt switches observed in some patients between contrasting self-states (identified by their dominant reciprocal role procedures) that did not result from obvious external events. The reformulation for such people, who have usually experienced unmanageable levels of abuse, abandonment and neglect, requires identifying two or more separate systems. Figure 1 is such a diagram, describing structural dissociation between states characterised by idealisation and angry rejection. Structural dissociation is often unrecognised as patients (and clinical services) may avoid confusing state switches by establishing defensive reciprocal role procedures involving avoidance, compliance and emotional blankness, commonly associated with somatic and depressive symptoms.
Narcissistic personality disorder: a mapping showing two of the common self-states.

These understandings were summarised in the multiple self-states model (MSSM) of borderline personality disorder (Reference RyleRyle 1997). Structural dissociation can be reliably identified in a few minutes by the patient’s completion of the validated 8-item Personality Structure Questionnaire (PSQ) (Reference Pollock, Clarke and DorrianPollock 2001; Reference RyleRyle 2007; Reference Bedford, Davies and TibbiesBedford 2009). Scores on this can range from 8 to 40. Community samples have mean scores around 20, patients referred for psychological treatment have mean scores in the mid-20s and patients diagnosed with personality disorders score over 30. Intended as a screening device, the PSQ has surprisingly good psychometric qualities and is sensitive to therapeutic change. Where scores are high, the characteristics of the dissociated self-states need to be identified by detailed questioning and observation or through the use of the States Description Procedure (Reference Bennett, Pollock and RyleBennett 2005). This enables therapists to avoid colluding with negative states, to discuss alternative modes and to support integration.
Summary of the course of treatment
CAT is delivered in 16–24 sessions (usually of 1 h each), plus one or more follow-ups. The stages of individual CAT therapy are outlined in Box 4. The first two stages may be a basis for group or community treatment.
Stages of CAT in individual therapy
Stage 1 (session 1): Assess suitability
Therapist excludes active psychosis and gross substance misuse; outlines the nature and duration of treatment.
Stage 2 (sessions 1–4)
Therapist creates reformulation on the basis of history-taking, the evolving therapy relationship, use of the psychotherapy file and the Personality Structure Questionnaire. Patient and therapist jointly create a narrative reformulation letter and sequential diagrammatic reformulation; agree aims.
Stage 3 (session 5 onwards)
Patient uses diaries and self-monitoring to recognise identified problem procedures; works on the basis of the reformulation to understand developments in the therapeutic relationship and assimilate memories and feelings accessed as a result of the work; uses appropriate techniques taking account of the reformulation; maintains awareness of termination date.
Stage 4
Patient and therapist consider implications of ending and record these in goodbye letters; arrange follow-up(s).
Key skills for a CAT therapist
These are summarised in Box 5.
Some key skills of a CAT therapist
-
• Understand patient’s personality and problems in relation to the social relationships that formed and maintain them, including those occurring in the treatment context
-
• Work collaboratively with the patient on the reformulation of their problems
-
• Use and discuss the psychotherapy file and the Personality Structure Questionnaire
-
• Consider the impact of biological/genetic influences, of medical treatments and of specific psychotherapy techniques in relation to the patient’s social context and the nature and integration of the their repertoire of reciprocal role procedures
Concluding thoughts
The main sources of my early formation of the CAT model were my observing, describing and recording a wide range of common non-psychotic psychological disorders. In this I was guided by the curiosity and egalitarian political attitudes which influenced how I related to my general practice patients.
Theory-free description was extended by the use of repertory grid techniques, and the development of a general model depended on a critical incorporation of aspects of existing behavioural approaches and on my increasingly irritated failure to provoke thoughtful responses from psychoanalysts. In 1982 I wrote:
‘Psychoanalysis makes an attempt that is proper in range and ambition, but it has become trapped by theoretical confusion and restricted in its method by institutional pressures. Cognitive and behavioural approaches, on the other hand, offer effective therapies over a limited range on the basis of theories that attend to only segments of human experience’ (Reference RyleRyle 1982: p. 4).
The later development of CAT, supported by increasingly numerous and sophisticated colleagues, has involved the incorporation of the findings of observational studies of early development and by an increasing clinical and research basis.
The CAT evidence base
By Stephen Kellett & Rachel Calvert
When CAT was conceived as a modality, it was explicitly designed to be researchable. The subsequent evolution of CAT research has proven this aim to have been successful, with an evidence base that straddles both practice-based studies examining clinical effectiveness in routine care and controlled clinical efficacy trials of evidence-based practice (Reference Barkham and Mellor-ClarkBarkham 2003). The popularity of CAT in routine practice has meant that the evidence base for treatment features a greater proportion of practice-based studies. The aim of this section is to demonstrate the breadth of outcome research conducted regarding both the efficacy and effectiveness of CAT and to make a quantitative assessment of the effect size of treatment with CAT, using forest and funnel plot analyses. A forest plot is a graphical display that summarises and illustrates the relative strength of treatment effects across the multiple outcome studies conducted, whereas a funnel plot considers a range of potential biases: publication and/or methodological.
Treatment integrity
As the CAT approach is avowedly integrative and relational and works within strict time limits to enable patients to reflect on (and then change) their intra- and interpersonal patterns and roles, it inevitably demands a high degree of therapeutic skill. Treatment integrity or therapist competency in the CAT model can be assessed using the Competency in Cognitive Analytic Therapy (CCAT) measure (Reference Bennett and ParryBennett 2004). Sessional recordings of the conversation between therapist and patient are scored against the 10 CCAT domains (Box 6).
The 10 domains of the Competency in Cognitive Analytic Therapy (CCAT) measure
-
1 Phase-specific tasks (such as engagement skills in early CAT sessions)
-
2 Making theory–practice links
-
3 Use of CAT tools (such as narrative and diagrammatic reformulation)
-
4 Managing boundaries
-
5 Common factor skills (basic supportive good practice)
-
6 Creating a collaborative climate
-
7 Assimilation of warded-off or problematic states
-
8 Making links and hypotheses
-
9 Managing threats to the therapeutic alliance
-
10 Awareness and management of own reactions/feelings
Search terms and inclusion/exclusion criteria
A literature search of PsycINFO, Medline, CINAHL and the Cochrane Library (using the search term ‘cognitive analyticFootnote *’) identified 253 papers published between 1960 and 2013. Studies were selected on the basis of the following criteria:
-
• written in English
-
• individual or group CAT delivered
-
• psychometrically sound outcome measures used
-
• at least pre- and post-outcome scores available
-
• accepted for publication in a peer-reviewed journal
-
• independent data-sets reported.
In total, 26 studies met the inclusion criteria (Table 1). We grouped them according to diagnosis and analysed them according to methodology: randomised controlled trials (RCTs) of evidence-based practice; and practice-based studies in routine clinical care (practice-based evidence, PBE) (Reference Barkham and Mellor-ClarkBarkham 2003).
Disorder, outcome studies and methodologies in the cognitive analytic therapy outcome evidence base
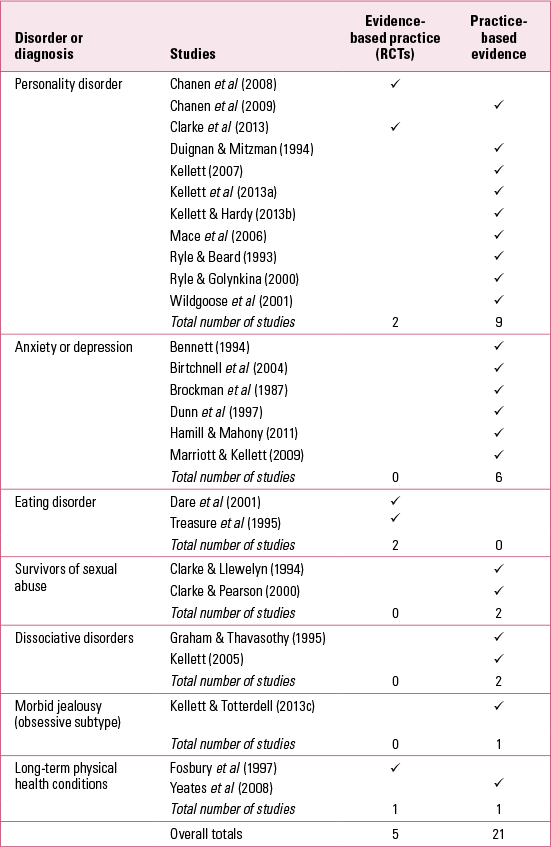
The CAT evidence base consists of 4 RCTs, in addition to 22 studies of effectiveness conducted in routine clinical practice using a variety of outcome methodologies. Table 1 shows that the majority of the published outcome studies (11 of 21, or 42%) were completed with patients with more severe difficulties (personality disorder).
Calculating outcomes and treatment integrity across studies
Outcome data from each study were converted to a common metric, Cohen’s d. To be included in calculations of the overall uncontrolled effect size, studies were required to have: (a) used psychometrically sound outcome measures at least pre- and post-CAT; and (b) reported means and standard deviations (s.d.) of outcomes at pre- and post-CAT and associated sample sizes. Eleven studies met these inclusion criteria, giving us twelve data-sets (one study, Marriott & Reference Marriott and KellettKellett (2009) contained two data-sets: 16- and 24-session CAT).
We calculated uncontrolled effect sizes by dividing the mean change score achieved pre/post-CAT by the mean pre-CAT standard deviation. Sample sizes then determined each study’s percentage contribution to the overall effect size (Reference Barkham, Gilbert and ConnellBarkham 2005; Reference Westbrook and KirkWestbrook 2005). For studies reporting multiple outcomes, the analysis used the Brief Symptom Inventory (BSI) (Reference DerogatisDerogatis 1993) or Symptom Checklist 90 – Revised (SCL-90-R) (Reference Derogatis, Richels and RockDerogatis 1976) as a common outcome metric. If a measure of global functioning was not reported, we selected the most widely used and validated measure. In terms of treatment integrity, the studies were scored as either containing a treatment fidelity check or not.
The effectiveness of CAT
The effect sizes for the 11 outcome studies (12 data-sets) ranged between 0.19 and 1.11 (s.d. = 0.26). Figure 2 shows a forest plot of the outcome study effect sizes and Fig. 3 an associated funnel plot.
Forest plot showing uncontrolled effect sizes for the CAT outcome studies. n, number of participants in the study; % weight, the weighting (based on sample size) of each study towards the overall effect size. The plot shows a measure of effect (i.e. an odds ratio, represented by a square) for each of the studies, with confidence intervals (CIs) represented by horizontal lines. The overall meta-analysed index of clinical effectiveness is represented by the vertical dashed line; the vertical solid line represents when there is no clinical effect. This meta-analysed index is also plotted as a diamond, the lateral points of which indicate CIs for this estimate. Should the horizontal CI line for a particular study meet the vertical solid line, it demonstrates that at a given level of confidence, the effect size does not differ from ‘no effect’. If the lateral points of the diamond overlap the vertical solid line, then the overall meta-analysed result also cannot be said to differ from ‘no effect’ at the given level of confidence. The heterogeneity chi-squared was non-significant (F = 4.24, d.f. = 11, P = 0.962), indicating that the studies were homogeneous. The variation in effect size attributable to heterogeneity I 2 = 0.00%, and the test of effect size = 0; z = 9.70, P < 0.001.
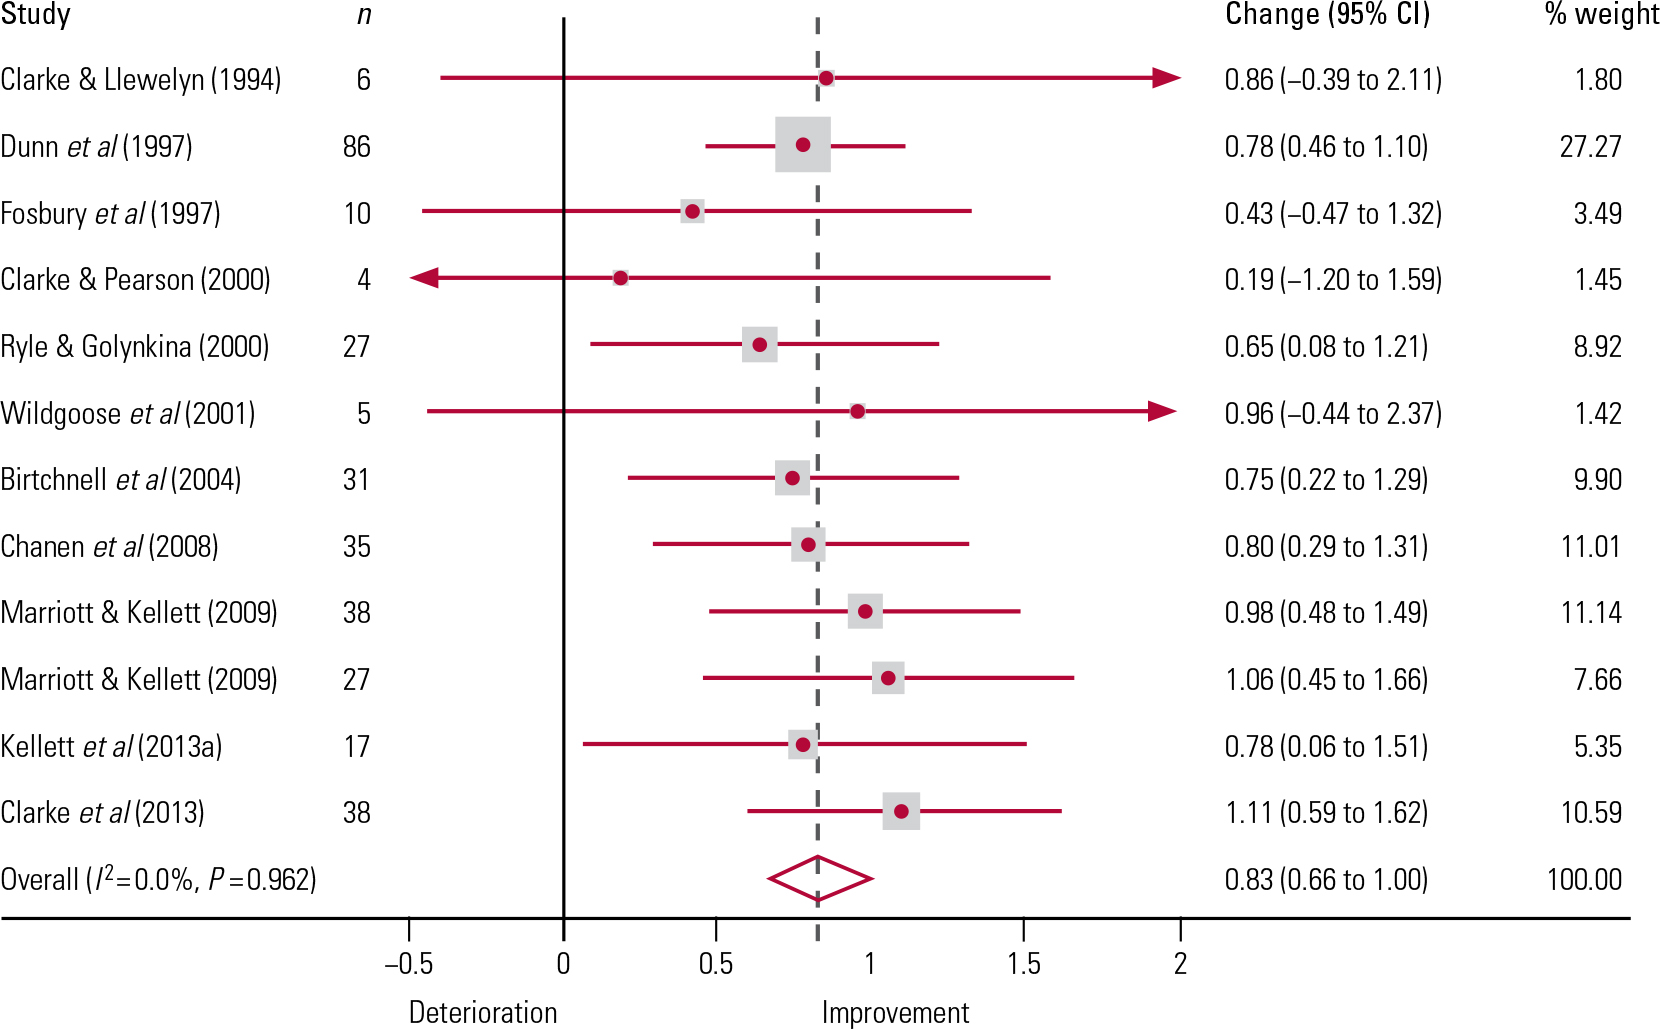
The forest plot
Although the confidence intervals (CIs) in four of the studies indicate detrimental effects (where the CIs extend to the left of the vertical solid line in Fig. 2), all four had small sample sizes, resulting in much broader confidence intervals (Reference Lueger and BarkhamLueger 2010).
The weighted mean CAT effect size d + = 0.83, with a 95% CI from 0.66 to 1.00 (k = 12, N = 324). According to Reference CohenCohen’s (1988) power primer, d + = 0.20 is a ‘small’ effect, d + = 0.50 is a ‘medium’ effect and d + = 0.80 is a ‘large’ effect. Thus, our analysis indicates that CAT for mental health problems has large effect on reducing psychiatric symptoms.
In terms of treatment integrity, 3 of the 12 studies contained treatment fidelity checks (Reference Chanen, Jackson and McCutcheonChanen 2008; Reference Clarke, Thomas and JamesClarke 2013; Reference Kellett, Bennett and RyleKellett 2013a). Reference Barkham and Mellor-ClarkBarkham & Mellor-Clark (2003) note that treatment fidelity checks are a typical feature of the high internal validity of RCTs and tend to be absent in evaluations of therapeutic effectiveness in routine practice. Both Reference Chanen, Jackson and McCutcheonChanen et al (2008) and Reference Clarke, Thomas and JamesClarke et al (2013) were indeed RCTs, but the Reference Kellett, Bennett and RyleKellett et al (2013a) study of the effectiveness of CAT for borderline personality disorder in routine practice was unusual in employing a treatment fidelity check.
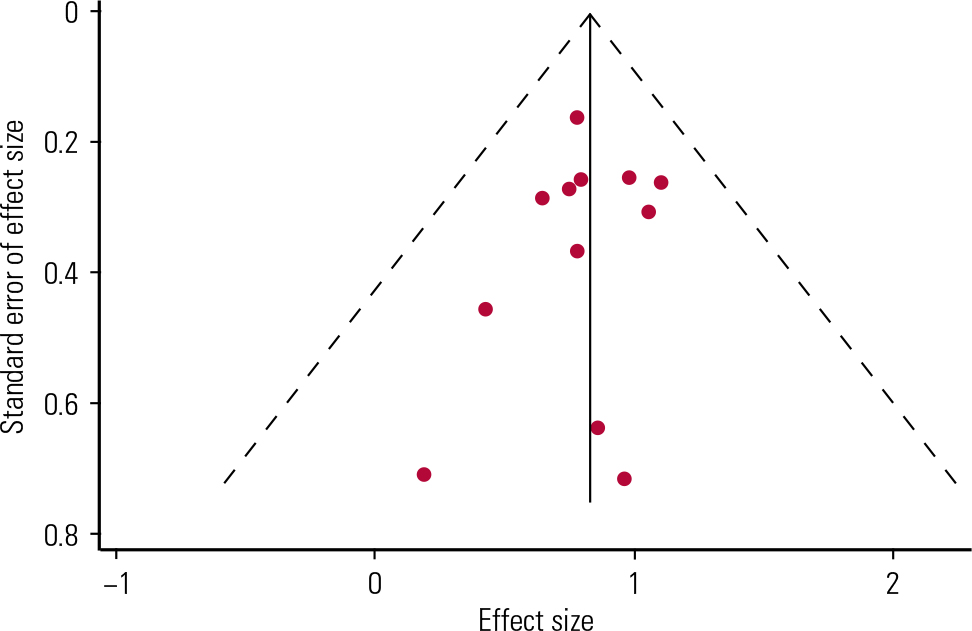
The funnel plot
A funnel plot is a scatter plot of treatment effect against a measure of study size and is used as a visual aid to detecting bias or systematic heterogeneity in studies (Reference Stern and HarbordStern 2004). A symmetric inverted funnel shape indicates that publication bias is unlikely. Asymmetry indicates a relationship between treatment effect and study size, thus suggesting the possibility of publication bias or a systematic difference between smaller and larger studies. The area that appears underpopulated in the CAT funnel plot (Fig. 3) is in the bottom right, which would correspond to the studies with a small sample (n <10) and a large effect (d + >1). If we exclude the studies with the biggest standard error (which corresponds to studies with n ≤10) then a smaller, more coherent range of effect sizes (d + = 0.65–1.1) is found. The funnel plot asymmetry in Fig. 3 might suggest that some studies have been systematically excluded – possibly through publication bias – but it is implausible that CAT studies were excluded for showing too big an effect.
Funnel plot of the CAT evidence with pseudo-95% confidence limits.
Discussion of the evidence base
Our analysis suggests that there is evidence that CAT is effective in routine clinical practice and under clinical trial conditions for a diverse range of presenting disorders. This has been the first attempt to quantify effect sizes across CAT studies. Heterogeneity was small in the analysis, with a chi-squared less than the degrees of freedom, so the I 2 (another measure of heterogeneity) and tau-squared (between-study variance) values were zero. The small sample sizes in the outcome studies appears the likeliest explanation of the lack of heterogeneity. The average sample size was n = 27 and this is acknowledged as underpowered for a test of heterogeneity. Although effect sizes did vary across outcome studies when considering effects as a whole (d + = 0.19–1.1), the effects were all positive. All studies (bar two) generated moderate/large effect sizes (d + ≥0.5) and most had a 95% CI which did not overlap 1.
Reference Calvert and KellettCalvert & Kellett’s (2014) systematic review of the methodological quality of the CAT outcome studies categorised 52% as high quality. Most of the studies reviewed were completed in typically ‘hard-to-treat’ clinical populations, such as people with personality disorders. It should be noted therefore that the overall large uncontrolled effect size found (d + = 0.83) was achieved using a therapy that is brief and has a time-limited approach, but is also typically tested in patients with complex presentations. The review also highlighted that the drop-out rate from CAT was low compared with other modalities. This suggests that CAT is a talking treatment with high face validity and good acceptability across patient groups. Commissioners of services need to take note of evidence of effectiveness and of what patients want and can tolerate. Evidence from the CAT single-case experimental designs shows that narrative and diagrammatic reformulations are often key change points during the therapy, often demonstrating ‘sudden gain’ events.
The number of studies available for analysis indicates that the establishment of a robust CAT evidence base is a nascent endeavour, clearly needing further development and support. Further expansion of the CAT research base will facilitate full meta-analytic procedures, both across and within diagnoses. Large-scale pragmatic trials (Reference Goodyer, Tsancheva and ByfordGoodyer 2011) also offer a methodology in harmony with Ryle’s original research ambitions for CAT. Practice-research networks (Reference Castonguay, Boswell and ZackCastonguay 2010) would also enable the rapid development of large-scale data-sets, given the increasing and enduring popularity of CAT in routine clinical practice. Use of the CCAT in future CAT RCTs is an essential component for benchmarking the integrity of the CAT delivered. Regular use of the CCAT is indicated in routine clinical care settings in terms of ensuring patient safety and also enhancing the personal/professional development of the therapist, via such ‘live’ clinical supervision of session material. Use of the CCAT in PBE-style evaluations of the effectiveness of CAT in routine clinical settings would be advantageous (Reference Barkham and Mellor-ClarkBarkham 2003), particularly if it can usefully dovetail with a ‘quality culture’ of clinical supervision in services noted in the previous point.
CAT in 2014
By Jason Hepple
Cognitive analytic therapy has been called a ‘humanised and skilled psychotherapy’ (Reference TyrerTyrer 2013) and it contains key features that demarcate it from other psychological therapies currently available in the NHS. As CAT is based on the consistent and compassionate delivery of a set of principles (alongside narrative/diagrammatic reformulations and goodbye letters), therapists’ adherence and fidelity to the model is an important aspect of service delivery. The development of the competency assessment tool – the CCAT (Reference Bennett and ParryBennett 2004) – facilitates competency assessment during clinical trials and training/supervision in routine clinical practice, to reduce therapeutic drift. An assessment of the competency of CAT therapists working in routine clinical practice with patients who had personality disorders showed evidence of consistent fidelity to the CAT model across sessions and therapists (Reference Kellett, Bennett and RyleKellett 2013a).
Clinical contexts: hard-to-engage patients, teams/systems and group therapy
The principle-driven approach of CAT allows the way the therapy is conducted to be closely attuned and melded to the emotional and relational needs of the patient and to the unique encounter that occurs and evolves in the consulting room and therapeutic relationship. This may be why CAT has gained a clinical reputation for engaging patients who do not naturally take to the psychoeducational and solution-focused approaches shown to help many patients with less severe mental health difficulties.
Because of its core relational understanding, CAT is being increasingly applied to team contexts/systems. This enables a ‘common language’ for formulation and treatment, helping team members reflect on the enactments occurring (a) between patients and the team, (b) within the team itself and (c) between the team and the wider system within which it is working (Reference Kerr, Dent-Brown and ParryKerr 2007).
More recently, CAT is being successfully delivered in group settings ranging from shorter programmes with an emphasis on focused procedural recognition and revision to year-long programmes for patients who have experienced more severe neglect and trauma (Reference HeppleHepple 2013).
Working beyond diagnostic labelling
In providing a relational and dialogic model of self and development, CAT does not easily mesh with a system of rigid diagnostic categories based on symptom clusters. This has been a problem for CAT as National Institute for Health and Care Excellence (NICE) guidelines for psychological therapies are based on these categories. However, CAT has succeeded in being acknowledged in the guidance for eating disorders and borderline personality disorder (National Collaborating Centre for Mental Health 2004; National Institute for Health and Clinical Excellence 2009).
CAT is closer to the ‘post-psychiatry’ understanding of Reference Bracken and ThomasBracken (2005), where the categories of the person seeking help are as important as those of the person or system delivering the help. CAT does not overlook symptoms/diagnostic labels and is not dismissive of biological/genetic factors; rather, it emphasises the meaning of these labels to the patient in context, forming a starting point for collaboration and exploration. CAT can provide a complementary alternative to a neurobiological model of mental illness. The recent controversy regarding the revisions to international diagnostic systems may show that the time has arrived for more of a variety of perspectives in psychiatry and psychological therapies.
The future of training in CAT
The ability to use CAT tools sensitively and competently and to reflect (predominantly in real time) on the complex re-enactments taking place between patient and therapist in order to facilitate change is a difficult skills set to master. It clearly requires time, close clinical supervision and a serious amount of training. This is a current challenge for CAT in the UK.
CAT is seen as a good second-line approach for ‘complex’ patients – those with prominent unhelpful personality traits and disorders and those with multiple diagnoses that do not fit neatly into rational pathways of care. CAT is now recognised as an approach for people with personality disorder in the Improving Access to Psychological Therapies (IAPT) for Severe Mental Illness Project (Reference Roth and PillingRoth 2014). There is demand for more training and faster training. But how can CAT become more accessible to psychological therapists (including IAPT therapists) without over-simplifying itself and throwing away, with the bath water, the baby it has taken 30 years to nurture? This is a challenge that the Association for Cognitive Analytic Therapy (ACAT) must answer by the development of more flexible, targeted and accessible training across the UK. This will supplement the regular complement of introductory days, 6-month CAT skills courses, the twelve 2-year practitioner training courses, clinical supervisor training and the single national psychotherapy training currently available. This training must also embrace the demand for skills in contextual CAT formulation with teams/organisations and the use of CAT in group therapy.
Conclusions
Cognitive analytic therapy offers an effective yet collaborative talking therapy that is sufficiently pragmatic to be affordable in NHS settings and remains popular with patients and therapists. It is hoped that there will remain room in the NHS for a psychological therapy based on a relational and developmental paradigm, as an alternative to an overreliance on manualised therapies and interventions based on diagnostic clusters linked to a neurobiological understanding of mental illness. CAT adapts and matches its approach and tools to the needs, concerns and zone of proximal development of the patients it seeks to help. It is this core flexibility that makes it effective with complex presentations and with patients who are hard to engage using other methods.
MCQs
Select the single best option for each question stem
-
1 Outside the UK, CAT is most established in:
-
a Finland
-
b Germany
-
c New Zealand
-
d India
-
e France.
-
-
2 ‘Where desired outcomes are avoided because they provoke, or are felt to provoke, forbidden or dangerous outcomes’ is a CAT definition of a:
-
a trap
-
b dilemma
-
c snag
-
d reciprocal role
-
e self-state.
-
-
3 The Personal Structure Questionnaire (PSQ) is a validated measure of:
-
a structural dissociation
-
b the number of self-states exhibited by the patient
-
c the severity of childhood trauma reported
-
d the types of target problems brought by the patient
-
e the likelihood of therapeutic rupture during the therapy.
-
-
4 The following is not a major influence on CAT theory and understanding:
-
a social formation of the self (Lev Vygotsky)
-
b personal construct theory (George Kelly)
-
c observational studies of infant–caretaker interactions
-
d object relations theory
-
e unconscious drives and processes.
-
-
5 The evidence base for CAT suggests that:
-
a CAT is ineffective in the treatment of personality disorder
-
b CAT should be targeted at patients with particular symptom clusters
-
c CAT may be effective in routine clinical practice for a range of conditions
-
d patients tend to drop out more frequently from CAT than from other talking therapies
-
e CAT outcome studies are of low methodological quality.
-
MCQ answers
| 1 | a | 2 | c | 3 | a | 4 | e | 5 | c |
Acknowledgements
With thanks to Dave Saxon for help with the forest plot benchmarking CAT outcome studies.


eLetters
No eLetters have been published for this article.