

Within the vast literature on parties and party systems, small parties have been relatively understudied. Unlike the electoral performance of major parties, we have a rather fragmented picture about the factors facilitating the success of small parties. What we know best, following Duverger’s (Reference Duverger1963 [1951]) law, is how the mechanics of electoral systems dictate the fate of different-sized parties. The incentives created by plurality systems in particular condition the viability of small parties, as they are likely to suffer electorally from the strategic desertion of voters (Cox Reference Cox1997). Yet, important as such an intuition may be, it only speaks to the relative chances of success between larger- and smaller-sized parties. It does not, however, provide any insights as to why some small parties become more successful than others.
For example, why was the Danish New Alliance more successful than the Danish Greens Party? The former appeared in 2007 and saw its electoral support increase from 2.8 to 5 percent; the latter appeared in 1988, got 1.4 percent of the vote and subsequently saw its appeal diminish, until it ceased to exist. Similarly, why has the Greek Communist Party been more successful than the Austrian Communists have ever been? Some explanations focus on the importance of social divisions (Harmel and Robertson Reference Harmel and Robertson1985; Kitschelt Reference Kitschelt1988; Hug Reference Hug2001), while others emphasize the role of electoral systems (Mainwaring and Torcal Reference Mainwaring and Torcal2006). Yet, these accounts cannot help us distinguish why some small parties manage to endure and grow electorally, while others struggle and die out.
We address this conundrum by focussing on the role of national parliaments. We argue that parties entering parliament are more likely to gain votes in subsequent elections. Entering parliament is a key resource for small parties; among other things, it can provide them with policy-making influence, public funding and media visibility. Parties not managing to win seats are at a disadvantage as they face significant subsistence costs and have limited access to the media. Moreover, parliaments signal organizational capacity and electoral viability and reduce uncertainty about parties’ ideological profile.
Investigating empirically the observable implications of this argument is difficult, however, as parliamentary representation is contingent upon parties’ electoral performance. Parties’ electoral fortunes are affected by factors like organizational capacity, ideological consistency and appealing leadership. These features account both for variation in vote shares and, as a consequence, for the fact that some parties get into parliament whereas others do not.
To overcome this problem, we use an institutional element that is quite common in multi-party systems: legal thresholds of representation at the national level. Thresholds usually take the form of a fixed vote percentage, which sets the bar for entering parliament (Taagepera and Shugart Reference Taagepera and Shugart1989). If a party reaches the threshold, it is guaranteed parliamentary representation; if it fails to do so it is (almost always) excluded from parliament. Thresholds, in short, create discontinuities that we take advantage of in order to estimate the causal effects of entering the legislature. Doing so, we are able to isolate the effects of obtaining at least one seat, circumventing problems of selection associated with the size and electoral appeal of parties.Footnote 1
To test our expectations we use an original data set with electoral results from all countries in the world that employed a national threshold of representation at least once since WWII. Our analyses reveal that parliamentary presence helps parties win almost two-thirds more votes in comparison with their previous showing. These findings suggest that entering the legislature may be key for broadening the appeal of small parties. While it does not guarantee perennial prosperity, it privileges parties in comparison to their competitors outside parliament and provides access to valuable resources. Interestingly, these effects are stronger in instances where party brands are weaker (i.e., in the context of new democracies and for new party entries). We elaborate on the implications of our findings for theories of voting behavior, party competition and party system change in the concluding section.
Small Parties and Parliamentary Representation
The literature on small parties is relatively underdeveloped; despite numerous case studies, few scholars treat them in a systematic and comparative fashion.Footnote 2 Most approaches have been descriptive in nature, documenting the universe of small competitors and the challenges they face (see, e.g., Müller-Rommel and Pridham Reference Müller-Rommel and Pridham1991). While several authors see small parties as important elements of party systems (Sartori Reference Sartori1976; Pedersen Reference Pedersen1982; Spoon Reference Spoon2011), we know surprisingly little about the factors influencing their success. Interestingly, numerous studies have focussed on the formation and early success of new parties, either comparatively (Harmel and Robertson Reference Harmel and Robertson1985; Hug Reference Hug2001; Tavits Reference Tavits2006; Lago and Martínez Reference Lago and Martínez2011; Hino Reference Hino2012; Bolleyer and Reference Bolleyer and BytzekBytzek 2013) or by focussing on specific types of parties (Kitschelt Reference Kitschelt1988; Kitschelt Reference Kitschelt1989; Ignazi Reference Ignazi1992; Kitschelt Reference Kitschelt1995; Harmel and Svasand Reference Harmel and Svasand1997; Kalyvas Reference Kalyvas1998; Golder Reference Golder2003). Unfortunately, even if new parties almost always start off as small parties, not all small parties are new, and thus this literature is of limited use for understanding the factors driving the success of small parties.
What accounts for the variation in small parties’ electoral trajectories? The few studies that have tackled this question highlight the role of electoral institutions (Mainwaring and Torcal Reference Mainwaring and Torcal2006) and social divisions (Harmel and Robertson Reference Harmel and Robertson1985; Kitschelt Reference Kitschelt1988). On the one hand, permissive electoral systems facilitate the performance of new competitors (Harmel and Robertson Reference Harmel and Robertson1985; Golder Reference Golder2003). On the other, the electoral fortunes of new entrants are deemed to be contingent upon their ability to identify and prime untapped issues (Hug Reference Hug2001).
The problem with these accounts is that they are inherently static. For example, electoral systems cannot help us explain small party success and perseverance within the same country; electoral rules are constant and exert similar pressures to all small parties. Neither can policy/issue approaches help us fully understand variation in party strength. As Meguid (Reference Meguid2005) shows, the success of new political actors in introducing new issues is contingent upon the response of existing parties; and this response is, in turn, endogenous to the country-specific dynamics of party competition.
We point to a different direction that can account for the fortunes of small parties at any point in time, both within and across countries. In particular, we allude to the role of parliamentary presence and claim that it is a key variable in helping us understand the divergent trajectories of small parties over time. Entering parliament comes with several perks. In this sense, Katz and Mair (Reference Katz and Mair1995) note that parliamentary parties can use the state as a support mechanism that helps them exclusively and disadvantages new competitors. To this end, we often find regulations that provide parliamentary parties with several privileges, most typically the opportunity to take part in the policy-making process, media access and financial support.
Beyond institutionalized privileges, parliamentary presence can have several positive byproducts for parties: media attention, attractiveness for donors, as well as improvements in the organizational knowhow of parties are only some of them. Moreover, parliamentary status may benefit parties, even those with a poor legislative performance, if voters perceive them as more likely to reenter parliament. Voters concerned about the possibility of casting a “wasted” vote may strategically abandon non-parliamentary parties in favor of legislative ones.
Failing to enter parliament incurs several costs as well. Arguably, the most onerous task is sustaining the organizational capacity of the party; maintaining a functioning bureaucracy is expensive and in the absence of public funding it may lead to a reduction of party functions. To make things worse, ambitious, skilled political personnel may abandon the party, especially if its future electoral prospects are perceived by its members as limited. Finally, the appeal of the party may suffer, as apart from the unavoidable limited media coverage, voters may perceive it as peripheral for policy making and less likely to be successful in the future.
Yet, while entering parliament may be desirable, it entails costs that are rarely specified in the literature. Parties in legislatures have to take a stance on all proposed bills; they are unable to eschew controversial issues, and may suffer negative consequences because of their policy choices. Research on Green and new populist parties indicates that entering parliament can cause significant divisions between the party on the ground and the party in office (van Biezen Reference van Biezen2000). Similarly, appraisals of managerial efficacy may cause negative externalities, both for governmental and opposition parties. Perceptions of mismanagement or failure to articulate alternative proposals may result in public disapproval. The assessment of parties’ competence in parliament can be crucial for small parties, especially those that cease to use extra-institutional channels of protest and become active participants in policy-making inside legislatures (Bolleyer Reference Bolleyer, van Spanje and Wilson2008).
In spite of the positive and negative aspects of parliamentary presence, there is remarkably scant empirical evidence on its effects on party appeal. The only body of literature that remotely touches upon some of these issues is the literature on incumbency effects, and results are mixed. In contrast to the US congressional elections (Lee Reference Lee2008), in multi-party systems it is more frequent to find negative rather than positive effects of government incumbency (e.g., Rose and Mackie Reference Rose and Mackie1983; Strøm Reference Strøm1990; Powell and Whitten Reference Powell and Whitten1993; Buelens and Hino Reference Buelens and Hino2008). Importantly, these effects are not restricted to major parties but extend to minor coalition members as well. Rüdig (Reference Rüdig2006) shows that Green parties entering coalition governments in Central Eastern Europe suffer sharp electoral losses. Font (Reference Font1999), examining the Spanish subnational elections, demonstrates that incumbency provides an advantage for major members of coalition governments, but causes electoral loses for minor ones. Finally, van Spanje (Reference van Spanje2011) attributes an additional cost of governing to those anti-political-establishment parties that become members of coalition governments.Footnote 3
Certainly, most small legislative parties do not become members of government. Even when focussing on niche parties, the existing evidence is far from conclusive and largely confined to the impact of their policy positions on electoral support (Meguid Reference Meguid2005; Adams et al. Reference Adams, Clark, Ezrow and Glasgow2006; Ezrow Reference Ezrow2008; Spoon Reference Spoon2011). We, thus, lack an understanding of the effects of parliamentary presence for small parties. A broader comparative look, which would encompass all small parties that enter parliament, irrespective of whether they join a cabinet or not, is essential in order to see whether parliamentary presence does benefit them. We do this employing an identification strategy that allows us to estimate the causal effect of parliamentary representation on parties’ electoral fortunes. In addition to measuring the overall effect of parliamentary representation on electoral performance of small parties, we will also examine which parties are particularly affected by our treatment. In this sense, it is remarkable that the literature as a whole does not address the presence of heterogeneity with regard to subsequent vote shares of small parties in response to parliamentary representation.
Empirical Strategy
Parties do not enter parliament by chance; the probability of doing so hinges on their candidates’ appeal, organizational capacity and other factors that distinguish them in a non-random fashion. Attributing any difference in parties’ electoral performance to the fact that some previously entered parliament whereas others did not runs the danger of ignoring various traits that explain why some parties are more successful electorally than others.
To address this problem, we use the discontinuities created by the presence of electoral thresholds. In some proportional representation (PR) systems, parties cannot enter parliament unless their national vote share surpasses a legal threshold. For example, Austrian parties from 1994 onwards are required to gain at least 4 percent of the national vote in order to enter parliament. Clearly, thresholds can be endogenous to the patterns of political competition (Boix Reference Boix1999; Colomer Reference Colomer2004). This is not a problem, however, insofar as parties cannot manipulate their vote shares so as to be right above or below this threshold. This is impossible to achieve in free and fair elections. Thresholds seldom target specific parties and when they do, they are set at a much higher level than the expected vote share of these parties.Footnote 4 The allocation of seats for parties in the area around the threshold can thus be regarded as good as random. As Lee (Reference Lee2008) shows, this assumption holds as long as the vote share of a given party includes some random component with a continuous density.
For instance, consider two parties in Sweden that get 4.1 and 3.9 percent of the vote in election t, respectively. Although they may differ in various respects, it would be safe to assume that such small differences can be attributed to random chance. If this is true, then at the neighborhood around the threshold we could treat the treatment assignment mechanism (making it or not to the parliament) as if it were stemming from a randomized experiment. We can then use the discontinuities emerging from this random-like environment to estimate the effects of parliamentary presence on the electoral fortunes of small parties. The comparison between parties just below and parties just above the threshold reveals the effect of parliamentary representation for parties near the zone of the electoral threshold. This is the target population of our application because it is for these parties that the probability of being present in the national legislature varies over time. For large or very small parties, parliamentary representation is a constant, and therefore cannot explain variation in their vote shares.
Crossing the national threshold, however, is sometimes a sufficient but not a necessary condition of parliamentary representation. This happens because some electoral systems allow parties under certain conditions to enter parliament even if they do not clear the threshold. In some cases, these exceptions aim at securing representation of geographically concentrated ethnic minorities. In most cases, however, they are the result of the two-tier structure of mixed electoral systems in which a party can gain seats in the nominal tier, even if it gains no seats in the list tier. In our data set, 20 percent of parties that obtained a vote share below the threshold entered the parliament. Because these parties take the treatment (enter parliament) even if assigned the opposite (having a vote share below the threshold), they are known as “always takers.” To accommodate this group in the analysis, our results are based on a fuzzy regression discontinuity (RD) design. In this case, electoral performance of party k at t 0 (the so-called forcing variable, X k0) does not deterministically predict entrance into the legislature, but does so in a probabilistic way. Accordingly, it is used as an instrument of actual parliamentary representation status (Imbens and Lemieux Reference Imbens and Lemieux2008).Footnote 5
Getting into estimation issues, we follow Imbens and Kalyanaraman (Reference Imbens and Kalyanaraman2009) in using a local linear regression estimator, with a triangular kernel. This estimator has attractive bias properties in estimating regression functions at the boundary (Fan and Gijbels Reference Fan and Gijbels1992) and enjoys rate optimality (Porter Reference Porter2003). In the case of the sharp RD design, the estimator provides estimates for the parameters of interest that minimize the following function:
 $$\mathop{{\min }}\limits_{{\alpha ,\beta ,\gamma ,\delta }} \mathop{\sum}\limits_{{i=1}}^{N} 1\left\{ {c{\minus}h\leq X_{i} } \right.\left. {\leq c{\plus}h} \right\}(Y_{i} {\minus}\alpha {\minus}\beta (X_{i} {\minus}c){\minus}\gamma T_{i} {\minus}\delta (X_{i} {\minus}c)T_{i} )^{2} ,$$
where c is the electoral threshold, T the treatment condition (0=no seat, 1=at least one seat), X i the vote share of parties at election t 0 and Y the outcome in question: parties’ vote share at election t 1. This model can also be augmented by the inclusion of country fixed-effects.
The fuzzy RD estimation is very similar apart from the fact that
T is now instrumented by Z (0=below
threshold; 1=above threshold) and
Z×(X–c). Thus, our
first-stage regression takes the following form: T=α
1
+β
1
(X
i−c)+γ
1
Z
i
+δ(X
i
−c)Z
i
+μ
i
; we then use
 $$\hat{T}$$
from the first stage to estimate the parameters in the second
stage:
$$\hat{T}$$
from the first stage to estimate the parameters in the second
stage:
 $$Y=\alpha _{2} {\plus}\beta (X_{i} {\minus}c){\plus}\gamma _{2} \hat{T}_{i} {\plus}\delta _{2} (X_{i} {\minus}c)\hat{T}_{i} {\plus}v_{i} $$
. Our treatment effect estimate is given by γ
2. Figure A.1, shown in the Online Appendix, illustrates the
presence of a very strong first stage in our fuzzy RD.
$$Y=\alpha _{2} {\plus}\beta (X_{i} {\minus}c){\plus}\gamma _{2} \hat{T}_{i} {\plus}\delta _{2} (X_{i} {\minus}c)\hat{T}_{i} {\plus}v_{i} $$
. Our treatment effect estimate is given by γ
2. Figure A.1, shown in the Online Appendix, illustrates the
presence of a very strong first stage in our fuzzy RD.
In order to estimate the parameters of interest, we need to define h, the bandwidth around the cut-off point.Footnote 6 How much should we open the window below and above the electoral threshold in order to capture the effect of parliamentary representation on subsequent electoral performance?Footnote 7 We use the optimal bandwidth algorithm proposed by Imbens and Kalyanaraman (Reference Imbens and Kalyanaraman2009, henceforth IK).Footnote 8 We also test the robustness of these estimates using half of the proposed bandwidth.
Electoral thresholds vary both over time and across countries. To facilitate the analysis, we need to rescale parties’ vote shares so that they all correspond to a common threshold. The exact vote percentage of the common threshold is completely arbitrary. For simplicity, we set this common threshold at the mean value across all thresholds in our data set, at 3.51 percent.Footnote 9
Data set and dependent variable
To conduct the empirical analysis, we first identified countries that had employed a legal threshold of representation at the national level at least once since 1945.Footnote 10 We then created an original data set that included all parties that had run in elections under that institutional framework. With PR, the operation of the threshold is straightforward: parties that do not exceed the threshold do not usually enter the parliament. For mixed systems, however, it is not obvious how thresholds work. In both parallel (e.g., Lithuania) and compensatory (e.g., Germany) mixed systems, the threshold only applies to the list tier. Hence, if a party does not clear the threshold, it does not get any PR seats. This, however, does not prevent it from winning seats in the nominal tier.Footnote 11 These are the parties that we referred to in the previous section as always takers: they take the treatment (enter the parliament) without being assigned to do so (exceed the threshold).
In Table 1, we report the list of countries, elections and thresholds that are included in the analysis. As can be seen, we have a diverse list of thresholds that varies widely across countries and over time. Thresholds vary from a minimum of 0.67 percent in the Netherlands after 1956 to 10 percent in Turkey. This variability forced us to standardize thresholds so that we have one common point of reference. As mentioned above, we use as a standardized measure the average threshold across all cases (3.51 percent); and we standardize accordingly the vote share of all parties.
Legal Thresholds of Representation at the National Level Around the World, 1946–2011

Note: own elaboration upon Jones (Reference Jones1995), Jones (Reference Jones1997), Shvetsova (Reference Shvetsova1999), Birch (Reference Birch2003), Colomer (Reference Colomer2004), Gallagher and Mitchell (Reference Gallagher and Mitchell2008) and electoral laws of each country.
For each election in our data set, we measured the vote share of all parties.Footnote 12 However, given our empirical strategy, our analysis uses information only for parties that were close to the threshold at any given election. Once we identify those parties, we code their electoral performance at election t 0 and election t 1 (X k0 and X k1, respectively). Proximity to the threshold is defined by the margin above and below the threshold, calculated by the IK bandwidth algorithm mentioned above. If parliamentary representation improves parties’ electoral fortunes, those barely exceeding the threshold at election t 0 should perform better in the subsequent election (t 1) than parties that just missed the threshold at t 0.Footnote 13
All countries in our data set offer at least one case in at least one of our treatment tests. The actual number of cases each country provides depends on the width of the window around the threshold. There is no country that provides more than 9 percent of the total number of cases in any of the analyses.Footnote 14
Results
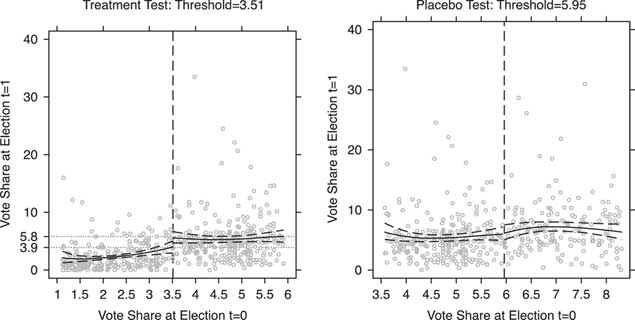
Figure 1 plots the data using electoral performance at election t 1 as the outcome variable. The solid curves denote the local expectation of X k1, conditioning on X k0. The figure covers the area suggested by the optimal bandwidth (h=2.4). The 95 percent point-wise bootstrapped confidence bands accompanying the local regression estimates are shown with the dashed lines. The key message from the figure is the gap in parties’ vote shares at the cut-off point that corresponds to parliamentary representation. The vote share of parties just exceeding the threshold is much higher than those that just missed it. By minimally extrapolating the two conditional expectations for each group at the point of the discontinuity, we find a 1.9 percent gap. Parties that have not cleared the threshold receive 3.9 percent at election t 1, whereas those who overcome the threshold get 5.8 percent at t 1.
Vote share at time t 1 as a function of vote share at time t 0 Note: in the left panel, parties below and above the cut-off point differ in their status of parliamentary representation. In the right panel, parties below and above the threshold do not differ in terms of parliamentary representation. The solid line presents the loss fit whereas the dashed curves denote the 95 percent confidence bands of the local estimates. The dotted parallel lines in the first graph indicate the difference between the two subsamples at X k0=c.
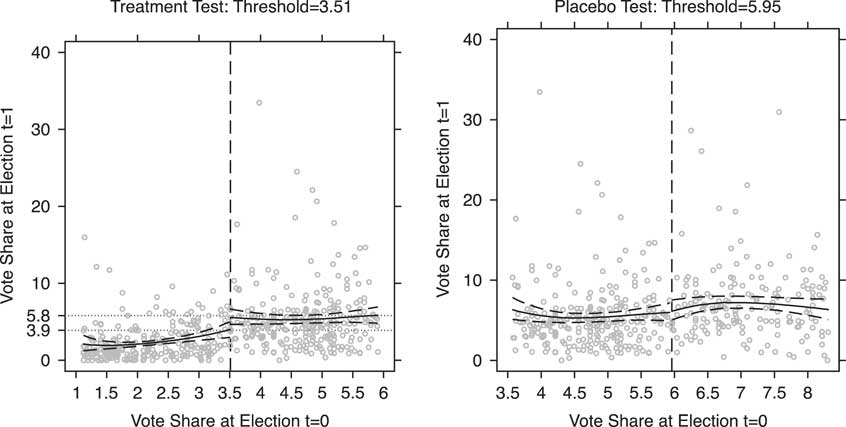
The right panel of Figure 1 presents a placebo test. Using as an artificial threshold the sum of the original threshold and the selected window, i.e. 3.51+2.40=5.91 percent, we can compare the group of parties whose vote share ranges between the original threshold, 3.51 percent, and the original threshold incremented by twice the selected window, 3.51+2×2.40=8.31 percent. If the effects found in the first panel are not because of parliamentary representation, the right panel should reveal a similar pattern, given that the same window in terms of vote share is employed. However, in this case all observations are treated, i.e., all parties acquire parliamentary representation, and we observe no difference between the two groups. The test indicates that the differences in subsequent electoral performance observed in the left panel must be because of the effect of parliamentary representation.
Given that the decision to participate in future elections is most likely conditioned upon the anticipated electoral success, excluding all parties that fail to participate in the next election, as we do here when estimating the gap in terms of electoral performance, is likely to produce a downward bias in these results.Footnote 15 We are thus probably providing a lower bound of the effect of parliamentary representation on the future success of parties.
Table 2 presents the local linear regression results with regard to a party’s electoral performance at t 1. All estimates stem from a fuzzy RD, in which electoral performance, evaluated at the point of the discontinuity, is used as an instrument of whether the party gets seats. The first two columns of the table display the estimation using the IK optimal bandwidth, i.e. h=2.40. The results from column 1 suggest that making it to the parliament boosts future electoral performance by 2.24 percent. Including country fixed-effects leaves this finding substantively unchanged (column 2). Columns 3 and 4 use half of the bandwidth, i.e. h=1.20. Although the magnitude of the effect appears lower (and the uncertainty surrounding these point estimates is higher), we still find that parliamentary insiders on average increase their vote share by at least 1.5 percentage points. This estimate amounts to an increase of ~40 percent.
Vote Share at Time t 1 as a Function of Vote Share at Time t 0
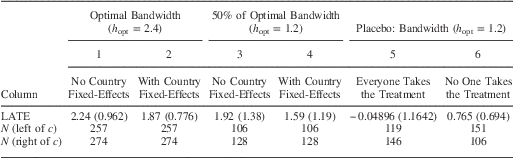
Note: LATE, local average treatment effect. Estimates taken from fitting Equation 1 in the subsample indicated by h. Robust standard errors in parentheses. In columns 5 and 6, the chosen bandwidth is 2.4/2=1.2. The cut-off point is 4.71 and 2.31 in the fifth and the sixth columns, respectively.
The last two columns of Table 2 present two placebo tests comparable with the findings when half of the optimal bandwidth is used. Column 5 uses an artificial threshold derived from adding half of the IK bandwidth to the electoral one (X k0=3.51+1.20=4.71 percent). Similar to the logic of the right panel in Figure 1, the two groups are identical in terms of their vote share difference to the two groups compared in the third and fourth columns of the table. However, they do not differ in terms of treatment status—all of them have achieved parliamentary representation at election t 0. Column 6 denotes the mirror image of column 5 but none of the parties in this final analysis has cleared the threshold. The new cut-off point is 3.51–1.20=2.31 percent. As shown in columns 5 and 6, in none of the two tests do we find any discernible gap in favor of the artificially treated group. Overall, the results in Table 2 indicate that parliamentary presence benefits parties substantially, increasing their relative vote shares by about 66 percent in the election immediately after they enter parliament.
Robustness Checks
We now subject our results to four tests, all of which assess the extent to which the assumption of exchangeability of parties below and above the threshold holds. First, Figures A.2, A.3 and A.4 in the Online Appendix show that the results remain almost identical when excluding cases with vote share at t 1 higher than 20 percent, all observations from the two countries with the lowest thresholds (i.e., Israel and the Netherlands), or each country consecutively. Second, we test for the possibility of sorting in the forcing variable using the McCrary density test (McCrary Reference McCrary2008). The p-value for the null of no-sorting is 0.918. Figures A.5 and A.6 in the Online Appendix illustrate the absence of sorting by showing the lack of a discontinuity in the density of the forcing variable; there is no gap in the probability of falling either just below or just above the electoral threshold.
Table 3 presents another robustness check. Following Imbens and Lemieux (Reference Imbens and Lemieux2008), we test for a jump in the outcome of interest at points where we should not expect such jumps. To do so, we split the subsample with X k0 below the cut-off value in two groups and examine whether there is a within-group gap. We do the same for the group with X k0>c. To maximize the power of this test, we use as thresholds the median vote share of the subsamples on either side of the cut-off value. The results, shown in Table 3, provide no support for the possibility of a within-group discontinuity. In other words, we find no gap comparable in magnitude and statistical significance with the gap we find at the actual discontinuity point. This is true both with the group of parties that have overcome the electoral threshold and with the parties below the cut-off point.
Testing for Within-Group Jumps: Electoral Persistence and Electoral Performance
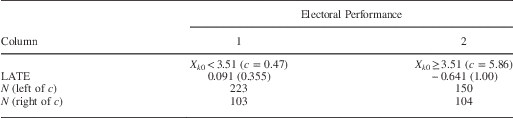
Note: LATE, local average treatment effect. X k0 denotes the electoral share of a party k in election t 0. c is the vote share in election t 0 treated as the cut-off point. All estimates are implemented within each subsample from the original threshold (3.51). All estimates stem from local linear regressions with robust standard errors in parentheses. When excluding the always takers in the first column, the results are almost identical, i.e. 0.239 (0.398).
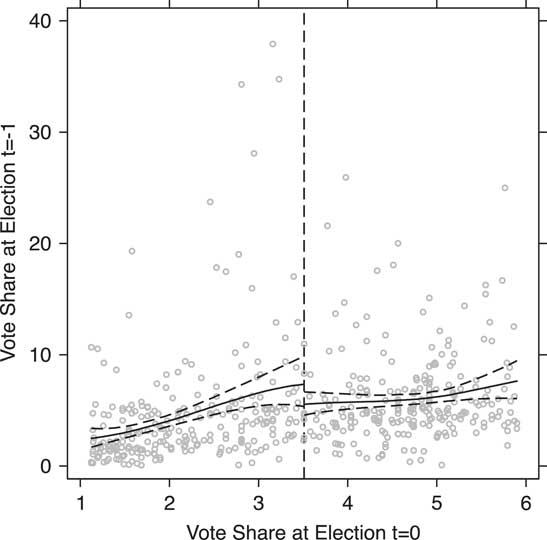
Figure 2 provides a final robustness check. As Imbens and Lemieux note, one should not find an effect on pseudo outcomes, known to be not affected by the forcing variable (2008, 631). Here, we follow Lee (Reference Lee2008) and others (e.g., Eggers and Hainmueller Reference Eggers and Hainmueller2009) in using previous electoral performance as one such pseudo outcome. We should not expect parliamentary representation at t 0 to affect electoral performance at election t k−1. Figure 2 presents the conditional expectation of X k−1 using the same window as in the original tests. The picture shows that no gap is observed between the two groups in terms of their lagged electoral performance. The local regression estimate is −3.09 (SE 1.55, N left of threshold=255; N right of threshold=252). The equivalent effect taken by using half of the IK threshold (h=1.20) is −2.16 (SE 1.87, N left of threshold=107; N right of threshold=122). Clearly, there is no positive gap as a result of crossing the threshold in parties’ lagged electoral performance.
A placebo test: vote share at election t −1 conditional on vote share at election t 0 Note: the threshold is 3.51. The solid line presents the loss fit whereas the dashed curves denote the 95 percent confidence bands of the local estimates. The vertical axis depicts the vote share of parties at election t −1.
Long-Term Party Survival
By increasing insiders’ electoral prospects, participation into the national assembly should also bring long-term organizational benefits. The opportunity to attract members and political careerists as well as increased media visibility is likely to leave a long-lasting imprint on parties’ chances of survival. Failure to gain access into the parliament, on the other hand, might have severe organizational costs. Lack of parliamentary representation is costly not only in terms of financial resources but is also likely to cause strategic desertion among party cadres. Thus, the initial electoral gap between parliamentary insiders and outsiders is likely to partially determine the endurance of small parties into the electoral competition. Insiders are more likely to continue fighting elections under the same organizational status. Outsiders, on the other hand, are more likely to dissolve, merge or join other party formations.
We test this argument by using as a dependent variable the proportion of elections a given party competed in since it enters our data set. For example, the Greens in Germany enter our data set in 1983 and participate in all Federal elections since. Hence, their score in our new outcome variable is 1. The Austrian Liberal Forum, however, starts participating in elections in 1994 and with the exception of the 2006 parliamentary election—in which it did not run—it takes part in all elections up to 2008, our last coded election for this country. Thus, the party participates in five out of six possible elections and its score in our variable measuring party longevity is 0.83 (5/6).
The results from this exercise appear in Table 4. The two columns reveal a very similar pattern. On average, making it into the parliament increases the party’s survival rate by 0.116 points in a 0–1 scale. This effect illustrates the long-standing effects of parliamentary representation in the formation and change of party systems. To be sure, similar to electoral success, this effect might conceal significant heterogeneity, according to the age of democratic rule. Given the vast differences in party branding and partisan learning between new and old democracies, it is expected that the effect of parliamentary representation is more evident among the first. It is to this question that we now turn.
Parliamentary Representation and Party Survival

Note: RD, regression discontinuity. The dependent variable ranges from 0 to 1 and measures the proportion of elections a given party fought with the same status as in its first electoral participation. Scores lower than 1 denote parties which dissolve, merge with another party or refrain from running in at least one election. The Imbens and Kalyanaraman optimal bandwidth is used for the estimation. AI robust standard errors are shown in parentheses.
New Versus Old Democracies
As a final step in the analysis, we examine whether the effect of parliamentary representation varies by the democratic age of the country. By participating in the legislature, parties in new democracies obtain organizational resources and visibility that enable them to build ties with voters. In established party systems, party brands are more rigid and less dependent on parties’ short-term electoral fortunes.
As suggested above, parliamentary representation is assumed to be particularly important for political parties in new democracies not only with respect to their electoral success, our primary dependent variable, but also with respect to their long-term survival. The upward electoral shift caused by parliamentary entrance probably provides a comparative advantage for insiders in new democracies to endure in a still-evolving party system. In contrast, party competition in old democracies leaves hardly any room for successful new entrants (Katz and Mair Reference Katz and Mair1995).
To test these claims, we distinguish between new and old democracies by including in the second category all countries that have remained democratic since the end of WWII: Austria, Denmark, Germany, Iceland, Israel, Italy, the Netherlands, New Zealand, Norway and Sweden.Footnote 16
To examine the difference in the magnitude of the effect between new and old
democracies, we interact all terms of Equation 1 with a dummy denoting established democracies. In
order to include always takers in the analysis, we use again a fuzzy RD
design, whereby crossing the threshold (Z) is used as an
instrument of obtaining seats in the parliament (T). We
first obtain
 $$\hat{T}$$
through the first-stage equation shown below:
$$\hat{T}$$
through the first-stage equation shown below:
 $$\eqalignno{ & \hat{T}=\alpha _{0} {\plus}\alpha _{1} Z{\plus}\alpha _{2} {\rm Established}{\plus}\alpha _{3} (X_{i} {\minus}c){\plus}\alpha _{4} (X_{i} {\minus}c){\times} {\rm Established}{\plus}\alpha _{5} Z{\times}\cr & {\rm Established}{\plus}\alpha _{6} (X_{i} {\minus}c){\times}Z {\times}{\rm Established}, $$
and we then estimate the second stage as follows:
 $$\eqalignno{ Y= \,& \beta _{0} {\plus}\beta _{1} \hat{T}{\plus}\beta _{2} {\rm Established}{\plus}\beta _{3} (X_{i} {\minus}c){\plus}\beta _{4} (X_{i} {\minus}c){\times} {\rm Established}{\plus}\beta _{5} \hat{T}{\times}\cr & {\rm Established}{\plus}\beta _{6} (X_{i} {\minus}c){\times}\hat{T}{\times} {\rm Established}{\plus}\mu _{i} . $$
The effect of parliamentary representation, minimally extrapolated at the point of the electoral threshold, is given by β 1 for new democracies and by (β 1+β 5) for established democracies. Thus, β 5 provides an estimate of the difference in the magnitude of the effect between established and new democracies. The analysis employs a common bandwidth for both old and new democracies, equal to the original bandwidth for the whole sample (h=2.4). More detailed analysis, which uses group-specific optimal bandwidths, yields very similar results (see also note of Figure 3).
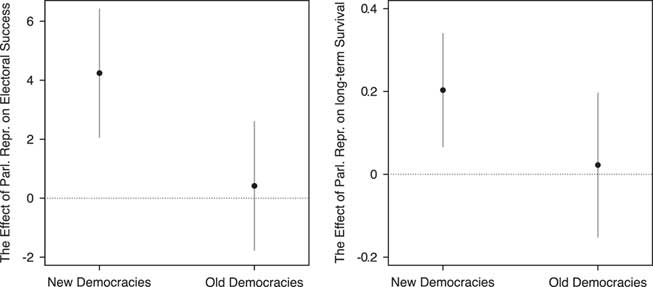
Distinguishing between new and old democracies, party vote share and long-run party survival Note: the black circles denote the fuzzy RD estimates, whereas the gray spikes trace the 95 percent confidence intervals. A fixed (h=2.40) bandwidth is used for the estimation. When each group is examined separately, we get the following estimates: Panel 1, new democracies: 3.51 (SE 1.38, h=3.27); old democracies: 0.723 (SE 0.974, h=2.697). Panel 2, new democracies: 0.162 (SE 0.055, h=3.34); old democracies: −0.058 (SE 0.126, h=2.27). Using identical bandwidths for each set of comparisons (h=3) produces substantively identical results.
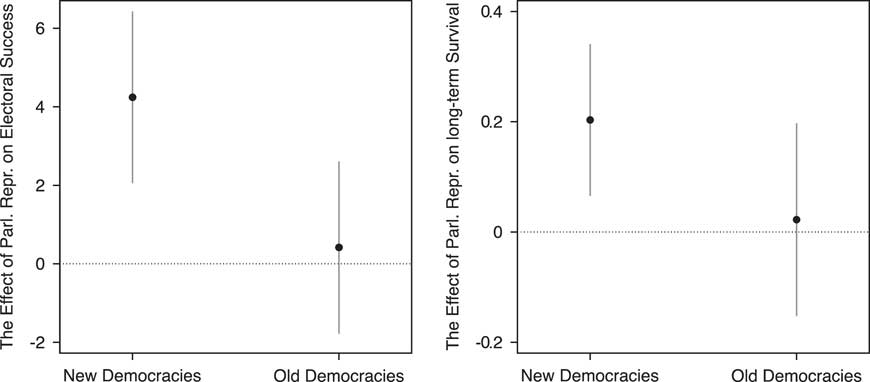
When using first electoral performance at election t 1 as the dependent variable, we find that β 5=−3.82 (SE 1.58), thus confirming the expectation that access into the national assembly is more pivotal when the party system is still evolving. The picture is similar when looking at electoral survival. We find that β 5=−0.181 (SE 0.113), which implies that parliamentary representation increases the chances of long-term survival in new democracies more than in old democracies.
Figure 3 plots the treatment effect estimates for the two groups of countries ((β 1) for new democracies and (β 1+β 5) for old democracies). The first panel presents the results for electoral success. The effect of obtaining at least one legislative seat does not seem to be statistically significant at any conventional level in established democracies. On the contrary, it seems to boost parties’ vote shares in new democracies. The second panel of Figure 3 looks at party survival rate. In new democracies, parties that gain foot in the national parliament are significantly more likely to participate under the same status in all coming elections. This effect decreases substantially once we look at established democracies.
Discussion
Using a newly compiled data set comprising all countries that employed a legal threshold of representation at the national level at least in one election since 1945, this article shows that entering parliament is a key variable for understanding small party success. When parties participate in the next elections they improve their electoral performance by attracting almost two-thirds more voters in comparison with their previous showing. These effects suggest that entering parliament may be the tipping point for small party success. Several potential mechanisms could account for the diverging fortunes of “insiders” and “outsiders.”
Clearing the threshold not only guarantees parliamentary representation but also provides parties with several benefits: policy-making influence, public funding, media visibility, perception of electoral viability and so forth. We believe that there exists a fundamental complementarity between the electoral showing of parties at time t 0 and the decisions of politicians and citizens to strategically run and vote for them at time t 1 (Cox Reference Cox1997). Moreover, if a party achieves legislative representation, it can serve the interests of its voters by promoting and enacting legislation. Finally, obtaining parliamentary representation may be a key mechanism in fostering organizational continuity and subsequent electoral performance of parties that heavily depend on public funding (Massicotte, Blais and Yoshinaka Reference Massicotte, Blais and Yoshinaka2004; Scarrow Reference Scarrow2007; van Biezen and Kopecky Reference van Biezen and Kopecky2007) or television campaigns (Farrell Reference Farrell1996; Norris Reference Norris2000; Bowler, Carter and Farrell Reference Bowler, Carter and Farrell2003). Furthermore, failing to enter parliament can seriously hurt parties, especially nascent ones. The lack of guaranteed funding, coupled with the difficulties parties have to make their presence felt to the public, means that non-parliamentary parties will be more vulnerable electorally and less likely to survive. These pressures may lead them to either merge with other parties, or cease to exist all together.
Importantly, the effect of national assemblies is much stronger in new democracies where party brands are weaker and voters are in the process of learning about parties’ positions and electoral viability. In developing party systems making it into the parliament does not only increase considerably a party’s vote share in the next election but also accounts, at least in part, for the fact that while some newcomers die out, others succeed in establishing themselves in the electoral arena.
The findings of this paper carry at least two important implications for the study of party system evolution and parties’ electoral performance. First, beyond other factors already identified in the literature (e.g., ideological distinctiveness, policy response of established parties, costs of government, electoral systems, etc.), parliamentary representation is clearly an important element in understanding the electoral performance of small parties (Meguid Reference Meguid2005; Bolleyer Reference Bolleyer2007; Spoon Reference Spoon2011). Our paper suggests that, apart from legislating, we need to pay more attention to parliamentary perks for parties (media access, increased funding, etc.) to gain a better insight on small party success. While participation in government is likely to be electorally costly for many parties (van Spanje Reference van Spanje2011), this risk does not apply to small parties that enter parliament without forming part of the cabinet.
Second, legal thresholds may facilitate the institutionalization of new party systems (Mainwaring and Torcal Reference Mainwaring and Torcal2006). The fact that these benefits are more pronounced among small parties from new democracies is suggestive that this institutional device may also contribute to consolidating nascent party systems in recently democratized countries. Operating as gatekeepers to parliamentary representation, thresholds generate benefits for parties that surpass them. As these benefits carry into the future, they help small parties within parliament to reinforce their position vis-à-vis other small competitors that cannot enter it and either disappear or remain out of the legislature forever. In this respect, the positive byproducts of parliamentary representation can help institutionalize new party systems by strengthening the position of some particular small parties and creating as a consequence focal points that facilitate the voting decision of citizens (Mair Reference Mair1997; Hug Reference Hug2001).
Even though our investigation has highlighted the importance of parliamentary presence for performance of small parties, several questions still need to be addressed in order to better understand the workings of this relationship. Future research should test the several possible mechanisms at work, as well as evaluate the effects of the threshold size. Moreover, it would be important to understand whether parliamentary benefits vary across other kinds of modifying factors. Is there a heterogeneous effect depending on the policy focus parties? Do contextual variables such as the number of parties or the competitiveness of the elections play a role? We hope that our article will spur the interest necessary to address some of these questions and improve our understanding of how parliaments affect the fates of small parties.
Acknowledgement
We would like to thank Faisal Ahmed, Michael Becher, Eline de Rooij, Philipp Rehm, Adam Ziegfeld, and two anonymous reviewers for their valuable comments and suggestions.