


INTRODUCTION
The potential threat of pandemic influenza is re-emerging: severe influenza infections develop in 3–5 million people annually and 250 000–500 000 deaths occur worldwide [1]; of those about 20% of children and 5% of adults develop symptomatic influenza A or B each year [Reference Turner2]. Pandemic influenza spreads rapidly; easy reassortment and re-circulation of the virus means that pandemic influenza has high attack rates and kills millions of people worldwide. Recent outbreaks of highly pathogenic avian influenza in Asia and associated human infections have led to a heightened level of awareness and preparation for the possibility of pandemic influenza [Reference Luke and Subbarao3].
Population-aggregated level in target sites such as school, household, workplace and hospital represent an important role in accelerating the transmission potential of indoor respiratory infections. The fact that that the highest annual rates for influenza occur in children suggests that schoolchildren are central to the spread of influenza within the community [Reference Emanuel and Wertheimer4]. Given the importance of children in the transmission of influenza [Reference Brownstein, Kleinman and Mandl5], school contact and family transmission indeed contribute to the high potential for spreading pandemic influenza. The potential mobility of people and frequency and length of time of school contact has amplified the potential for disease to be transmitted to schoolchildren. There is little research that has elucidated the transmission potential among schoolchildren through their daily school life, although many researchers have highlighted indoor air-quality programmes in schools.
We employed the Wells–Riley mathematical model of indoor respiratory infection [Reference Riley, Murphy and Riley6–Reference Chen, Chang and Liao9] to estimate the exposure concentrations in indoor environments and to estimate the basic reproduction number (R 0) in a shared indoor airspace. Riley et al. [Reference Riley, Murphy and Riley6] developed a Wells–Riley mathematical equation to estimate the probability of airborne transmission of an infectious agent indoors. The key parameter is the quantum generation rate (q) of infectious quanta by an infected person. The q value was defined by Wells [Reference Wells10] who conducted a series of experiments to estimate the response and reaction to inhaled infectious droplets, indicating that a quantum (or infectious dose) can infect 63·2% of susceptibles tested. Hence, exposure to one quantum of infection gives an average probability of 63% of becoming infected [Reference Wells10]. The R 0 value is the key epidemiological determinant that characterizes the transmission potential of a disease, which is defined as the average number of successful secondary infection cases generated by a typical primary infected case in an entirely susceptible population [Reference Anderson and May11]. R 0 essentially determines the rate of spread of an epidemic and how intensive a policy will need to be to control the epidemic. R 0>1 implies that the epidemic is spreading within a population and that incidence is increasing, whereas R 0<1 means that the disease is dying out. An average R 0=1 means the disease is in endemic equilibrium within the population.
We adopted a susceptible–exposed–infected–recovery (SEIR) model to quantitatively explain the dynamics of an epidemic. The susceptible (S) group is made up of healthy individuals who are available hosts for a disease and are assumed to have no prior immunity. The exposed (E) group represents a latent period in the model or expresses those that are infected but not yet infectious. The infected (I) group is made up of hosts that carry the disease. The removed (R) group is made up of individuals that have either recovered from the disease or gained immunity, individuals that have been quarantined, or individuals that have died from the disease. Pandemic influenza characteristics are adapted from the historical experimental value to explicate the SEIR model. Noakes et al. [Reference Noakes12] have also linked the Wells–Riley equation and SEIR model in order to model airborne infection transmission in indoor environments. These approaches provide a predictive ability to describe the potential transmission dynamics in an indoor environment.
Evidence from community trials suggests that mass vaccination of children can be effective in reducing influenza transmission in the entire community [Reference Reichert13–Reference Jordan16]. Evidence based on systematic reviews of the effectiveness of vaccinating healthy children also suggests that vaccinating healthy children against influenza has the potential for reducing the impact of influenza epidemics [Reference Ghendon, Kaira and Elshina15]. The Japanese national strategy from 1962 to 1987 was to vaccinate schoolchildren to control epidemic influenza. About 80% of Japanese schoolchildren received an inactivated influenza vaccine annually [Reference Reichert13]. Piedra et al. [Reference Piedra14] also indicated that vaccination of about 20–25% of children in the intervention communities resulted in an 8–18% indirect reduction of medically attended acute respiratory illness events in adults aged >35 years for the influenza seasons 1997–2001. Hence, it is clear that an influenza vaccination strategy targeting schoolchildren plays an important role in the eradication of an epidemic.
In this paper, we propose an integrated-level mathematical model, incorporating both the Wells–Riley mathematical model and the SEIR model, to quantify the potential spread of pandemic influenza in an elementary school with a kindergarten. Furthermore, modelling the impact of the indoor air-based control measures of the combination of the potential engineering controls and public health interventions is also presented. The objectives of the present study focus on: (1) estimating the risk profiling in various hypothetical scenarios of exposure to pandemic influenza in the school setting, and (2) modelling the optimal control strategies and estimating the impact of the combination of measures in containing influenza.
MATERIALS AND METHODS
Study population
The study, conducted at the Ming-Chuan elementary school located in southern Taipei city, modelled the transmission potential levels in classrooms. A total of 494 students included 60 kindergarten and 434 elementary students housed in four buildings. The school has two kindergarten classes and 19 elementary classes with grades from 1 to 6. The average number of students in each class are 30, 23, 26, and 30 for 1st–2nd, 3rd–4th, 5th–6th grades, and kindergarten class, respectively; within those classes schoolchildren are classified into four age groups: kindergarten (aged 4–6 years), elementary students (7–8, 9–10, and 11–12 years), while teaching and administrative staff aged 25–45 years are also included.
Risks for indoor airborne infection for the five age groups include different indoor environmental ventilation, exposure time, and population size. In the space condition, there are four mechanical fans mounted in each elementary classroom, whereas the kindergarten classrooms are equipped with an air-conditioning system. Because of the teaching requirements and needs, kindergarten classrooms always have a partition that opens to connect with the next classroom forming a larger space for group activities. Hence, we consider the kindergarten as an enclosed space with a ventilation system that differs from the natural forced combined ventilation performance of a general elementary classroom.
Regarding duration of exposure, each class has lasts for 40 min with 5–10 min recess time. Total exposure times in classroom are about 0·28, 0·25, and 0·11 days for kindergarten students, elementary students, and teaching and administrative staff, respectively (Table 1).
Input parameters used in Wells–Riley mathematical equation to estimate the basic reproduction number (R0) for five age groups 4–6, 7–8, 9–10, 11–12 and 25–45 years in an elementary school

* Adopted from Construction and Planning Agency, Ministry of Interior, ROC [36].
† Adopted from ICRP [19].
‡ Adopted from Chen et al. [Reference Chen, Chang and Liao9].
§ Assuming that the air-exchange rate in classrooms are 0·2 and 0·5 ACH for kindergarten classrooms and other ventilation space, respectively.
Wells–Riley mathematical equation
Riley et al. [Reference Riley, Murphy and Riley6] made two salient assumptions of well-mixed airspaces and steady-state conditions to initiate the well-known Wells–Riley equation that quantifies indoor respiratory infections. The first assumption implies that an infectious droplet nucleus has an equal chance of being anywhere within a building's airspace, regardless of when and where the infectious particle was generated, whereas the second assumption implies that the quantum concentration and the outdoor air-supply rate remain constant with time. We modify the Wells–Riley mathematical equation [Reference Riley, Murphy and Riley6, Reference Wells10] to estimate the transmission potential of pandemic influenza:
![P \equals {D \over {\rm S}} \equals 1 \minus {\rm exp}\left\{ \!\!{ \minus {{{\rm I}qpt} \over Q}\left\{ \!{1 \minus {V \over {Qt}}\left[ \!{1 \minus {\rm exp}\left( \!\!{ \minus {{Qt} \over V}} \right)} \right]} \!\right\}} \!\right\}\!\comma](https://static.cambridge.org/binary/version/id/urn:cambridge.org:id:binary:20151016082026081-0483:S0950268807009284_eqn1.gif?pub-status=live)
where P is the probability of infection for a susceptible population, D is the number of cases susceptible to the infection, S is the number of susceptibles, I is the number of sources of infection, q is the quantum generation rate by an infected person (quanta/d), p is the breathing rate per person (m3/d), t is the time of exposure per unit of time (days), Q is the fresh air supply rate (m3/d) that removes the infectious aerosol in volume per unit of time, and V is the volume of ventilated space (m3). To model the respiratory infection, we incorporate an initial I=1 and S=n−1 into equation (1) to estimate R 0 for five age groups 4–6, 7–8, 9–10, 11–12 and 25–45 years at an elementary school, where n represents the total number in a ventilated airspace
![\eqalign{ R_{\setnum{0}} \equals \tab \lpar n \minus 1\rpar \cr \tab \hskip -10pt \times \left\{ {1 \minus {\rm exp}} \left\{\! { \minus {{qpt} \over Q}\left[ {1 \minus {V \over {Qt}}} \right.\left. {\left. {\left. {\left( {1 \minus {\rm exp}\left( { \minus {{Qt} \over V}} \right)} \right)} \right]} \right\}} \right\}} \right.. \cr}](https://static.cambridge.org/binary/version/id/urn:cambridge.org:id:binary:20151016082026081-0483:S0950268807009284_eqn2.gif?pub-status=live)
The age-specific R 0 value among schoolchildren can be estimated by taking into account indoor environmental ventilation, number of students, and quantum generation rate by infectious persons, to describe the risk in specific space.
The epidemiological model
The SEIR model can provide a basic description of the transmission dynamics of pandemic influenza by using a simple parameterized set of ordinary differential equations. The susceptible population is increased by the net inflow of individuals into the region and is decreased by natural death in that the susceptible population also decreases following infection, acquired by contact between a susceptible and an infected individual (Fig. 1),
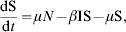
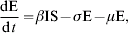



where N(t), S(t), E(t), I(t), and R(t) are the number of total population, susceptible, exposed, infected, and recovered at time t, respectively, σ is the rate at which an exposed individual becomes infectious per unit of time that is equal to 0·333/day (1/mean incubation periods of 7 days). υ is the rate at which an infectious individual recovers per unit of time (per day), μ is the birth rate and death rate that is equal to 0·013/year, and β is the transmission coefficient representing the probability that an infected individual will have contact with and successfully infect a susceptible individual. Here we intended to employ the present SEIR structure to relate the Wells–Riley mathematical equation to the transmission coefficient to implicate the relationship between the infectiousness of pandemic influenza and contact rates as [Reference Anderson and May11]:

where R 0 can be estimated from the Wells–Riley mathematical equation in equation (2).
Pandemic influenza modelling where we consider the transmission dynamics of the following population: susceptible (S), exposed (E), infected (I), and recovery (R). (See text for detailed description of symbols.)

Control measures
To prevent respiratory infectious disease, methods are assigned to several areas including antivirus, vaccine, and non-vaccine interventions such as personal measures, administrative controls, and engineering controls [Reference Lee17]. Considering the realistic possibility of an emerging infectious agent, such as a novel influenza strain, population-based studies of masking must be seriously considered. We further estimate the impact of three control measures on decreasing R 0; (i) respiratory masking to avoid distributing the quantum level to other susceptibles in the classroom; (ii) enhanced ventilation to remove and decrease the quantum level generating from infectious individuals; (iii) a vaccination programme enhancing the immune system's ability to defend against an attacking virus.
First, we consider respiratory masking to reduce the q value with 60%, 70%, 80%, and 95% efficacies; similarly, we also model the enhanced ventilation to 0·5, 1, 1·5, and 2 ACH/h based on the Construction and Planning Agency, Ministry of Interior, ROC, at the elementary indoor environment followed by employment of the Wells–Riley mathematical equation on modelling the reducing level of R 0. Furthermore, we model the impact of control measures to decrease R 0 with a vaccination programme with different vaccination coverage rates as [Reference Scherer and McLean18]

where R 0p is the R 0 under vaccination and p is the vaccination coverage rate of the population who have been vaccinated by modelling 65%, 70%, 80% and 90%. We proposed the vaccination efficacy was 100% changed with the fitted level of epidemic strain and vaccination strain, and country, and differs with adults, children, and older age groups.
RESULTS
Parameter estimates for the Wells–Riley mathematical equation
Table 1 gives the essential input parameters used to estimate R 0 values based on the Wells–Riley equation. The indoor environment condition such as the volume of the shared airspace is adopted from the standard of the Construction and Planning Agency, Ministry of Interior, ROC, whereas the breathing rate considers the awake condition varied among different age groups [19]. The other parameters such as number of people in ventilated airspace and total exposure time follow the real course periods. We assumed that the quantum generation rate for 25–45 years is half (q=824 quanta/d) of that for 4–6 years (q=1648 quanta/d), because children shed greater quantities of influenza viruses than adults [Reference Fox20]. We also assumed that the ventilated airspace of kindergarten classrooms is 972 m3, because of the teaching requirement, the ventilated airspace is enlarged by fourfold based on a normal size of classroom of 243 m3. Hence, we consider the kindergarten classroom is equipped with an air-conditioning ventilation system with 0·2 ACH, whereas the natural forced combined ventilation provides 0·5 ACH for a normal elementary classroom.
We estimated the probabilities of infection (P) and basic reproduction number (R 0) derived from Wells–Riley mathematical equations [equations (1) and (2)], respectively, based on the environmental factor data for Ming-Chuan elementary school. The results of age-specific P and R 0 are estimated to be 0·29 and 16·90; 0·56 and 16·11; 0·59 and 12·88; 0·64 and 16·09; 0·07 and 2·80 for age groups 4–6, 7–8, 9–10, 11–12, and 25–45 years, respectively (Table 1). Our analysis indicates that kindergarten students have the highest transmission potential level (R 0=16·90) of all age groups, although the probability of infection for the susceptible population (P=0·29) is lower than that of others (Table 1).
Respiratory masking and ventilation efficacy on basic reproduction number
We could reduce the R 0 value from no control scenario by incorporating control measures such as respiratory protection by respiratory masking and enhanced ventilation by the Wells–Riley mathematical equation. We employed the 60%, 70%, 80%, and 95% efficacies, respectively, for respiratory masking to directly reduce virus shedding to the indoor environment (Fig. 2a). We also employed 0·5, 1·0, 1·5, and 2·0 ACH, respectively, to reduce R 0 by removing the influenza burden (Fig. 2b). The R 0 estimates are 16·90, 7·45, 5·68, 3·85, and 0·99 for 0%, 60%, 70%, 80%, and 95% respiratory masking efficacies, whereas the R 0 values are respectively estimated to be 11·38, 7·10, 5·10, and 3·97 for enhanced 0·5, 1, 1·5, and 2 ACH, respectively, among kindergarten students. Similarly, this represents the effects on decreasing R 0 by the increased ACH level based on the individual initial ACH (Fig. 2c). If the increased ACH levels reach 8 ACH, then R 0 will be <1 under the initial ACH range from 0·2 to 1. Here the results show that ACH can truly decrease R 0, however, in reality, the increased ACH must be sufficiently high in order to eradicate transmission spreading.
(a) The effects of respiratory masking with 60%, 70%, 80%, and 95% efficacy for an infectious person at an elementary school population with different age groups 4–6, 7–8, 9–10, 11–12, and 25–45 years. (b) The effects of enhancing the ventilation condition (enhanced ACH) with 0·5, 1·0, 1·5, and 2·0 ACH for decreasing R 0. (c) Modelling the impact on R 0 by enhancing ACH based on the different initial ventilation conditions with 0·2, 0·5, and 1·0 ACH, respectively.

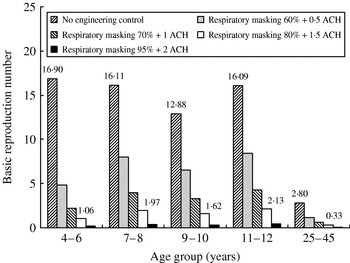
We further investigated the control measures of combinations of respiratory masking and ventilation enhancement in containing epidemic growth of influenza within the elementary school. If we apply effective 80% respiratory masking and 1·5 ACH in all indoor environments, the resulting R 0 estimates are 1·1, 2·0, 1·6, 2·1, and 0·3 for age groups 4–6, 7–8, 9–10, 11–12, and 25–45 years, respectively (Fig. 3). These results indicates that the control measures are not enough to contain the disease-spreading potential among schoolchildren, because the R 0 value is still >1.
Modelling the impact of the combination of respiratory masking and enhanced ventilation condition on R 0 for age groups 4–6, 7–8, 9–10, 11–12, and 25–45 years.
Modelling vaccination efficacy on infected numbers
The dynamic of infected numbers reflects the different patterns varying with the input value of transmission probability that is calculated by equations (3)–(8) based on the model parameters listed in Table 2 (see also Fig. 4a). The proportions of time-dependent infected number/total number show the probable patterns in four age groups 4–6, 7–8, 9–10, and 11–12 years (Fig. 4b). We further investigated the dynamic behaviour of infected numbers by different vaccination coverage rates of 0%, 65%, 70%, 80%, and 90% for age groups 4–6, 7–8, 9–10, 11–12, and 25–45 years. The results indicate that forelementary students, if we apply a vaccination coverage rate >70%, almost <1 will be infected, whereas the pandemic influenza will be contained rapidly when a 90% vaccination coverage rate is applied (Fig. 5).
Modelling the progress of a 30-day influenza outbreak at an elementary school with a kindergarten. (a) We also represent the proportions of time-dependent infected number/total number because the population size is different between age groups. (b) Time-dependent infected number was estimated by the SEIR model. Parameter values: β=0·043, 0·082, 0·086, 0·094, and 0·011 for age groups 4–6, 7–8, 9–10, 11–12, and 25–45 years, respectively.

The prediction for the transmission pattern of infected number and intervention by different vaccination with 0%, 65%, 70%, 80%, and 90% efficacies, respectively for (a) 4–6, (b) 7–8, (c) 9–10, (d) 11–12, and (e) 25–45 years.

Parameters of the SEIR model, their interpretations and numerical values

Multiple control measure effects
We further investigated the efficacy of some combinations of engineering control measures with public health interventions in containing epidemic growth of pandemic influenza. In particular, we combined 80% vaccination coverage rate, 80% respiratory masking efficacy with enhanced 1·5 ACH to simulate the impact of control measures, indicating that multiple control measures provide a greater impact on reducing the infected numbers for the 4–6 years age group (Fig. 6). For a single control measure, the 80% vaccination coverage rate has a greater impact than those of 1·5 ACH and 80% respiratory masking, whereas for multiple control measures, all specific combinations can successfully contain the pandemic influenza (Fig. 6b).
Impact of multiple measures on infected numbers in the 4–6 years age group. Control measures consider the situation without intervention and five integrated control methods including 80% vaccination coverage rate, 80% respiratory masking efficacy, and enhanced 1·5 ACH.

DISCUSSION
SEIR model strength
The SEIR-based model is a popular transmission model for modelling infectious diseases such as SARS [Reference Gumel21–Reference Riley23], measles, rubella or mumps [Reference Hethcote24], and drug-resistant influenza [Reference Ferguson25]. Most compartments are chosen because of the natural history of the disease, and the critical control interventions such as the quantity periods, vaccination efficacy, and isolated efficacy. In this paper, the SEIR model may transform to the VSEIJR structure by adding two extra compartments (‘V’ and ‘J’) which respectively represent a vaccination initiating and isolating the infectious syndrome on the influenza outbreak (Fig. 7),


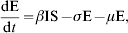
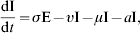
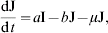
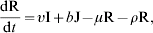

where e is the fraction of vaccinated population protected by the vaccine, p 1 and p 2 are the vaccination coverage rate at birth, and at the outbreak periods, respectively, ρ is the fraction of annual routinely vaccinated population, ω is the rate of loss of vaccine-induced immunity, a is the fraction of infected population to be isolated, and b is the fraction of isolated population to be recovered. The transmission parameters are a sensitivity factor to the modelling results. If we can estimate the appropriate parameter values using the experience data, the VSEIJR model will be able to provide more detailed knowledge to enhance control strategies.
Modelling the control measures such as the vaccination at birth, vaccination at influenza epidemic season, and infected student to be isolated at home. Vaccination coverage rates p 1 and p 2 are newly born individuals that are vaccinated at birth and individuals that are vaccinated in the influenza epidemic season. Infectious individuals recover at rate υ to become immune, and the vaccination loss rate ρ is assumed to be 4–5 months. (See text for detailed description of symbols.)

Uncertainty and sensitivity of estimated parameters
Parameter estimates always exist with uncertainty or variability. Chowell et al. [Reference Chowell26] also used uncertainty and sensitivity analysis of R 0 to assess the role that model parameters play in outbreak control. They used a Monte Carlo technique to quantify the uncertainty of R 0 to model parameters when these parameters are distributed. Smith [Reference Smith27] also points out that mathematical models can derive estimates for the levels of drug stockpiles needed to buy time, how and when to modify vaccines, whom to target with vaccines and drugs, and when to enforce quarantine measures. Owing to lack of real environmental ventilation information, we assumed that the ventilated airspace of kindergarten and elementary classrooms were equipped with a mechanical/natural ventilation condition. Dilution of ventilation of the indoor environment is an important determinant of the risk for infection. In future studies, we may carry out an uncertainty analysis on R 0 to assess the variability in R 0 that results from the uncertainty in the model parameters.
Estimates of the incubation, latent, and infectious periods are respectively 1–4, 1–3, and 4–8 days for influenza [Reference Anderson and May11]. Mills et al. [Reference Mills, Robins and Lipsitch28] indicated that the mean latent and infectious periods are estimated as 1·9 and 4·1 days, respectively, based on viral shedding data [Reference Nicholson, Wevster and Jay29, Reference Longini30]. It is important to be aware of potential inaccuracies and parameter sensitivities when interpreting their results and to assess the accuracy of the models. Nevertheless, experimental epidemiological studies, such as the vaccination of schoolchildren, or those having contact with family units, provide core information for model design and parameterization, and for model testing.
Public health intervention
Given the importance of children in the transmission of pandemic influenza, school closure is likely to be an effective social distancing policy [31]. The effectiveness data on school closures has been limited until now. Apparently no data or analyses exist for recommending illness thresholds or rates of change that should lead to considering closing or reopening schools.
On a small island in the United States in 1920, the single public school was a focal point for the spread of influenza, and a report from that period concluded that prompt closure of the school would probably not have prevented the epidemic, but might have delayed it [Reference Armstrong and Hopkins32]. School closure might be less effective in some urban areas than in rural areas because urban children can more easily meet elsewhere [Reference Jorden33]. In future work, we may consider the influenza characteristics including the shorter serial interval and earlier peak infectivity, plus the presence of mild cases and the possibility of transmission without symptoms to model school closure and to estimate the closure threshold, such as a proportion of total infectious individuals to the population or other indicators.
Implications
In Taiwan, we have initiated an influenza vaccination programme by the Department of Health in October 1998 focusing on the ‘high-risk groups’ including infants aged 6–24 months, hospital health-care workers (nurses and students), seniors (aged ⩾65 years), and related workers who have potential contact with avian animals [Reference Wang, Wang and Chou34, Reference Wang35]. In practice, related research and information for schoolchildren have been relatively scarce until now. We hope that the mathematical model can combine with the current condition to provide a useful pattern of pandemic influenza in disease outbreaks. A population-based dynamic transmission model may further help in considering the daily activities of students inside and outside classrooms, e.g. cleaning or recess times. The interaction will enhance the contact rate of infectious and susceptible individuals. Class-to-class and floor-to-floor transmissions are also interesting topics to study in the transmission process.
In summary, we have incorporated an integrated-level model including the Wells–Riley mathematical model and population-based SEIR model of indoor respiratory infection that are applicable to estimate the risk of infection of pandemic influenza, and to quantify risk profiles associated with the control strategies including respiratory masking, enhanced ACH, associated with public health intervention of vaccination in schoolchildren. This mathematical model can offer an initiative applicable to a real elementary school to predict the optimal control measures and to protect susceptible students from infection by infected students. Further investigations may focus on the variations in contact structure, e.g. classroom indoor environment, size variations within geographic regions, grade level, parents staying at home with sick children, and other venues and mechanisms for transmission to guide integrated disease control programmes within an elementary school.
DECLARATION OF INTEREST
None.



