


1. Introduction
This paper develops a statistical theory for the impact of a turbulent flow on the propagation of inertia-gravity waves (IGWs). It is motivated, broadly, by the importance of IGWs for the circulation of both the atmosphere and ocean and, specifically, by two strands of research. The first centres on the interpretation of velocity spectra inferred from observations, specifically the shallow spectra observed at mesoscales in the atmosphere (horizontal scales below 500 km) and at submesoscales in the ocean (horizontal scales below 100 km), which are interpreted as power laws with exponent  ${-5/3}$ in the atmosphere (Nastrom & Gage Reference Nastrom and Gage1985) and ${-2}$ in the ocean (e.g. Callies & Ferrari Reference Callies and Ferrari2013). Recent analyses of observational (Callies, Ferrari & Bühler Reference Callies, Ferrari and Bühler2014; Bühler, Callies & Ferrari Reference Bühler, Callies and Ferrari2014; Callies, Bühler & Ferrari Reference Callies, Bühler and Ferrari2016; Rocha et al. Reference Rocha, Chereskin, Gille and Menemenlis2016; Bühler, Kuang & Tabak Reference Bühler, Kuang and Tabak2017) and simulation (Qiu et al. Reference Qiu, Chen, Klein, Wang, Torres, Fu and Menemenlis2018; Torres et al. Reference Torres, Klein, Menemenlis, Qiu, Su, Wang, Chen and Fu2018) data suggest that IGWs dominate over the quasigeostrophic flow at these scales. While this remains controversial (Asselin, Bartello & Straub Reference Asselin, Bartello and Straub2018; Kafiabad & Bartello Reference Kafiabad and Bartello2018; Li & Lindborg Reference Li and Lindborg2018), the possibility that IGWs control the spectra at horizontal scales much larger than previously thought raises basic questions about the processes that control the distribution of their energy.
One key process is the advection and refraction of IGWs by the typically highly energetic quasigeostrophic flow. This process causes the rapid scattering of the IGW energy, leading to a decrease of the wave scales and to an approximately isotropic wave field. This illustrated in figure 1(a–d), which shows the vertical velocity in a numerical simulation of an initially plane IGW scattered by a turbulent geostrophic flow (see § 4 for details). The present paper gives a full description of this form of scattering. We achieve this by applying powerful techniques of the theory of waves in random media (Ryzhik, Papanicolaou & Keller Reference Ryzhik, Papanicolaou and Keller1996; Powell & Vanneste Reference Powell and Vanneste2005; Bal, Komorowski & Ryzhik Reference Bal, Komorowski and Ryzhik2010) to obtain a kinetic equation governing the evolution of the IGW energy density, denoted by  $a({\boldsymbol {x}},{\boldsymbol {k}},t)$, in the position–wavenumber $({\boldsymbol {x}},{\boldsymbol {k}})$ phase space. The main assumption is that the quasigeostrophic flow can be represented as a space- and time-dependent, homogeneous and stationary random field with known statistics.
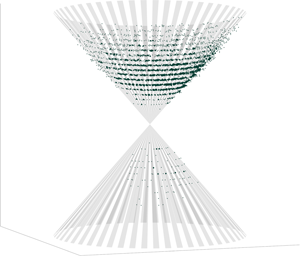
Scattering of a plane IGW by a turbulent geostrophic flow: vertical velocity field for  $z=0$ (a–d), and representation of the energy distribution in ${\boldsymbol {k}}$-space at four successive times (e–g). In panels (e–h), the constant-frequency cone associated with the plane IGW is shown by the stripes; small-, medium- and large-sized dots indicate IGW energy density exceeding, respectively, 0.004 %, 0.02 % and 0.2 % of the initial IGW energy. The geostrophic flow has a velocity-based Rossby number ${Ro} = 0.025$ and the ratio of the initial IGW horizontal wavenumber to the geostrophic-flow peak wavenumber is $k_{h*}/K_{h*} \simeq 4$ (see § 4 for details).

We obtained partial results in this direction in a previous paper (Kafiabad, Savva & Vanneste Reference Kafiabad, Savva and Vanneste2019) which focuses on the WKBJ regime, where the IGW scales are asymptotically smaller than the flow scale (see Müller (Reference Müller1976, Reference Müller1977), Watson (Reference Watson1985) and Müller et al. (Reference Müller, Holloway, Henyey and Pomphrey1986) for earlier work). In that case, the Doppler shift of the IGW frequency resulting from advection by the flow is the sole mechanism of scattering and it acts as a diffusion in  ${\boldsymbol {k}}$-space. A remarkable prediction in this diffusive regime is that the energy spectrum of forced IGWs equilibrates to a $k^{-2}$ power law for scales smaller than the forcing scale, similar to the spectra observed in the atmosphere and ocean. The present paper extends the WKBJ results by relaxing the assumption of separation between wave and flow scales, treating the distinguished limit when both are similar. The scattering is then described by an integral operator which reduces to a diffusion only in the WKBJ limit. Earlier work by Danioux & Vanneste (Reference Danioux and Vanneste2016) and Savva & Vanneste (Reference Savva and Vanneste2018) derived and studied the scattering operator relevant to, respectively, near-inertial waves and IGWs under the restriction of a barotropic ( $z$-independent) quasigeostrophic flow. The results we obtain for fully three-dimensional flows are markedly different because vertical shear leads to a cascade of IGWs to small scales that is absent for barotropic flows.
The second strand of research motivating this paper is concerned with fundamental aspects of turbulence in rotating stratified flows and specifically with their analysis in terms of triadic interactions. The interactions between two IGW modes and a geostrophic (or vortical) mode have been examined by Warn (Reference Warn1986), Lelong & Riley (Reference Lelong and Riley1991), Bartello (Reference Bartello1995) and more recently by Ward & Dewar (Reference Ward and Dewar2010) (see Wagner, Ferrando & Young (Reference Wagner, Ferrando and Young2017) for an alternative treatment allowing for non-constant stratification). These interactions are often termed ‘catalytic’ because they leave the geostrophic mode unaffected, a property that stems from potential-vorticity conservation. Our results provide a statistical description of precisely those catalytic interactions, with detailed predictions for the IGW spectrum that emerges in both initial-value and forced scenarios. A key aspect is that we confine our predictions to the statistics of the IGWs, regarding the statistics of the geostrophic modes as given. This is natural: because the feedback of the IGWs on the geostrophic flow is weak, as the catalytic nature of the wave–flow interactions implies, the flow is to a good approximation independent of the IGWs, obeying quasigeostrophic dynamics. (The feedback of IGWs on the geostrophic flow is captured by the theory of wave–mean flow interactions, in particular the generalised Lagrangian mean theory of Andrews & McIntyre (Reference Andrews and McIntyre1978); see also Bühler (Reference Bühler2014), Wagner & Young (Reference Wagner and Young2015), Gilbert & Vanneste (Reference Gilbert and Vanneste2018) and Kafiabad, Vanneste & Young (Reference Kafiabad, Vanneste and Young2021).) We note that the kinetic equation that we derive is closely related to the kinetic equations of wave (or weak) turbulence theory (e.g. Nazarenko Reference Nazarenko2011): the integral terms with quadratic nonlinearity obtained in wave turbulence for triadic interactions simplify to linear integrals when the amplitudes of one type of modes – here the geostrophic modes – remains fixed as we assume. Wave-turbulence theory provides a useful description of the interactions between IGWs but usually ignores the effect of the quasigeostrophic flow (e.g. Lvov, Polzin & Yokoyama (Reference Lvov, Polzin and Yokoyama2012) and references therein). Recently Eden, Chouksey & Olbers (Reference Eden, Chouksey and Olbers2019) have derived kinetic equations governing the weakly nonlinear interactions between IGWs and between IGWs and geostrophic modes (or Rossby waves when the  $\beta$-effect is taken into account) in the primitive equations. The latter interactions are those on which we focus and we expect our results could be deduced from theirs under the assumption of spatial homogeneity, ${\boldsymbol {\nabla }}_{{\boldsymbol {x}}}a = 0$ and hydrostatic approximation.
As emphasised above, the statistical theory that we develop makes no assumption of spatial scale separation between IGWs and the quasigeostrophic flow. As a result, its central object, namely the phase-space energy density  $a({\boldsymbol {x}},{\boldsymbol {k}},t)$, cannot be defined using a straightforward ray-tracing, WKBJ treatment. Instead, we follow Ryzhik et al. (Reference Ryzhik, Papanicolaou and Keller1996) and use the Wigner transform to both define $a({\boldsymbol {x}},{\boldsymbol {k}},t)$ and obtain an equation governing its evolution (see Onuki (Reference Onuki2020) for other applications of the Wigner transform to IGWs). The kinetic equation governing the evolution of $a({\boldsymbol {x}},{\boldsymbol {k}},t)$ is derived in § 2 and Appendix A and takes the form
 \begin{align} \partial_ta({\boldsymbol{x}},{\boldsymbol{k}},t)+{\boldsymbol{\nabla}}_{{\boldsymbol{k}}}\omega({\boldsymbol{k}}) \boldsymbol{\cdot}{\boldsymbol{\nabla}}_{{\boldsymbol{x}}}a({\boldsymbol{x}},{\boldsymbol{k}},t) =\int_{\mathbb{R}^3}\sigma({\boldsymbol{k}},{\boldsymbol{k}}')a({\boldsymbol{x}},{\boldsymbol{k}}',t) \, \mathrm{d}{\boldsymbol{k}}'-\varSigma({\boldsymbol{k}})a({\boldsymbol{x}}, {\boldsymbol{k}},t). \end{align}
Here  $\omega ({\boldsymbol {k}})$ is the IGW dispersion relation, $\sigma ({\boldsymbol {k}},{\boldsymbol {k}}')$ is the scattering cross-section, which fully encodes the impact of the geostrophic flow on IGWs and is given explicitly in (2.22), and $\varSigma ({\boldsymbol {k}}) = \int _{\mathbb {R}^3} \sigma ({\boldsymbol {k}},{\boldsymbol {k}}') \, \mathrm {d} {\boldsymbol {k}}'$.
A key property of  $\sigma ({\boldsymbol {k}},{\boldsymbol {k}}')$ is that it is proportional to $\delta (\omega ({\boldsymbol {k}}) - \omega ({\boldsymbol {k}}') )$. This stems from the slow time dependence of the quasigeostrophic flow and implies that energy transfers between IGWs are restricted to waves with the same frequency. These waves have wavevectors lying on a double cone whose two halves, termed nappes, make angles $\theta =\tan ^{-1} (\omega ^2-f^2)/(N^2-\omega ^2))^{1/2}$ and ${\rm \pi} -\theta$ with the $k_3$-axis ( $\,f$ and $N$ are the inertial and buoyancy frequencies), corresponding to upward- and downward-propagating waves. Figure 1(e–h) illustrates this restriction of the scattering to IGWs with the same frequency. It displays the distribution of IGW energy in wavevector space for the simulation shown on the top row, together with a visualisation of the cone corresponding to the frequency of the initial plane wave. The figure demonstrates how wave energy remains confined to a good approximation near the constant-frequency cone as it spreads in wavenumber space.
In § 3 we reformulate the kinetic equation (1.1) in spherical coordinates  $(k,\theta ,\varphi )$ well suited to the geometry of the constant-frequency cone since $\theta$ can be regarded as a fixed parameter. We then separate the energy density $a({\boldsymbol {x}},{\boldsymbol {k}},t)$ into upward- and downward-propagating components and obtain a pair of coupled kinetic equations governing their evolution. We examine the properties of these equations in some detail in § 3 and show, in particular, how they predict the isotropisation of the IGW field and the equipartition of energy between upward- and downward-propagating IGWs in the long-time limit.
In § 4 we compare the predictions of the kinetic equations with results of high-resolution numerical simulations of the three-dimensional Boussinesq equations for an initial-value problem. We focus on homogeneous and horizontally isotropic configurations, when  $a({\boldsymbol {x}},{\boldsymbol {k}},t)$ is independent of ${\boldsymbol {x}}$ and of the azimuthal angle $\varphi$, and find very good agreement for different IGW frequencies and geostrophic-flow strengths. We briefly discuss the forced problem and confirm that the stationary spectrum that emerges has the $k^{-2}$ power tail behaviour expected from the WKBJ, diffusive approximation of Kafiabad et al. (Reference Kafiabad, Savva and Vanneste2019).
2. Kinetic equation
2.1. Fluid-dynamical model
We model the propagation of IGWs through a turbulent quasigeostrophic eddy field using the inviscid non-hydrostatic Boussinesq equations linearised about a background flow. The background flow depends slowly on time, is in geostrophic and hydrostatic balance and accordingly determined by a stream function  $\psi$. We take $\psi$ to be a random field with homogeneous and stationary statistics. The background flow velocity and buoyancy fields are given by ${\boldsymbol {U}}=(U,V,0)=(-\partial _y\psi ,\partial _x\psi ,0)$ and $B=f\partial _z\psi$, and the linearised Boussinesq equations read
 \begin{gather} {\partial_t{\boldsymbol{u}}}+{\boldsymbol{\nabla}}{\boldsymbol{U}}\boldsymbol{\cdot}{\boldsymbol{u}}+{\boldsymbol{U}}\boldsymbol{\cdot}{\boldsymbol{\nabla}}{\boldsymbol{u}}+f\hat{{\boldsymbol{z}}}\times{\boldsymbol{u}} ={-}{\boldsymbol{\nabla}} p+b\hat{{\boldsymbol{z}}}, \end{gather}
 \begin{gather}{\partial_t b}+{\boldsymbol{u}}\boldsymbol{\cdot}{\boldsymbol{\nabla}} B+{\boldsymbol{U}}\boldsymbol{\cdot}{\boldsymbol{\nabla}} b+N^2w =0, \end{gather}
 \begin{gather}{\boldsymbol{\nabla}}\boldsymbol{\cdot}{\boldsymbol{u}}=0, \end{gather}
where  ${\boldsymbol {u}}=(u,v,w)$ denotes the wave velocity, ${\boldsymbol {\nabla }}=(\partial _x,\partial _y,\partial _z)$ is the full gradient operator, $\hat {{\boldsymbol {z}}}$ is the vertical unit vector, $p$ is the wave pressure normalised by a constant reference density, $b$ the wave buoyancy, $f$ the Coriolis parameter and $N$ the buoyancy frequency which is assumed to be constant with $N > f$. The linearisation adopted for (2.1) requires $|{\boldsymbol {u}}| \ll |{\boldsymbol {U}}|$ and implies the neglect of wave–wave interactions.
Among the five equations in (2.1), only three are prognostic since two of the five dependent variables  $(u,v,w,b,p)$, e.g. $w$ and $p$, can be diagnosed from the remaining three. We make this explicit by reformulating (2.1) using three suitable dependent variables chosen as the linearised ageostrophic vertical vorticity, horizontal divergence and linearised potential vorticity
 \begin{equation} \gamma = f\zeta-{\boldsymbol{\nabla}}_{h}^2 \nabla^{{-}2} \left(\partial_zb-f\zeta\right), \quad \delta=\partial_x u+\partial_y v \quad \text{and} \quad q=f\partial_zb+N^2\zeta, \end{equation}
with  ${\boldsymbol {\nabla }}_{h}=(\partial _x,\partial _y,0)$ and $\zeta = \partial _x v - \partial _y u$, following Vanneste (Reference Vanneste2013). Since the potential vorticity $q$ describes the dynamics of the balanced flow which, in our formulation, is captured by the background flow, we set $q=0$. This reduces the dynamics to the two equations
 \begin{gather} {\partial_t\gamma}+{\varOmega}^2\delta =\mathcal{N}_{\gamma}, \end{gather}
 \begin{gather}{\partial_t \delta}-\gamma =\mathcal{N}_\delta, \end{gather}
where  $\varOmega$ is the pseudodifferential operator
 \begin{equation} \varOmega({\boldsymbol{\nabla}})=[(N^2{\boldsymbol{\nabla}}_{h}^2+f^2\partial_{zz})\nabla^{{-}2}]^{1/2} \end{equation}
and  $\mathcal {N}_\gamma$ and $\mathcal {N}_\delta$ groups the terms depending on the background flow. When these are ignored, the solutions to (2.3) can be written as a superposition of plane IGWs, with wavevectors ${\boldsymbol {k}}=({\boldsymbol {k}}_{h},k_3)$ and frequencies
 \begin{equation} \omega({\boldsymbol{k}})={\pm} \sqrt{N^2{k}_{h}^2+f^2k_3^2}/{|{\boldsymbol{k}}|} , \end{equation}
with  $k_{h} = |{\boldsymbol {k}}_{h}|$.
We now make some scaling assumptions. Our main assumption is that the Rossby number characterising the background flow is small:
 \begin{equation} {Ro} = U_* K_* / f \ll 1, \end{equation}
where  $U_*$ and $K_*^{-1}$ are characteristic velocity and horizontal length scales of the flow. This assumption is consistent with the assumed geostrophic balance. It ensures that advection and refraction of the IGWs by the background flow are weak compared with wave dispersion. We also assume that the background flow evolves on a time scale $({Ro} f)^{-1}$ as is the case for quasigeostrophic dynamics. Crucially we make no assumption of separation of spatial scales and consider instead the distinguished regime where flow and IGWs have horizontal scales that are similar, $k_{h}/K_*=O(1)$.
To make the scaling assumptions explicit while retaining the practical dimensional form of the equations of motion, we introduce a bookkeeping parameter  $\varepsilon \ll 1$ indicating the dependence of the various terms on powers of ${Ro}$. A convenient choice takes $\varepsilon = {Ro}^2$ since it turns out that the temporal and spatial variations of the IGW amplitudes then scale as $(\varepsilon \omega )^{-1}$ and $(\varepsilon K_*)^{-1}$. With this choice we rewrite (2.3) in the compact form
 \begin{equation} \partial_t{\boldsymbol{\phi}}+{\boldsymbol{\mathsf{L}}}({\boldsymbol{\nabla}}){\boldsymbol{\phi }}+\varepsilon^{1/2}{\boldsymbol{\mathsf{N}}}({\boldsymbol{x}},{\boldsymbol{\nabla}},\varepsilon^{1/2}t){\boldsymbol{\phi}}=0, \end{equation}
where
 \begin{equation} {\boldsymbol{\phi}} = \left(\begin{array}{c}\gamma \\ \delta\end{array}\right) \end{equation}
groups the dynamical variables, and
 \begin{equation} {\boldsymbol{\mathsf{L}}}({\boldsymbol{\nabla}})=\left(\begin{array}{cc} 0 & \varOmega^2\\ -1 & 0 \end{array}\right). \end{equation}
The (matrix) linear operator  ${\boldsymbol{\mathsf{N}}}$ collects the background-flow terms. It depends on ${\boldsymbol {x}}$ and $\varepsilon ^{1/2} t$ through the stream function $\psi$ and is given explicitly as (A1) in Appendix A. We next exploit the smallness of $\varepsilon$ to derive a kinetic equation governing the slow energy exchanges among IGWs resulting from interactions with the background flow.
2.2. Derivation of the kinetic equation
We start by rescaling space and time according to  $({\boldsymbol {x}},t) \mapsto ({\boldsymbol {x}}/\varepsilon ,t/\varepsilon )$ so that ${\boldsymbol {x}}$ and $t$ capture the slow variations of the IGW amplitudes; the IGW phases then vary with ${\boldsymbol {x}}/\varepsilon$ and $t/\varepsilon$, and the background flow with ${\boldsymbol {x}}/\varepsilon$ and $t/\sqrt {\varepsilon }$. The rescaling transforms (2.7) into
 \begin{equation} \varepsilon\partial_t{\boldsymbol{\phi}}+{\boldsymbol{\mathsf{L}}}(\varepsilon{\boldsymbol{\nabla}}) {\boldsymbol{\phi}}+\varepsilon^{1/2}{\boldsymbol{\mathsf{N}}}({{\boldsymbol{x}}}/{\varepsilon},\varepsilon{\boldsymbol{\nabla}},{t}/{\varepsilon^{1/2}}){\boldsymbol{\phi}}=0. \end{equation}
 A key ingredient for the systematic derivation of the kinetic equation is the definition of a phase-space energy (or action) density  $a({\boldsymbol {x}},{\boldsymbol {k}},t)$ that does not rest on the WKBJ approximation. The separation between spatial and wavenumber information required for a phase-space description of the waves is achieved by means of the (scaled) Wigner transform of ${\boldsymbol {\phi }}$ defined as the $2 \times 2$ matrix
 \begin{equation} \boldsymbol{\mathsf{W}} ({\boldsymbol{x}},{\boldsymbol{k}},t)= \frac{1}{(2{\rm \pi})^3} \int_{\mathbb{R}^3}\mathrm{e}^{\mathrm{i} {\boldsymbol{k}}\boldsymbol{\cdot}{\boldsymbol{y}}}{\boldsymbol{\phi}}({\boldsymbol{x}}-\varepsilon{{\boldsymbol{y}}}/{2},t){\boldsymbol{\phi}}^\mathrm{T}({\boldsymbol{x}}+\varepsilon{{\boldsymbol{y}}}/{2},t) \, {\mathrm{d}{\boldsymbol{y}}}, \end{equation}
where  $\mathrm {T}$ denotes the transpose. In Appendix A we derive an evolution equation for $\boldsymbol{\mathsf{W}}$ which we simplify using multiscale asymptotics. The derivation starts with the expansion
 \begin{equation} \boldsymbol{\mathsf{W}}=\boldsymbol{\mathsf{W}}^{(0)}({\boldsymbol{x}},{\boldsymbol{k}},t)+\varepsilon^{1/2}\boldsymbol{\mathsf{W}}^{(1)}({\boldsymbol{x}},\boldsymbol\xi,{\boldsymbol{k}},t,\tau)+\varepsilon \boldsymbol{\mathsf{W}}^{(2)}({\boldsymbol{x}},\boldsymbol\xi,{\boldsymbol{k}},t,\tau)+{O}(\varepsilon^{3/2}), \end{equation}
where  ${\boldsymbol {\xi }} = {\boldsymbol {x}}/\varepsilon$ and $\tau =t/\varepsilon ^{1/2}$ are treated as independent of ${\boldsymbol {x}}$ and $t$. The leading-order equation obtained is
 \begin{equation} {\boldsymbol{\mathsf{L}}}(\mathrm{i}{\boldsymbol{k}})\boldsymbol{\mathsf{W}}^{(0)} + \mathrm{c.c.} = 0, \end{equation}
where, from (2.9),
 \begin{equation} {\boldsymbol{\mathsf{L}}}(\mathrm{i}{\boldsymbol{k}})=\left(\begin{array}{cc} 0 & \omega^2({\boldsymbol{k}}) \\ -1 & 0 \end{array}\right), \end{equation}
with  $\omega ({\boldsymbol {k}})$ the IGW frequency given by (2.5). This matrix has eigenvalues ${\pm }\mathrm {i} \omega ({\boldsymbol {k}})$ and eigenvectors ${\boldsymbol {e}}_\pm$ solving
 \begin{equation} {\boldsymbol{\mathsf{L}}}(\mathrm{i} {\boldsymbol{k}}){\boldsymbol{e}}_\pm({\boldsymbol{k}})={\pm}\mathrm{i}\omega({\boldsymbol{k}}){\boldsymbol{e}}_\pm({\boldsymbol{k}}), \end{equation}
where we choose  $\omega ({\boldsymbol {k}})>0$ by convention. The eigenvectors encode the polarisation relations of IGWs. They can be written as
 \begin{equation} {\boldsymbol{e}}_\pm({\boldsymbol{k}})=\frac{|{\boldsymbol{k}}_{h}||k_3|}{\sqrt{2}\,|{\boldsymbol{k}}|}\left(\begin{array}{c} \pm\mathrm{i}\omega({\boldsymbol{k}}) \\ -1 \end{array}\right)\end{equation}
and are orthonormal with respect to a weighted inner-product, specifically
 \begin{equation} \left\langle{{\boldsymbol{e}}_{i}({\boldsymbol{k}}), {\boldsymbol{e}}_{j}({\boldsymbol{k}})}\right\rangle_{\boldsymbol{\mathsf{M}}}={\boldsymbol{e}}_{i}^*({\boldsymbol{k}}){\boldsymbol{\mathsf{M}}}{\boldsymbol{e}}_{j}({\boldsymbol{k}})=\delta_{ij}, \end{equation}
where the symmetric matrix  ${\boldsymbol{\mathsf{M}}}$ is defined by
 \begin{equation} {\boldsymbol{\mathsf{M}}}({\boldsymbol{k}})=\frac{|{\boldsymbol{k}}|^2}{\omega^2|{\boldsymbol{k}}_{h}|^2|k_3|^2}\left(\begin{array}{cc} 1 & 0 \\ 0 & \omega^2({\boldsymbol{k}}) \end{array}\right).\end{equation}
Equation (2.13) is solved in terms of the eigenvectors  ${\boldsymbol {e}}_\pm ({\boldsymbol {k}})$: defining the matrices
 \begin{equation} {\boldsymbol{\mathsf{E}}}_j({\boldsymbol{k}})={\boldsymbol{e}}_j({\boldsymbol{k}}){\boldsymbol{e}}^*_j({\boldsymbol{k}}), \end{equation}
the solution reads
 \begin{equation} \boldsymbol{\mathsf{W}}^{(0)}({\boldsymbol{x}},{\boldsymbol{k}},t)=\sum_{j={\pm}}a_j({\boldsymbol{x}},{\boldsymbol{k}},t){\boldsymbol{\mathsf{E}}}_j({\boldsymbol{k}}) \end{equation}
for amplitudes  $a_j({\boldsymbol {x}},{\boldsymbol {k}},t)$ to be determined. Because, by definition (2.11), $\boldsymbol{\mathsf{W}}$ is Hermitian, these amplitudes are real. The reality of ${\boldsymbol {\phi }}$ further implies that $\boldsymbol{\mathsf{W}} ({\boldsymbol {x}},-{\boldsymbol {k}},t)= \boldsymbol{\mathsf{W}} ^\mathrm {T}({\boldsymbol {x}},{\boldsymbol {k}},t)$ and hence $a_+({\boldsymbol {x}},-{\boldsymbol {k}},t)=a_-({\boldsymbol {x}},{\boldsymbol {k}},t)$. We can therefore focus on a single amplitude, $a({\boldsymbol {x}},{\boldsymbol {k}},t) = a_+({\boldsymbol {x}},{\boldsymbol {k}},t)$, say. This is the desired phase-space energy density. This interpretation is justified by the fact that its integral over ${\boldsymbol {k}}$ approximates the energy density,
 \begin{align}
\mathcal{E}({\boldsymbol{x}},t) &= \tfrac{1}{2} \left(
|{\boldsymbol{u}}|^2 + {b^2}/{N^2} \right) = \tfrac{1}{2}
\left( {\boldsymbol{\mathsf{M}}}^{1/2}(\varepsilon
\mathrm{i} {\boldsymbol{\nabla}}) {\boldsymbol{\phi}}
\right)^\mathrm{T} \left(
{\boldsymbol{\mathsf{M}}}^{1/2}(\varepsilon \mathrm{i}
{\boldsymbol{\nabla}}) {\boldsymbol{\phi}} \right)
\nonumber\\ &= \tfrac{1}{2} \int_{\mathbb{R}^3} \mathrm{tr}
\left( {\boldsymbol{\mathsf{M}}}({\boldsymbol{k}})
\boldsymbol{\mathsf{W}}^{(0)}({\boldsymbol{x}},{\boldsymbol{k}},t)
\right) \mathrm{d} {\boldsymbol{k}} + O(\varepsilon) =
\int_{\mathbb{R}^3} a({\boldsymbol{x}},{\boldsymbol{k}},t)
\, \mathrm{d} {\boldsymbol{k}} + O(\varepsilon).
\end{align}
\begin{align}
\mathcal{E}({\boldsymbol{x}},t) &= \tfrac{1}{2} \left(
|{\boldsymbol{u}}|^2 + {b^2}/{N^2} \right) = \tfrac{1}{2}
\left( {\boldsymbol{\mathsf{M}}}^{1/2}(\varepsilon
\mathrm{i} {\boldsymbol{\nabla}}) {\boldsymbol{\phi}}
\right)^\mathrm{T} \left(
{\boldsymbol{\mathsf{M}}}^{1/2}(\varepsilon \mathrm{i}
{\boldsymbol{\nabla}}) {\boldsymbol{\phi}} \right)
\nonumber\\ &= \tfrac{1}{2} \int_{\mathbb{R}^3} \mathrm{tr}
\left( {\boldsymbol{\mathsf{M}}}({\boldsymbol{k}})
\boldsymbol{\mathsf{W}}^{(0)}({\boldsymbol{x}},{\boldsymbol{k}},t)
\right) \mathrm{d} {\boldsymbol{k}} + O(\varepsilon) =
\int_{\mathbb{R}^3} a({\boldsymbol{x}},{\boldsymbol{k}},t)
\, \mathrm{d} {\boldsymbol{k}} + O(\varepsilon).
\end{align}
An evolution equation for  $a({\boldsymbol {x}},{\boldsymbol {k}},t)$ is derived by considering higher-order terms in the expansion (2.12) and imposing a solvability condition as detailed in Appendix A. The result is the kinetic equation (1.1) with the differential scattering cross-section
 \begin{align}
\sigma({\boldsymbol{k}},{\boldsymbol{k}}')&=\frac{{\rm \pi}
|k_3|^2|k_3'|^2}{2\omega^4 |{\boldsymbol{k}}|^2
|{\boldsymbol{k}}'|^2 |{\boldsymbol{k}}_{h}|^2
|{\boldsymbol{k}}_{h}'|^2}\left[
|{\boldsymbol{k}}_{h}'\times{\boldsymbol{k}}_{h}|^2\left[(N^2+\omega^2)\frac{|{\boldsymbol{k}}_{h}|^2|{\boldsymbol{k}}_{h}'|^2}{|k_3|
|k_3'|}\textrm{sgn}(k_3k_3')\right.\right.\nonumber\\
&\quad +\left.(\,f^2+\omega^2)(2{\boldsymbol{k}}_{h}\boldsymbol{\cdot}{\boldsymbol{k}}_{h}'-|{\boldsymbol{k}}_{h}||{\boldsymbol{k}}_{h}'|\textrm{sgn}(k_3k_3'))\vphantom{\frac{|{\boldsymbol{k}}_{h}|^2|{\boldsymbol{k}}_{h}'|^2}{|k_3|
|k_3'|}}\right]^2+f^2\omega^2\left(\vphantom{\frac{|{\boldsymbol{k}}_{h}|^2|{\boldsymbol{k}}_{h}'|^2}{|k_3|
|k_3'|}}2|{\boldsymbol{k}}_{h}'\times{\boldsymbol{k}}_{h}|^2\right.\nonumber\\
&\quad +\left.\left.\left[|{\boldsymbol{k}}_{h}'-{\boldsymbol{k}}_{h}|^2-(k_3'-k_3)^2\frac{|{\boldsymbol{k}}_{h}'||{\boldsymbol{k}}_{h}|
}{|k_3'||k_3|}
\right]{\boldsymbol{k}}_{h}'\boldsymbol{\cdot}{\boldsymbol{k}}_{h}
\right)^2
\right]\notag\\ &\quad \times\frac{\hat{E}_{K}({\boldsymbol{k}}'-{\boldsymbol{k}})}{|{\boldsymbol{k}}_{h}'-{\boldsymbol{k}}_{h}|^2}\delta\left(\omega({\boldsymbol{k}}')-\omega({\boldsymbol{k}})\right),
\end{align}
\begin{align}
\sigma({\boldsymbol{k}},{\boldsymbol{k}}')&=\frac{{\rm \pi}
|k_3|^2|k_3'|^2}{2\omega^4 |{\boldsymbol{k}}|^2
|{\boldsymbol{k}}'|^2 |{\boldsymbol{k}}_{h}|^2
|{\boldsymbol{k}}_{h}'|^2}\left[
|{\boldsymbol{k}}_{h}'\times{\boldsymbol{k}}_{h}|^2\left[(N^2+\omega^2)\frac{|{\boldsymbol{k}}_{h}|^2|{\boldsymbol{k}}_{h}'|^2}{|k_3|
|k_3'|}\textrm{sgn}(k_3k_3')\right.\right.\nonumber\\
&\quad +\left.(\,f^2+\omega^2)(2{\boldsymbol{k}}_{h}\boldsymbol{\cdot}{\boldsymbol{k}}_{h}'-|{\boldsymbol{k}}_{h}||{\boldsymbol{k}}_{h}'|\textrm{sgn}(k_3k_3'))\vphantom{\frac{|{\boldsymbol{k}}_{h}|^2|{\boldsymbol{k}}_{h}'|^2}{|k_3|
|k_3'|}}\right]^2+f^2\omega^2\left(\vphantom{\frac{|{\boldsymbol{k}}_{h}|^2|{\boldsymbol{k}}_{h}'|^2}{|k_3|
|k_3'|}}2|{\boldsymbol{k}}_{h}'\times{\boldsymbol{k}}_{h}|^2\right.\nonumber\\
&\quad +\left.\left.\left[|{\boldsymbol{k}}_{h}'-{\boldsymbol{k}}_{h}|^2-(k_3'-k_3)^2\frac{|{\boldsymbol{k}}_{h}'||{\boldsymbol{k}}_{h}|
}{|k_3'||k_3|}
\right]{\boldsymbol{k}}_{h}'\boldsymbol{\cdot}{\boldsymbol{k}}_{h}
\right)^2
\right]\notag\\ &\quad \times\frac{\hat{E}_{K}({\boldsymbol{k}}'-{\boldsymbol{k}})}{|{\boldsymbol{k}}_{h}'-{\boldsymbol{k}}_{h}|^2}\delta\left(\omega({\boldsymbol{k}}')-\omega({\boldsymbol{k}})\right),
\end{align}
where  $\hat {E}_{K}({\boldsymbol {k}})$ is the kinetic energy spectrum of the background geostrophic flow, and $\varSigma ({\boldsymbol {k}})$ is the total scattering cross-section
 \begin{equation} \varSigma({\boldsymbol{k}}) = \int_{\mathbb{R}^3} \sigma({\boldsymbol{k}},{\boldsymbol{k}}') \, \mathrm{d} {\boldsymbol{k}}'. \end{equation}
The cross-section (2.22) is the principal object of interest and first main result of this paper. It fully quantifies the impact that scattering by a quasigeostrophic turbulent flow has on the statistics of IGWs. Before analysing this impact in detail, we make six remarks.
(i) The obvious symmetry $\sigma ({\boldsymbol {k}},{\boldsymbol {k}}') = \sigma ({\boldsymbol {k}}',{\boldsymbol {k}})$ ensures that the scattering is energy conserving: the energy density
(2.24)satisfies the conservation law\begin{equation} \mathcal{E}_0({\boldsymbol{x}},t)=\int_{\mathbb{R}^3} a({\boldsymbol{x}},{\boldsymbol{k}},t) \, \mathrm{d}{\boldsymbol{k}} \end{equation}(2.25)with the flux\begin{equation} \partial_t\mathcal{E}_0+{\boldsymbol{\nabla}}_{{\boldsymbol{x}}}\boldsymbol{\cdot}{\boldsymbol{\mathcal{F}}}_0=0, \end{equation}(2.26)Conservation of the volume-integrated energy follows. We emphasise that this conservation is not trivial. The Boussinesq equations linearised about a background flow (2.1) do not conserve the perturbation energy, even when the flow is time independent. The conservation law (2.25) arises from the phase averaging implicit in the definition of\begin{equation} {\boldsymbol{\mathcal{F}}}_0({\boldsymbol{x}},t)=\int_{\mathbb{R}^3}{\boldsymbol{\nabla}}_{{\boldsymbol{k}}}\omega({\boldsymbol{k}}) \, a({\boldsymbol{x}},{\boldsymbol{k}},t) \, \mathrm{d}{\boldsymbol{k}}. \end{equation}$a({\boldsymbol {x}},{\boldsymbol {k}},t)$ and, in this sense, should be interpreted as an action conservation law. Energy and action are equivalent to the level of accuracy of our approximation because the Doppler shift is a factor $\varepsilon ^{1/2}$ smaller than the intrinsic frequency of the IGWs. Action can be defined for a broad class of systems in relation to the pseudoenergy and shown to be conserved provided that the flow be an exact solution of the inviscid fluid equations (Vanneste & Shepherd Reference Vanneste and Shepherd1999); this restriction is not necessary for (2.25) to apply, however.
$\sigma ({\boldsymbol {k}},{\boldsymbol {k}}') = \sigma ({\boldsymbol {k}}',{\boldsymbol {k}})$ ensures that the scattering is energy conserving: the energy density
(2.24)satisfies the conservation law\begin{equation} \mathcal{E}_0({\boldsymbol{x}},t)=\int_{\mathbb{R}^3} a({\boldsymbol{x}},{\boldsymbol{k}},t) \, \mathrm{d}{\boldsymbol{k}} \end{equation}(2.25)with the flux\begin{equation} \partial_t\mathcal{E}_0+{\boldsymbol{\nabla}}_{{\boldsymbol{x}}}\boldsymbol{\cdot}{\boldsymbol{\mathcal{F}}}_0=0, \end{equation}(2.26)Conservation of the volume-integrated energy follows. We emphasise that this conservation is not trivial. The Boussinesq equations linearised about a background flow (2.1) do not conserve the perturbation energy, even when the flow is time independent. The conservation law (2.25) arises from the phase averaging implicit in the definition of\begin{equation} {\boldsymbol{\mathcal{F}}}_0({\boldsymbol{x}},t)=\int_{\mathbb{R}^3}{\boldsymbol{\nabla}}_{{\boldsymbol{k}}}\omega({\boldsymbol{k}}) \, a({\boldsymbol{x}},{\boldsymbol{k}},t) \, \mathrm{d}{\boldsymbol{k}}. \end{equation}$a({\boldsymbol {x}},{\boldsymbol {k}},t)$ and, in this sense, should be interpreted as an action conservation law. Energy and action are equivalent to the level of accuracy of our approximation because the Doppler shift is a factor $\varepsilon ^{1/2}$ smaller than the intrinsic frequency of the IGWs. Action can be defined for a broad class of systems in relation to the pseudoenergy and shown to be conserved provided that the flow be an exact solution of the inviscid fluid equations (Vanneste & Shepherd Reference Vanneste and Shepherd1999); this restriction is not necessary for (2.25) to apply, however.(ii) The factor
$\delta (\omega ({\boldsymbol {k}}')-\omega ({\boldsymbol {k}}))$ indicates that the energy exchanges caused by scattering are restricted to a constant-frequency surface in ${\boldsymbol {k}}$-space, that is, the cone $k_3/k_{h} = \mathrm {const}$. This is because the evolution of the background flow is slow enough that the flow is treated as time independent. Scattering then results from resonant triadic interactions in which one mode – the catalyst vortical mode – has zero frequency, and the other two modes – the IGWs – have equal and opposite frequencies. For a realistic time-dependent geostrophic flow, some energy is transferred off the constant-frequency cone, but this transfer is weak and the bulk of the energy remains confined to the cone, as figure 1(e–h) illustrates. The geometry of the constant-frequency cone is crucial to the nature of the scattering. In the next section we account for it explicitly by rewriting the kinetic equation on the constant-frequency cone itself, using spherical polar coordinates.(iii) We can connect (2.22) to earlier results on the scattering of IGWs by a barotropic (i.e.
$z$-independent) quasigeostrophic flow (Savva & Vanneste Reference Savva and Vanneste2018). The assumption of a barotropic flow amounts to taking $\hat {E}_{K}({\boldsymbol {k}}) = \hat {E}_{K,B}({\boldsymbol {k}}_{h}) \delta (k_3)$, which implies that $k_3=k_3'$ in (2.22), hence $|{\boldsymbol {k}}_{h}|=|{\boldsymbol {k}}_{h}'|$ and $|{\boldsymbol {k}}|=|{\boldsymbol {k}}'|$ in view of the resonance condition $\omega ({\boldsymbol {k}})=\omega ({\boldsymbol {k}}')$. If we further make the hydrostatic approximation $|{\boldsymbol {k}}|\approx |k_3|$ (Olbers, Willebrand & Eden Reference Olbers, Willebrand and Eden2012) we obtain
(2.27)which is identical to the cross-section derived for the rotating shallow-water system in Savva & Vanneste (Reference Savva and Vanneste2018). It is further shown in that paper that the cross-section reduces to that derived for near-inertial waves by Danioux & Vanneste (Reference Danioux and Vanneste2016) when
\begin{align}
\sigma({\boldsymbol{k}},{\boldsymbol{k}}')&=\frac{2{\rm \pi}
}{\omega^4 |{\boldsymbol{k_{h}}}|^4 }\left(
|{\boldsymbol{k}}_{h}'\times{\boldsymbol{k}}_{h}|^2\left((\omega^2+f^2){\boldsymbol{k}}_{h}\boldsymbol{\cdot}{\boldsymbol{k}}_{h}'-f^2|{\boldsymbol{k}}_{h}|^2\right)^2\right.\nonumber\\
&\quad + \left.f^2\omega^2\left(|{\boldsymbol{k}}_{h}'\times{\boldsymbol{k}}_{h}|^2
+{\boldsymbol{k}}_{h}\boldsymbol{\cdot}{\boldsymbol{k}}_{h}'\left(|{\boldsymbol{k}}_{h}|^2-{\boldsymbol{k}}_{h}\boldsymbol{\cdot}{\boldsymbol{k}}_{h}'\right)
\right)^2
\right)\notag\\ &\quad \times \frac{\hat{E}_{{KK,B}}({\boldsymbol{k}}'_{h}-{\boldsymbol{k}}_{h})}{|{\boldsymbol{k}}_{h}'-{\boldsymbol{k}}_{h}|^2}\delta\left(\omega({\boldsymbol{k}}')-\omega({\boldsymbol{k}})\right),
\end{align}
$\omega \to f$.(iv) The WKBJ limit of the kinetic equation is obtained by assuming that the energy of the quasigeostrophic flow is concentrated at scales large compared with the wave scales; formally,
$\hat {E}_{K}({\boldsymbol {k}}) = g(\alpha ^{-1} {\boldsymbol {k}})$ for $\alpha \ll 1$ and some function $g$ that decreases rapidly for large argument. In this limit, it can be shown that the scattering terms in (1.1) reduce to the (wavenumber) diffusion derived by Kafiabad et al. (Reference Kafiabad, Savva and Vanneste2019) taking the WKBJ approximation as a starting point (see Savva (Reference Savva2020) for details). This makes it clear that the results of the present paper extend those of Kafiabad et al. (Reference Kafiabad, Savva and Vanneste2019) to capture a broad range of wave scales, from scales larger than the quasigeostrophic-flow scales down to arbitrarily small scales. The mechanism of interaction in this WKBJ limit is a version of the induced diffusion mechanism identified by McComas & Bretherton (Reference McComas and Bretherton1977) for interactions between IGWs, with the small-${\boldsymbol {K}}$ geostrophic mode playing the role of the low-frequency IGW.(v) The assumption of statistical homogeneity and stationarity of the geostrophic flow can be relaxed to allow the flow energy spectrum
$\hat {E}_{K}$ to vary on the slow scales ${\boldsymbol {x}}$ and $t$, leading to an ${\boldsymbol {x}}$- and $t$-dependent cross-section $\sigma ({\boldsymbol {k}},{\boldsymbol {k}}',{\boldsymbol {x}},t)$.(vi) In the homogeneous case,
${\boldsymbol {\nabla }}_{\boldsymbol {x}} a=0$, the energy density $a({\boldsymbol {k}},t)$ can be defined simply in terms of Fourier transform without need for the Wigner-transform formulation, and the cross-section can be obtained through more straightforward computations than those reported in Appendix A. This is the approach taken by Eden et al. (Reference Eden, Chouksey and Olbers2019); we expect their coefficients characterising the catalytic interactions (in their Eq. (21)) to be equivalent to the cross-section (2.22) when the hydrostatic approximation $|{\boldsymbol {k}}|\approx |k_3|$ is made.


We next rewrite the kinetic equation (1.1) in a form tailored to the geometry of the constant-frequency cones on which the energy exchanges are restricted, and discuss its properties.
3. Scattering on the constant-frequency cone
3.1. Kinetic equation in spherical coordinates
We use spherical polar coordinates for the wavevectors, writing
 \begin{equation} {\boldsymbol{k}}=k\left(\begin{array}{c} \sin\theta\cos\varphi \\ \sin\theta\sin\varphi\\ \cos\theta \end{array}\right) \quad \text{and} \quad {\boldsymbol{k}}'={k}'\left(\begin{array}{c} \sin\theta'\cos(\varphi+\varphi') \\ \sin\theta'\sin(\varphi+\varphi')\\ \cos\theta' \end{array}\right). \end{equation}
Note that we use  $\varphi '$ for the difference between the azimuthal angles of wavevectors ${\boldsymbol {k}}'$ and ${\boldsymbol {k}}$ rather than the azimuthal angle of ${\boldsymbol {k}}'$ itself. See figure 2 for the coordinate geometry. In these coordinates the dispersion relation (2.5) reads
 \begin{equation} \omega({\boldsymbol{k}}) = \omega(\theta)=\sqrt{N^2\sin^2\theta+f^2\cos^2\theta}. \end{equation}
The constant-frequency constraint  $\omega (\theta ')=\omega (\theta )$ implies that $\theta$ and $\theta '$ are either $\theta _\omega$ or ${\rm \pi} - \theta _\omega$, where
 \begin{equation} 0 \le \theta_\omega=\sin^{{-}1}\sqrt{\frac{\omega({\boldsymbol{k}})^2-f^2}{N^2-f^2}} \le {\rm \pi}/2 \end{equation}
is a constant identifying the cone corresponding to a specific IGW frequency  $\omega$. We interpret this as follows: the constant-frequency cone has two nappes, one corresponding to upward-propagating waves and the other to downward-propagating waves, and a wave of a certain type, upward-propagating say, exchanges energy with both upward- and downward-propagating waves. We separate the two types of exchanges by writing the delta function in (2.22) in the new coordinates (3.1a,b) as
 \begin{equation} \delta(\omega({\boldsymbol{k}}')-\omega({\boldsymbol{k}}))=\frac{2\,\omega(\theta')}{|\sin(2\theta')|(N^2-f^2)}\left(\delta(\theta'-{\theta_\omega})+\delta(\theta'-({\rm \pi}-{\theta_\omega}))\right) \end{equation}
and defining the pair of cross-sections  $\sigma _\pm$ by
 \begin{equation} \sum_{j={\pm}}{\sigma_j({k},{k}',\varphi, \varphi')} = \int_{0}^{\rm \pi}\sigma\sin\theta'\,\mathrm{d}\theta', \end{equation}
each associated with the contribution of a single  $\delta$-function. In this way, $\sigma _+$ quantifies the rate of scattering between waves on the same nappe of the constant-frequency cone, while $\sigma _-$ quantifies the rate of scattering between the two nappes and thus the wave reflection induced by interactions with the flow. Note that $\sigma _\pm$ depend parametrically on $\theta _\omega$ or, equivalently, on the IGW frequency; for simplicity, we do not make this dependence explicit from here on. Introducing (3.4) into (2.22) and carrying out the integration in $\theta '$ gives
 \begin{align} \sigma_\pm
{(k,k',\varphi,\varphi')}&=\frac{{\rm \pi}{k}^2{k}'^2}{16\omega^3}\frac{{\sin^3(2\theta_\omega)}}{\sin
{\theta_\omega}(N^2-f^2)}\left\{
4f^2\omega^2\left[\cos\varphi'(\cos\varphi'\mp
1)-\sin^2\varphi'\right]^2 \right.\nonumber\\ &\quad + \left.
\sin^2\varphi'\left[(\omega^2+f^2)(2\cos\varphi'\mp
1)\pm(N^2+\omega^2){\tan^2{\theta_\omega}} \right]^2
\right\}\notag\\ &\quad \times \frac{\hat{E}_{K}({\boldsymbol{k}}'-{\boldsymbol{k}})}{({k}^2+{k}'^2-2{k}'{k}\cos\varphi')},
\end{align}
\begin{align} \sigma_\pm
{(k,k',\varphi,\varphi')}&=\frac{{\rm \pi}{k}^2{k}'^2}{16\omega^3}\frac{{\sin^3(2\theta_\omega)}}{\sin
{\theta_\omega}(N^2-f^2)}\left\{
4f^2\omega^2\left[\cos\varphi'(\cos\varphi'\mp
1)-\sin^2\varphi'\right]^2 \right.\nonumber\\ &\quad + \left.
\sin^2\varphi'\left[(\omega^2+f^2)(2\cos\varphi'\mp
1)\pm(N^2+\omega^2){\tan^2{\theta_\omega}} \right]^2
\right\}\notag\\ &\quad \times \frac{\hat{E}_{K}({\boldsymbol{k}}'-{\boldsymbol{k}})}{({k}^2+{k}'^2-2{k}'{k}\cos\varphi')},
\end{align}
where it is understood that  ${\boldsymbol {k}}'$ in the argument of the spectrum $\hat {E}_{K}({\boldsymbol {k}}'-{\boldsymbol {k}})$ is restricted to represent the set of wavevectors on the same nappe of the constant-frequency cone as ${\boldsymbol {k}}$ for $\sigma _+$ and on the opposite nappe for $\sigma _-$.
Constant-frequency cone in wavevector space displaying the spherical coordinates used in the representation (3.1a,b) of the wavevectors  ${\boldsymbol {k}}$ and ${\boldsymbol {k}}'$. Scattering transfers energy between IGWs with the same frequency; hence their wavevectors ${\boldsymbol {k}}$ and ${\boldsymbol {k}}'$ lie on the same cone. The wavevector ${\boldsymbol {K}}={\boldsymbol {k}}'-{\boldsymbol {k}}$ of the geostrophic mode inducing the scattering is also shown.

We emphasise that the cross-sections  $\sigma _\pm$ depend on the azimuthal angle $\varphi$ solely through the background-flow spectrum $\hat {E}_{K}$. This dependence disappears for horizontally isotropic flows and the cross-sections are then functions of three variables only: $\sigma _\pm =\sigma _\pm (k,k',\varphi ')$. We use this to illustrate the form of $\sigma _\pm$ for a fixed $k=k_*$ in figure 3. The energy spectrum $\hat {E}_{K}$ used is obtained by azimuthally averaging the spectrum obtained in a geostrophic turbulence simulation described in § 4. This spectrum is characterised by a well-defined peak at a horizontal wavenumber $K_*$ which we identify with the characteristic wavenumber used in the definition (2.6) of the Rossby number. The figure indicates that $\sigma _+$ is localised around $(k'=k_*, \varphi '=0)$. This implies spectrally local energy transfers and stems from the concentration of the background-flow energy at large scales. The localisation is increasingly marked as the ratio $k_*/K_*$ of the IGW wavenumber to the geostrophic-flow peak wavenumber increases. This culminates in the WKBJ regime $k_*/K_* \gg 1$, when scattering is well described by a fully local diffusion in Kafiabad et al. (Reference Kafiabad, Savva and Vanneste2019). The broader support of $\sigma _+$ in $\varphi '$ compared with $k'$ suggests that scattering leads to a rapid wave energy spreading in the azimuthal direction, that is, a rapid isotropisation in the horizontal, followed by a slower radial spreading associated with a cascade towards small scales. Numerical simulations (not shown) confirm this general tendency.
Scattering cross-sections  $\sigma _\pm (k=k_*,k',\varphi ')$ for $\omega =3f$, ${Ro}=0.099$, $N/f=32$, and the quasigeostrophic-flow energy spectrum described in § 4.1. The ratio of the IGW wavenumber to the geostrophic-flow peak wavenumber is $k_*/K_*\simeq 4$ (WKBJ regime, (a,b)), $k_*/K_*\simeq 1$ (c,d) and $k_*/K_*\simeq 0.1$ (e,f). The cross-sections are plotted in a polar representation of the coordinates $(k',\varphi ')$ corresponding to on orthogonal projection of the constant-frequency cone on the $(k_1,k_2)$-plane. Note that the colour scale is logarithmic and varies between plots.

The corresponding plots of  $\sigma _-$ in figure 3 indicate that the transfers between nappes of the constant-frequency cone are weak, especially for large $k_*/K_*$. The maximum pointwise value of $\sigma _-$ exceeds that of $\sigma _+$ for $k_*/K_* \simeq 1$ and $k_*/K_* \simeq 0.1$. It is attained for $k'=k$, corresponding to the interactions between two IGWs that are reflections of one another on each nappe of the cone – a mechanism that can be identified as the elastic scattering mechanism of McComas & Bretherton (Reference McComas and Bretherton1977). This pointwise value is, however, not an indication that transfers between the different nappes are stronger than those across the same nappe since integrated values are more meaningful. We therefore show
 \begin{equation} \varSigma_\pm({k})=\int_0^\infty\int_{-{\rm \pi}}^{\rm \pi}\sigma_\pm(k,k',\varphi'){k}'^2 \, \mathrm{d}\varphi'\mathrm{d}{k}',\end{equation}
in figure 4 to confirm the dominance of  $\sigma _+$ over $\sigma _-$ and hence of energy transfers on the same nappe of the cone over energy transfers between nappes. The values of $\sigma _-$ and $\varSigma _-$ decrease as $k_*/K_*$ increases, and in the WKBJ limit the transfers between nappes are completely negligible; in other words, short IGWs do not get reflected.


With the spherical polar coordinates, it is convenient to introduce the two energy densities  $b_\pm ({\boldsymbol {x}},{k},\varphi ,t)$ such that
 \begin{align} \sin\theta_\omega \, k^2 \, a({\boldsymbol{x}},k,\varphi,\theta,t) = b_+ ({\boldsymbol{x}},k,\varphi,t) \, \delta(\theta-\theta_\omega) + b_- ({\boldsymbol{x}},k,\varphi,t) \, \delta(\theta-({\rm \pi}-\theta_\omega)). \end{align}
With this definition accounting for the area factor  $\sin \theta _\omega \, k^2$, $b_+({\boldsymbol {x}},k,\varphi ,t) \, \mathrm {d} k \mathrm {d} \varphi$ is the energy in $[k,k+\mathrm {d} k] \times [\varphi ,\varphi + \mathrm {d} \varphi ]$ on the upper nappe of the cone, corresponding to upward-propagating IGWs, and $b_-({\boldsymbol {x}},k,\varphi ,t) \, \mathrm {d} k \mathrm {d} \varphi$ its counterpart for the lower nappe of the cone, corresponding to downward-propagating IGWs.
We group  $b_\pm$ in the vector
 \begin{equation} {\boldsymbol{b}}({\boldsymbol{x}},{k},\varphi,t) = \begin{pmatrix} b_+({\boldsymbol{x}},{k},\varphi,t) \\ b_-({\boldsymbol{x}},{k},\varphi,t) \end{pmatrix} \end{equation}
to rewrite the kinetic equation (1.1) as
 \begin{align} &{{\partial_t}
{\boldsymbol{b}}}({\boldsymbol{x}},{\boldsymbol{k}},t) +
{\boldsymbol{\nabla}}_{{\boldsymbol{k}}}\omega({\boldsymbol{k}})
\boldsymbol{\cdot}{\boldsymbol{\nabla}}_{{\boldsymbol{x}}}{\boldsymbol{b}}({\boldsymbol{x}},{\boldsymbol{k}},t)
\nonumber\\
&\quad =k^2\iint\boldsymbol{\sigma}({k},{k}',\varphi,\varphi')\,
{\boldsymbol{b}}({\boldsymbol{x}},{k}',\varphi-\varphi',t)\mathrm{d}{k}'\mathrm{d}\varphi'
-\varSigma({k},\varphi)\,{\boldsymbol{b}}({\boldsymbol{x}},{k},\varphi,t),
\end{align}
\begin{align} &{{\partial_t}
{\boldsymbol{b}}}({\boldsymbol{x}},{\boldsymbol{k}},t) +
{\boldsymbol{\nabla}}_{{\boldsymbol{k}}}\omega({\boldsymbol{k}})
\boldsymbol{\cdot}{\boldsymbol{\nabla}}_{{\boldsymbol{x}}}{\boldsymbol{b}}({\boldsymbol{x}},{\boldsymbol{k}},t)
\nonumber\\
&\quad =k^2\iint\boldsymbol{\sigma}({k},{k}',\varphi,\varphi')\,
{\boldsymbol{b}}({\boldsymbol{x}},{k}',\varphi-\varphi',t)\mathrm{d}{k}'\mathrm{d}\varphi'
-\varSigma({k},\varphi)\,{\boldsymbol{b}}({\boldsymbol{x}},{k},\varphi,t),
\end{align}
where the matrix-valued cross-section
 \begin{equation} \boldsymbol{\sigma}=\left(\begin{array}{cc} \sigma_+ & \sigma_- \\ \sigma_- & \sigma_+ \end{array}\right)\end{equation}
has components defined in (3.6) and  $\varSigma = \varSigma _+ + \varSigma _-$ follows from (3.7). Equation (3.10), consisting of a pair of coupled kinetic equations in the two-dimensional $(k,\varphi )$-space, provides the most useful description of the scattering of IGWs by geostrophic turbulence. It simplifies further for horizontally isotropic flows since the explicit dependence on $\varphi$ disappears and Fourier series can be employed. We discuss properties of the scattering inferred from (3.10) in the next section.
3.2. Properties of the scattering
The sum  $b_++b_-$ of the two components of ${\boldsymbol {b}}$ is the total energy density and is conserved:
 \begin{equation} \mathcal{E}_0({\boldsymbol{x}},t) = \int_0^\infty \int_{-{\rm \pi}}^{\rm \pi} \left( b_+({\boldsymbol{x}},k,\varphi,t) + b_-({\boldsymbol{x}},k,\varphi,t) \right) \, \mathrm{d} k\, \mathrm{d} \varphi \end{equation}
satisfies the conservation law (2.25). The difference  $\Delta b = b_+-b_-$, on the other hand, can be shown to satisfy
 \begin{equation} \partial_t \int_0^\infty \int_{-{\rm \pi}}^{\rm \pi} \Delta b({\boldsymbol{x}},k,\varphi,t) \, \mathrm{d} k\,\mathrm{d} \varphi ={-}2\int_0^\infty \int_{-{\rm \pi}}^{\rm \pi} \varSigma_-(k,\varphi)\Delta b({\boldsymbol{x}},k,\varphi,t) \,\mathrm{d} k\,\mathrm{d}\varphi, \end{equation}
using the evenness of  $\sigma _\pm$ in $\varphi '$ and the reversibility symmetry $\sigma '_\pm (k,k',\varphi ,\varphi ')=\sigma '_\pm (k',k,\varphi +\varphi ',-\varphi ')$. Since $\varSigma _- > 0$, this shows that $\iint \Delta b \, \mathrm {d} k \,\mathrm {d} \varphi$ decays with time at a rate controlled by the cross-section $\varSigma _-$, so that the scattering leads to an equipartition between upward- and downward-propagating IGWs. Note that twice the maximum of $\varSigma _-$, $2 \lVert \varSigma _- \rVert _\infty$, provides a lower bound on the rate at which this equipartition occurs (see Savva Reference Savva2020).
In common with other kinetic equations, (1.1) or (3.10) satisfy an H-theorem (Villani Reference Villani2008) showing that the entropy
 \begin{equation} - \int_{\mathbb{R}^3} a\ln a \, \mathrm{d}{\boldsymbol{k}}\,\mathrm{d}{\boldsymbol{x}} \end{equation}
increases. This implies that IGW energy spreads on the constant-energy cone in an irreversible manner. Because the cone is not compact, there is no possibility of reaching a steady state, so the scattering leads to a continued scale cascade, mostly towards small scales as a result of the cone geometry, that is only arrested by dissipation. This is in sharp contrast with the situation in the absence of vertical shear where the constant-frequency sets are circles (intersections of the cones with the surfaces  $k_3 = \mathrm {const.}$) and a steady state is reached, corresponding to an isotropic distribution of IGW energy when the flow is horizontally isotropic (Savva & Vanneste Reference Savva and Vanneste2018).
We now focus on the case of an isotropic background flow, when the cross-sections (3.6) are independent of the azimuthal variable  $\varphi$. Expanding both sides of (3.10) in Fourier series gives
 \begin{align} &\partial_t
\hat{{\boldsymbol{b}}}_n({\boldsymbol{x}},k,t)
+{\boldsymbol{\nabla}}_{{\boldsymbol{k}}}\omega({\boldsymbol{k}})
\boldsymbol{\cdot}{\boldsymbol{\nabla}}_{{\boldsymbol{x}}}\hat{{\boldsymbol{b}}}_n({\boldsymbol{x}},k,t)\notag\\
&\quad ={2{\rm \pi}}k^2\int_0^\infty{\hat{\boldsymbol{\sigma}}}\phantom{}_{n}(k,k')\,\hat{{\boldsymbol{b}}}_n({\boldsymbol{x}},{k}',t)
\, \mathrm{d}{k}'
-\varSigma(k)\,\hat{{\boldsymbol{b}}}_n({\boldsymbol{x}},{k},t),
\end{align}
\begin{align} &\partial_t
\hat{{\boldsymbol{b}}}_n({\boldsymbol{x}},k,t)
+{\boldsymbol{\nabla}}_{{\boldsymbol{k}}}\omega({\boldsymbol{k}})
\boldsymbol{\cdot}{\boldsymbol{\nabla}}_{{\boldsymbol{x}}}\hat{{\boldsymbol{b}}}_n({\boldsymbol{x}},k,t)\notag\\
&\quad ={2{\rm \pi}}k^2\int_0^\infty{\hat{\boldsymbol{\sigma}}}\phantom{}_{n}(k,k')\,\hat{{\boldsymbol{b}}}_n({\boldsymbol{x}},{k}',t)
\, \mathrm{d}{k}'
-\varSigma(k)\,\hat{{\boldsymbol{b}}}_n({\boldsymbol{x}},{k},t),
\end{align}
where the hats denote the Fourier coefficients defined as
 \begin{equation} \hat{{\boldsymbol{b}}}_n({\boldsymbol{x}},k,t)=\frac{1}{2{\rm \pi}}\int_{-{\rm \pi}}^{\rm \pi}\mathrm{e}^{\mathrm{i} n\varphi} \, {\boldsymbol{b}}({\boldsymbol{x}},k,\varphi,t)\,\mathrm{d}\varphi. \end{equation}
We can show from (3.14) that, for  $n \not =0$, $\int \hat {{\boldsymbol {b}}}_n \, \mathrm {d} k \to 0$ as $t \to \infty$. This is seen by integrating (3.14) with respect to $k$ and summing the $\pm$ components of $\hat {{\boldsymbol {b}}}_n$ to obtain
 \begin{align} &\partial_t
\int_0^\infty \left(
\hat{b}_{n+}({\boldsymbol{x}},k,t)+\hat{b}_{n-}({\boldsymbol{x}},k,t)
\right) \, \mathrm{d} k \nonumber\\
&\quad ={-}\int_0^\infty\left(\varSigma(k)-\varLambda_n(k) \right)
\left(
\hat{b}_{n+}({\boldsymbol{x}},k,t)+\hat{b}_{n-}({\boldsymbol{x}},k,t)
\right) \mathrm{d} k,
\end{align}
\begin{align} &\partial_t
\int_0^\infty \left(
\hat{b}_{n+}({\boldsymbol{x}},k,t)+\hat{b}_{n-}({\boldsymbol{x}},k,t)
\right) \, \mathrm{d} k \nonumber\\
&\quad ={-}\int_0^\infty\left(\varSigma(k)-\varLambda_n(k) \right)
\left(
\hat{b}_{n+}({\boldsymbol{x}},k,t)+\hat{b}_{n-}({\boldsymbol{x}},k,t)
\right) \mathrm{d} k,
\end{align}
where
 \begin{equation} \varLambda_n(k)=2{\rm \pi} \int_0^\infty (\hat{\sigma}_{n+}(k,k')+\hat{\sigma}_{n-}(k,k')) k'^2 \, \mathrm{d} k'. \end{equation}
It follows from (3.17) and the properties of Fourier coefficients that
 \begin{equation} \varLambda_0(k)=\varSigma(k) \quad \text{and}\quad |\varLambda_{n}(k)|<\varLambda_0(k) \quad \text{for} \ n \ge 1. \end{equation}
Thus the scattering term on the right-hand side of (3.16) vanishes for  $n=0$ and is negative for $n\geq 1$, so that the amplitudes $\hat {b}_{n\pm }$ decay for all but the isotropic ( $n=0$) mode. Hence the IGW wavefield becomes horizontally isotropic in the long-time limit irrespective of the initial conditions.
In the remainder of the paper, we test the predictions of the kinetic equation (3.14) against direct numerical simulations of the Boussinesq equations. We focus on an initial condition that is approximately spatially homogeneous and horizontally isotropic so that the transport term  ${\boldsymbol {\nabla }}_{{\boldsymbol {k}}}\omega \boldsymbol {\cdot }{\boldsymbol {\nabla }}_{{\boldsymbol {x}}}\hat {{\boldsymbol {b}}}_n$ can be neglected and only the mode $n=0$ needs to be considered.
4. Kinetic equation versus Boussinesq simulations
4.1. Set-up and numerical methods
We carry out a set of Boussinesq simulations similar to those in Kafiabad et al. (Reference Kafiabad, Savva and Vanneste2019), using a code adapted from that in Waite & Bartello (Reference Waite and Bartello2006) based on a dealiased pseudospectral method and a third-order Adams–Bashforth scheme with time step  $0.015/f$. The triply periodic domain, $(2 {\rm \pi})^3$ in the scaled coordinates $(x,y,z'=Nz/f)$, is discretised uniformly with $768^3$ grid points and a hyperdissipation of the form $-\nu (\partial _x^8+\partial _y^8 + \partial _{z'}^8)$, with $\nu = 2\times 10^{-17}$ is added to the momentum and density equations. We take $N/f=32$, a representative value of mid-depth ocean stratification. The initial condition is the superposition of a turbulent geostrophic flow and IGWs. The geostrophic flow is obtained by running the model in an unforced quasigeostrophic configuration (setting the linear wave modes to zero at each time step) from a random small-scale initial condition until an approximately statistically stationary state is reached through inverse energy cascade. The spectrum of this stationary state peaks at $K_{{h*}} \simeq 4$ and has an inertial subrange scaling approximately as $K_{h}^{-3}$ and $K_{3}^{-3}$. The initial vertical vorticity field on a horizontal plane and the initial kinetic energy spectrum of the geostrophic flow are shown in figure 5. The spectrum evolves slowly over the IGW-diffusion time scale, and its time-average defines $\hat {E}_{K}$ which is used to calculate the cross-sections $\hat {\boldsymbol {\sigma }}_n({k},{k}')$ in (3.14). Inertia-gravity waves are initialised along a ring in wavenumber space, with random phases and identical magnitudes, so that the corresponding spectrum is horizontally isotropic, that is, independent of $\varphi$. Since this remains (approximately) the case throughout the simulation, we concentrate on the evolution of the spectrum $\hat {{\boldsymbol {b}}}_0(k,t)$ of the isotropic, $n=0$ mode.
Vertical vorticity on the horizontal plane  $z=0$ (a) and kinetic energy spectrum of the initial geostrophic flow (b). Both horizontal (black line) and vertical spectra (blue line) are shown, with a $K^{-3}$ power law (indicted by the dashed line).

Simulations are performed for two Rossby numbers  ${Ro}= K_{{h}*} \langle |\boldsymbol {U}|^2 \rangle ^{1/2}/f =0.049,\, 0.099$ (or $\langle \zeta ^2 \rangle ^{1/2}/f=0.1,\, 0.2$ for the alternative Rossby numbers based on the vertical vorticity $\zeta$), which we refer to as ‘low’ and ‘high’ Rossby numbers, and the two IGW frequencies $\omega =2f, \, 3f$. We carry our experiments with two different IGW horizontal wavenumbers: (i) $k_{h*}=16\simeq 4 K_{h*}$, as used in Kafiabad et al. (Reference Kafiabad, Savva and Vanneste2019), which is large enough to be in the WKBJ regime where the scattering integral in (3.14) reduces to a diffusion; and (ii) $k_{h*}=4\simeq K_{h*}$ which requires the full kinetic equation. The IGW energy spectrum is computed at each step following the normal-mode decomposition of Bartello (Reference Bartello1995). We retain data for $(k_{h},f k_3 /N)\in [0,254]\times [-255,255]$, and deduce the two components of
 \begin{equation} \hat{{\boldsymbol{b}}}_0(k,t) = \frac{1}{2{\rm \pi}} \int_{-{\rm \pi}}^{\rm \pi} {\boldsymbol{b}}(k,\varphi,t) \, \mathrm{d} \varphi \end{equation}
on a one-dimensional uniform grid with  $k\in [-254/\sin \theta ,254/\sin \theta ]$ by projection onto the constant-frequency cone. Conventionally, we take negative values of $k$ for the lower nappe of the cone (i.e. ${\rm \pi} /2 < \theta <{\rm \pi}$) so $\hat {b}_0(k,t)=\hat {b}_{0+}(k,t)$ for $k \ge 0$ and $\hat {b}_0(k,t)=\hat {b}_{0-}(-k,t)$ for $k \le 0$. In what follows, we omit the hat and subscript $0$ from $\hat {b}_0(k,t)$.
We solve the kinetic equation (3.14) for the horizontally isotropic mode  $n=0$ on an evenly spaced grid interpolated to provide twice the resolution of data from the Boussinesq simulations for a given frequency. We interpolate the geostrophic kinetic-energy spectrum $\hat {E}_{K}$ to double the resolution in each dimension for computing the cross-sections $\sigma _\pm$. We employ a fast Fourier transform to compute the $\varphi$-averaged cross-section $\hat {\boldsymbol {\sigma }}_0$. Equation (3.14) is integrated in time using an Euler scheme with time steps chosen so that $\Delta t =0.5\,(\max _{{k}}\varSigma ({k}))^{-1}$. The integrals in $k'$ are discretised as Riemann sums, which respects the energy conservation property of the kinetic equation. Absorbing layers are used to prevent cascaded energy from building up. For comparison, the diffusion equation of Kafiabad et al. (Reference Kafiabad, Savva and Vanneste2019) is solved on the upper nappe on the grid ${k\in [0,254/\sin \theta ]}$ with the same resolution as the kinetic equation, using first-order central-difference differences for the $k$-derivatives, and a stiff ordinary differential equation solver for time stepping.
4.2. Initial-value problem
We first analyse an initial-value problem. Upward-propagating horizontally isotropic IGWs are initialised on the ring  $k_{h}=k_{h*}$, $k_3=\cot \theta \, k_{h*}$, with random phases and an initial kinetic energy $\langle |\boldsymbol {u}|^{2} \rangle /2 = 0.1 \langle |\boldsymbol {U}|^{2} \rangle /2$. While the linearisation condition $|\boldsymbol {u}| \ll |\boldsymbol {U}|$ is only marginally satisfied, we find that the nonlinear wave–wave interactions, neglected in the theory but included in the Boussinesq simulations, have little impact on the results. Much smaller values of $|\boldsymbol {u}|$ make the linear mode decomposition we use to separate IGWs from the balanced flow inaccurate (see below).
The spectrum  $b(k,t)$ at four successive times is shown in figure 6 for $\omega = 2 f, \, {Ro}=0.049$ (a,c) and $\omega = 3 f, \, {Ro}=0.099$ (b,d), and for $k_{h*} / K_{h*} \simeq 4$ (a,b) and $k_{h*}/ K_{h*} \simeq 1$ (c,d). The results of the Boussinesq simulations are compared with solutions of the kinetic equation and of the diffusion equation of Kafiabad et al. (Reference Kafiabad, Savva and Vanneste2019). For the latter two equations, $b(k,t)$ is matched to the spectrum obtained in the Boussinesq simulations after an adjustment time $t_{a}\gg (K_*|{\boldsymbol {c}}_g|)^{-1}$, the time for a wavepacket to traverse typical eddies at the IGW group speed, required for the kinetic equation to be valid (Besieris Reference Besieris1987; Müller et al. Reference Müller, Holloway, Henyey and Pomphrey1986, § 5). This adjustment time is used as the initial time $t=0$ in the figure. The comparison shows a good agreement between the kinetic equation and Boussinesq results, demonstrating both the ability of the kinetic equation to model faithfully the energy scattering induced by the flow, and the dominance of this process over others such as wave–wave interactions. The diffusion equation provides a good approximation to the spectrum for $k_{h*}/K_{h*} \simeq 4$ but, consistent with its reliance on the assumption $k_* \gg K_*$, is inaccurate $k_{h*}/K_{h*} \simeq 1$. For the larger ${Ro}$ and $k_{h*}/K_{h*} \simeq 1$, the match between the kinetic equation and Boussinesq results is poor at low wavenumbers, which could stem from two reasons. First, the discretisation in wavenumber space makes projection onto the constant-frequency cone inaccurate at low wavenumbers, near the cone's apex, because only four IGW wavelengths fit in the computational domain ( $k_{h*} = K_{h*} = 1$). Second, the linear wave–vortex decomposition used in this study to extract the wave energy is less accurate around the peak of the geostrophic energy spectrum when the Rossby number is not small. As discussed in Kafiabad & Bartello (Reference Kafiabad and Bartello2016), because of the strength of the balanced flow at these scales, a substantial part of what we extract as linear wave modes is in a fact a balanced contribution, ‘slaved’ to the geostrophic modes. A higher-order decomposition would be needed to better isolate the freely propagating waves but is beyond the scope of our study.
Evolution of the spectrum  $b(k,t)$ for IGWs with horizontal wavenumber $k_*$ released in a quasigeostrophic flow with peak wavenumber $K_*$ for the parameters: (a) $\omega =2f$, ${Ro}=0.049$, $k_{{h*}}/K_{{h*}}\simeq 4$; (b) $\omega =3f$, ${Ro}=0.099$, $k_{{h*}}/K_{{h*}}\simeq 4$; (c) $\omega =2f$, ${Ro}=0.049$, $k_{{h*}}/K_{{h*}}\simeq 1$; (d) $\omega =3f$, ${Ro}=0.099$, $k_{{h*}}/K_{{h*}}\simeq 1$. Numerical solutions of the Boussinesq equations (black lines) are compared with solutions of the kinetic equation (red lines) and of the diffusion equation (blue lines) that approximates it in the WKBJ limit $k_* \gg K_*$.

A different view of the results in given by figure 7 which shows the spectrum of upward-propagating waves  $b_+(k,t)$ (panel a) and downward-propagating waves $b_-(k,t)$ for $\omega = 2 f$, ${Ro}=0.049$ and $k_{h*}/ K_{h*} \simeq 1$ in log–log coordinates. This shows an excellent agreement at most except the extreme wavenumbers (where the dissipation mechanisms, which differ between the kinetic equation and Boussinesq computations, are felt). Thus the kinetic equation accurately captures the scale cascade that results from scattering by the turbulent flow. Similar results (not shown) are obtained in the WKBJ regime $k_{h*} / K_{h*} \simeq 4$ where the kinetic equation predicts spectra very close to those obtained in Kafiabad et al. (Reference Kafiabad, Savva and Vanneste2019) using the diffusion equation. Note that the diffusion equation predicts a $k^{-2} t^{-5}$ dependence of the spectrum which applies for $k \gg K_*$, irrespective of whether the initial wavenumber satisfies the WKBJ condition $k_* \gg K_*$ or not.
Log–log representation of the IGW spectrum in figure 6(c), i.e. for  $\omega =2f$ and ${Ro}=0.049$ obtained from the kinetic equation (red lines) and Boussinesq simulations (black lines); (a) $b_+(k,t)=b(k,t)$, corresponding to the upper nappe of the dispersion-relation cone, (b) $b_-(k,t)=b(-k,t)$, corresponding to the lower nappe. The curves correspond to the times shown in figure 6(c) and are successively shifted downwards by half a decade for clarity.

4.3. Forced problem
We now turn to a forced problem in which IGWs with random phases are continuously forced along a ring in wavenumber space until they reach a statistically steady state. For the corresponding problem in the WKBJ limit  $k_{h*} \gg K_{h*}$, the forced diffusion equation has an equilibrium power-law solution $b_\pm (k) \propto k^{-2}$. In general, when the forcing wavenumber is of the order of $K_{h*}$, this power law applies only to the tail of the spectrum; at small and intermediate wavenumbers, the equilibrium spectrum is determined by the steady solution of forced scattering equation
 \begin{equation} {\partial_t \hat{{\boldsymbol{b}}}_0}={2{\rm \pi}}k^2\int_0^\infty {\hat{\boldsymbol{\sigma}}}_{0}(k,k')\,\hat{{\boldsymbol{b}}}_0({k}',t)\mathrm{d}{k}' -\varSigma(k)\,\hat{{\boldsymbol{b}}}_0({k},t)+{\boldsymbol{\mathcal{F}}},\end{equation}
where the forcing term
 \begin{equation} {\boldsymbol{\mathcal{F}}}=\left( \begin{array}{c} A\delta(k-k_*)\\ 0 \end{array} \right), \end{equation}
with  $A$ an arbitrary amplitude, is applied only to upward-propagating waves. We solve this equation numerically until an approximately steady state is reached and show the equilibrium spectrum $b_\pm (k)$ obtained in figure 8 The parameters chosen are $k_{{h}*}\simeq K_{{h}*}=4$ for the forcing wavenumber, $\omega =2f$ and ${Ro}=0.049$ (note that the equilibrium $b_\pm (k)$ depends only on the shape of the quasigeostrophic-flow spectrum and not on its amplitude). The energy spectrum follows a $k^{-2}$ power law for large $k$, as expected from the WKBJ results of Kafiabad et al. (Reference Kafiabad, Savva and Vanneste2019). While the $k^{-2}$ spectrum is an exact stationary solution of the diffusion equation, for the scattering equation it only holds approximately for $k \gg K_*$. In our set-up, the non-diffusive, finite- $k$ effects arise only in a range of wavenumbers close to the forcing wavenumber. Note that Kafiabad et al. (Reference Kafiabad, Savva and Vanneste2019) confirm the validity of the $k^{-2}$ prediction against Boussinesq solutions and discuss the implications for the interpretation of atmosphere and ocean observations.
Equilibrium spectra  $b_+(k)$ (blue line) and $b_-(k)$ (red line) in a forced solution of the kinetic equation with forcing wavenumber $k_{{h}*} \simeq K_{h*}$ and $\omega =2f$.

Figure 8 shows the spectrum on both the upper and lower nappes of the cones and makes it clear that the stationary spectra of upward- and downward-propagating waves are identical for all wavenumbers outside the immediate vicinity of the forcing wavenumber  $k_*$. This is the counterpart for the forced problem to the observation in § 4.2 that the kinetic equation predicts equipartition of the wave energy between upward- and downward-propagating IGWs.
4.4. Barotropic flow
It is worth contrasting scattering by a three-dimensional quasigeostrophic flow that is approximately isotropic in scaled coordinates  $(x,y,Nz/f)$, as considered above, with scattering by a barotropic ( $z$-independent) flow as considered in Savva & Vanneste (Reference Savva and Vanneste2018). In a barotropic flow, the energy transfers, governed by the cross-section in (2.27), are restricted to IGWs with a fixed vertical wavenumber $k_3$. As result, instead of spreading over the entire constant-frequency cone, energy spreads on a circle, the intersection of the cone with the plane $k_3 = \mathrm {const}$. There is therefore no energy cascade across scales and the effect of scattering is limited to a directional spreading of the wave energy, leading ultimately to an isotropic wave field if the geostrophic flow is isotropic (see Savva & Vanneste (Reference Savva and Vanneste2018) and Danioux & Vanneste (Reference Danioux and Vanneste2016) for numerical results). An initial-value problem leads to a statistically stationary IGW field, while a constant forcing leads to a growing field in the absence of dissipation. This contrasts with the dynamics in a three-dimensional flow with vertical shear where a decaying energy is obtained for the initial-value problem and a statistically steady state for the forced problem. This highlights the importance of IGWs having a non-compact constant-frequency surface, unlike many other familiar waves.
5. Discussion
The main result of this paper is the (vector) kinetic equation (3.10) governing the energy transfers between upward- and downward-propagating IGWs induced by a turbulent quasigeostrophic flow. The components  $\sigma _{\pm }$ of the scattering cross-section tensor, which determine this equation completely, are given in (3.6). They depend (linearly) on a single statistic of the quasigeostrophic flow, the kinetic energy spectrum $\hat {E}_{K}({\boldsymbol {k}})$. The main assumption made, that of a small Rossby number, implies that the quasigeostrophic flow evolves slowly enough to be effectively time independent. Accordingly, energy transfers are restricted to IGWs with the same frequency and can be interpreted as resulting from the resonant triadic interactions between two IGWs and a zero-frequency quasigeostrophic (vortical) mode. In wavenumber space, these interactions cause the spreading of IGWs energy along the constant-frequency cones, leading to an isotropisation of the wave energy in the horizontal when the quasigeostrophic flow is horizontally isotropic, and to a cascade to high wavenumbers, that is, to small scales. In this paper, we focus on the scale cascade by considering the azimuthally averaged IGW energy spectrum; we leave the study of the process of isotropisation and, in particular, the comparison between its time scale and that of the scale cascade, for future work. The behaviour of IGWs in quasigeostrophic flows with marked anisotropy can also be described by the kinetic equation and is of interest for its relevance, e.g. to IGWs propagating the Gulf Stream region.
In earlier work (Kafiabad et al. Reference Kafiabad, Savva and Vanneste2019) we examined IGW scattering in the same set-up as here, but with the additional WKBJ assumption of IGW scales much smaller than the typical scale of the quasigeostrophic flow. Starting from the familiar phase-space transport equation, we derived a diffusion equation for the evolution of IGW energy in wavenumber space. This equation is a limiting form of the kinetic equation derived here, as can be checked directly (Savva Reference Savva2020). In a probabilistic interpretation, the kinetic equation describes a continuous-time random walk, with finite steps in wavenumber space resulting from catalytic interactions, while the diffusion equation describes its Brownian approximation, obtained in the limit of small steps corresponding to energy transfers that are local in wavenumber space. In this interpretation, the random walk has in fact two states, corresponding the two nappes of the cone or, physically, to IGWs propagating either upwards or downwards. Transitions between the two states, that is, transfers between upward- and downward-propagating IGWs are ruled out in the WKBJ limit, but are captured by the kinetic equation (3.10).
The results of this paper have potential implications for atmosphere and ocean modelling. As discussed in Kafiabad et al. (Reference Kafiabad, Savva and Vanneste2019), the scattering of IGWs by geostrophic turbulence leads to a  $k^{-2}$ energy spectrum that is reminiscent of the spectra observed in the atmospheric mesoscale and ocean submesoscale ranges. The results of the present paper make it possible to examine this more fully, by enabling predictions of the IGW statistics across all scales including those that overlap with the geostrophic flow scales. They may also be useful for the parameterisation of IGWs, by providing a quantification of the forward energy flux that results from scattering by unresolved flow. We note that the probabilistic interpretation of the kinetic and diffusion equations mentioned above offers a straightforward route towards stochastic parameterisations of this scattering, in which energy is transferred between wavevectors selected at random according to the scattering cross-section.
We conclude by pointing out three problems worthy of further study. The first is the relative importance of the scattering by the quasigeostrophic flow and of the nonlinear wave–wave interactions which we have neglected at the outset by linearising the equations of motion. The second concerns the weak energy transfers across constant-frequency cones that stem from the slow time dependence of the flow. Over long time scales, these transfers combine with the along-cone transfers of this paper to yield in a distribution of energy in wavenumber space which could be compared with atmosphere–ocean observations. (See Dong, Bühler & Smith (Reference Dong, Bühler and Smith2020) for recent results for shallow-water waves in the WKBJ regime.) The third problem concerns the combined effect of scattering with the transport by the group velocity that arises when the IGW field is not statistically homogeneous, unlike in the numerical simulations of § 4. The kinetic equation (3.10) captures both processes but needs to be solved in the  $({\boldsymbol {x}},{\boldsymbol {k}})$-phase space, a challenging task even when symmetry assumptions are made to reduce the dimension of this space (see Savva & Vanneste (Reference Savva and Vanneste2018) for an application of the kinetic equation to an inhomogeneous IGW field in the simpler case of a barotropic flow).
Acknowledgements
We thank the three referees for their useful comments.
Funding
H.A.K. and J.V. are supported by the UK Natural Environment Research Council grant NE/R006652/1. M.A.C.S. was supported by The Maxwell Institute Graduate School in Analysis and its Applications, a Centre for Doctoral Training funded by the UK Engineering and Physical Sciences Research Council (grant EP/L016508/01), the Scottish Funding Council, Heriot-Watt University and the University of Edinburgh. This work used the ARCHER UK National Supercomputing Service.
Declaration of interests
The authors report no conflict of interest.
Appendix A. Derivation of the kinetic equation
A.1. Evolution equation for $\boldsymbol{\mathsf{W}}$

We start with the Euler–Boussinesq equations written in the form (2.9), with the linear operator  ${\boldsymbol{\mathsf{L}}}$ defined in (2.10) and the operator ${\boldsymbol{\mathsf{N}}}({\boldsymbol {x}},{\boldsymbol {\nabla }}_{{\boldsymbol {x}}})$ grouping the background-flow terms given in terms of its action on ${\boldsymbol {\phi }}=(\gamma ,\delta )^{\mathrm {T}}$ by the four components
 \begin{align}
{{\mathsf{N}}}_{11}\gamma&=(\varOmega{\boldsymbol{\nabla}})^{{-}2}\partial_z
\left\{f^2\partial_z\left([(\psi_x\partial_y-\psi_y\partial_x)-(({\boldsymbol{\nabla}}_{h}^2\psi_x)\partial_y-({\boldsymbol{\nabla}}_{h}^2\psi_y)\partial_x){\boldsymbol{\nabla}}_{h}^{{-}2}]\gamma\right)\right. \nonumber\\ &\quad +
\left.f^2{\boldsymbol{\nabla}}_{h}^2\left([(\psi_{xz}\partial_y-\psi_{yz}\partial_x){\boldsymbol{\nabla}}_{h}^{{-}2}]\gamma
\right)+N^2{\boldsymbol{\nabla}}_{h}^2\left((\psi_x\partial_y-\psi_y\partial_x)\partial_z^{{-}1}\gamma\right)
\right\} ,\end{align}
\begin{align}
{{\mathsf{N}}}_{11}\gamma&=(\varOmega{\boldsymbol{\nabla}})^{{-}2}\partial_z
\left\{f^2\partial_z\left([(\psi_x\partial_y-\psi_y\partial_x)-(({\boldsymbol{\nabla}}_{h}^2\psi_x)\partial_y-({\boldsymbol{\nabla}}_{h}^2\psi_y)\partial_x){\boldsymbol{\nabla}}_{h}^{{-}2}]\gamma\right)\right. \nonumber\\ &\quad +
\left.f^2{\boldsymbol{\nabla}}_{h}^2\left([(\psi_{xz}\partial_y-\psi_{yz}\partial_x){\boldsymbol{\nabla}}_{h}^{{-}2}]\gamma
\right)+N^2{\boldsymbol{\nabla}}_{h}^2\left((\psi_x\partial_y-\psi_y\partial_x)\partial_z^{{-}1}\gamma\right)
\right\} ,\end{align}
 \begin{align}{{\mathsf{N}}}_{12}
\delta&=\nabla^{{-}2}(\,f\partial_z)\left\{\partial_z\left
([(({\boldsymbol{\nabla}}_{h}^2\psi_x)\partial_x+({\boldsymbol{\nabla}}_{h}^2\psi_y)\partial_y){\boldsymbol{\nabla}}_{h}^{{-}2}+({\boldsymbol{\nabla}}_{h}^2\psi)\right.\right. \nonumber\\
&\quad - \left. \left.(\psi_{xz}\partial_x+\psi_{yz}\partial_y+{\boldsymbol{\nabla}}_{h}^2\psi_z)\partial_z^{{-}1}]\delta\right)-{\boldsymbol{\nabla}}_{h}^2\left(
[(\psi_{xz}\partial_x+\psi_{yz}\partial_y){\boldsymbol{\nabla}}_{h}^{{-}2}-\psi_{zz}\partial_z^{{-}1}]\delta
\right)\right\} ,\end{align}
\begin{align}{{\mathsf{N}}}_{12}
\delta&=\nabla^{{-}2}(\,f\partial_z)\left\{\partial_z\left
([(({\boldsymbol{\nabla}}_{h}^2\psi_x)\partial_x+({\boldsymbol{\nabla}}_{h}^2\psi_y)\partial_y){\boldsymbol{\nabla}}_{h}^{{-}2}+({\boldsymbol{\nabla}}_{h}^2\psi)\right.\right. \nonumber\\
&\quad - \left. \left.(\psi_{xz}\partial_x+\psi_{yz}\partial_y+{\boldsymbol{\nabla}}_{h}^2\psi_z)\partial_z^{{-}1}]\delta\right)-{\boldsymbol{\nabla}}_{h}^2\left(
[(\psi_{xz}\partial_x+\psi_{yz}\partial_y){\boldsymbol{\nabla}}_{h}^{{-}2}-\psi_{zz}\partial_z^{{-}1}]\delta
\right)\right\} ,\end{align}
 \begin{align} {{\mathsf{N}}}_{21}\gamma&={-}2f(\varOmega{\boldsymbol{\nabla}})^{{-}2}\partial_{zz}\left\{ [\psi_{yy}\partial_{xx}-2\psi_{xy}\partial_{xy}+\psi_{xx}\partial_{yy}]{\boldsymbol{\nabla}}_{h}^{{-}2}\gamma \right\}, \end{align}
 \begin{align} {{\mathsf{N}}}_{22}\,\delta&=\nabla^{{-}2}\left\{\partial_{zz}\left( \left[(\psi_x\partial_y-\psi_y\partial_x)+2((\psi_{xx}-\psi_{yy})\partial_{xy}-\psi_{xy}(\partial_{xx}-\partial_{yy})){\boldsymbol{\nabla}}_{h}^{{-}2}\right.\right.\right.\nonumber\\ &\quad -\left.\left.\left.(\psi_{xz}\partial_y-\psi_{yz}\partial_x)\partial_z^{{-}1}\right]\delta \right)+{\boldsymbol{\nabla}}_{h}^2\left( \left[(\psi_x\partial_y-\psi_y\partial_x)+(\psi_{xz}\partial_y-\psi_{yz}\partial_x)\partial_z^{{-}1}\right]\delta \right)\right\}, \end{align}
with  $\varOmega =\varOmega ({\boldsymbol {\nabla }})$ defined in (2.4). We derive an evolution equation for the (scaled) Wigner transform of ${\boldsymbol {\phi }}$ differentiating (2.11) with respect to $t$ and substituting (2.10) to obtain
 \begin{align} & \varepsilon \partial_t
\boldsymbol{\mathsf{W}}({\boldsymbol{x}},{\boldsymbol{k}},t)
\end{align}
\begin{align} & \varepsilon \partial_t
\boldsymbol{\mathsf{W}}({\boldsymbol{x}},{\boldsymbol{k}},t)
\end{align}
 \begin{align}
&\qquad ={\varepsilon}\int_{\mathbb{R}^3}
\mathrm{e}^{\mathrm{i}{\boldsymbol{k}}\boldsymbol{\cdot}{\boldsymbol{y}}}\left({\partial_t{\boldsymbol{\phi}}\left(t,{\boldsymbol{x}}-\frac{\varepsilon{\boldsymbol{y}}}{2}\right)}{}{\boldsymbol{\phi}}^\mathrm{T}
\left(t,{\boldsymbol{x}}+
\frac{\varepsilon{\boldsymbol{y}}}{2}\right)\right.\notag\\
&\qquad \quad
+\left.{\boldsymbol{\phi}}\left(t,{\boldsymbol{x}}-\frac{\varepsilon{\boldsymbol{y}}}{2}\right)
{\partial_t{\boldsymbol{\phi}}^\mathrm{T}\left(t,{\boldsymbol{x}}+\frac{\varepsilon{\boldsymbol{y}}}{2}\right)}{}
\right)\frac{\mathrm{d}{\boldsymbol{y}}}{(2{\rm \pi})^3}
\notag\\
&\qquad ={-}\int_{\mathbb{R}^3}
\mathrm{e}^{\mathrm{i}{\boldsymbol{k}}\boldsymbol{\cdot}{\boldsymbol{y}}}
\left( \left( {\boldsymbol{\mathsf{L}}}
(\varepsilon{\boldsymbol{\nabla}}_{{\boldsymbol{x}}})+\varepsilon^{1/2}{\boldsymbol{\mathsf{N}}}
\left(\frac{{\boldsymbol{x}}}{\varepsilon}-\frac{{\boldsymbol{y}}}{2},\varepsilon{\boldsymbol{\nabla}}_{{\boldsymbol{x}}},\frac{t}{\varepsilon^{1/2}}\right)
\right)\right.\notag\\ &\qquad\quad\times\left.
{\boldsymbol{\phi}}\left(t,{\boldsymbol{x}}-\frac{\varepsilon{\boldsymbol{y}}}{2}\right)
\right)
{\boldsymbol{\phi}}^\mathrm{T}\left(t,{\boldsymbol{x}}+\frac{\varepsilon{\boldsymbol{y}}}{2}\right)\frac{\mathrm{d}{\boldsymbol{y}}}{(2{\rm \pi})^3}+\text{c.c.},
\end{align}
\begin{align}
&\qquad ={\varepsilon}\int_{\mathbb{R}^3}
\mathrm{e}^{\mathrm{i}{\boldsymbol{k}}\boldsymbol{\cdot}{\boldsymbol{y}}}\left({\partial_t{\boldsymbol{\phi}}\left(t,{\boldsymbol{x}}-\frac{\varepsilon{\boldsymbol{y}}}{2}\right)}{}{\boldsymbol{\phi}}^\mathrm{T}
\left(t,{\boldsymbol{x}}+
\frac{\varepsilon{\boldsymbol{y}}}{2}\right)\right.\notag\\
&\qquad \quad
+\left.{\boldsymbol{\phi}}\left(t,{\boldsymbol{x}}-\frac{\varepsilon{\boldsymbol{y}}}{2}\right)
{\partial_t{\boldsymbol{\phi}}^\mathrm{T}\left(t,{\boldsymbol{x}}+\frac{\varepsilon{\boldsymbol{y}}}{2}\right)}{}
\right)\frac{\mathrm{d}{\boldsymbol{y}}}{(2{\rm \pi})^3}
\notag\\
&\qquad ={-}\int_{\mathbb{R}^3}
\mathrm{e}^{\mathrm{i}{\boldsymbol{k}}\boldsymbol{\cdot}{\boldsymbol{y}}}
\left( \left( {\boldsymbol{\mathsf{L}}}
(\varepsilon{\boldsymbol{\nabla}}_{{\boldsymbol{x}}})+\varepsilon^{1/2}{\boldsymbol{\mathsf{N}}}
\left(\frac{{\boldsymbol{x}}}{\varepsilon}-\frac{{\boldsymbol{y}}}{2},\varepsilon{\boldsymbol{\nabla}}_{{\boldsymbol{x}}},\frac{t}{\varepsilon^{1/2}}\right)
\right)\right.\notag\\ &\qquad\quad\times\left.
{\boldsymbol{\phi}}\left(t,{\boldsymbol{x}}-\frac{\varepsilon{\boldsymbol{y}}}{2}\right)
\right)
{\boldsymbol{\phi}}^\mathrm{T}\left(t,{\boldsymbol{x}}+\frac{\varepsilon{\boldsymbol{y}}}{2}\right)\frac{\mathrm{d}{\boldsymbol{y}}}{(2{\rm \pi})^3}+\text{c.c.},
\end{align}
where c.c. denotes the complex conjugate of the preceding term. This equation can be closed for  $\boldsymbol{\mathsf{W}} ({\boldsymbol {x}},{\boldsymbol {k}},t)$ by introducing the Fourier transform
 \begin{equation} \hat{{\boldsymbol{\phi}}}({\boldsymbol{k}},t)=\frac{1}{(2{\rm \pi})^3} \int_{\mathbb{R}^3}\mathrm{e}^{\mathrm{i}{\boldsymbol{k}}\boldsymbol{\cdot}{\boldsymbol{x}}}{\boldsymbol{\phi}}({\boldsymbol{x}},t) \, \mathrm{d} {\boldsymbol{x}}\quad \text{and} \quad {\boldsymbol{\phi}}({\boldsymbol{x}},t)=\int_{\mathbb{R}^3}\mathrm{e}^{-\mathrm{i} {\boldsymbol{k}}\boldsymbol{\cdot}{\boldsymbol{x}}}\hat{{\boldsymbol{\phi}}}({\boldsymbol{k}},t) \, \mathrm{d}{\boldsymbol{k}} \end{equation}
and noting that the Fourier representation
 \begin{equation} \boldsymbol{\mathsf{W}}({\boldsymbol{x}},{\boldsymbol{k}},t)=\varepsilon^{{-}3}\int_{\mathbb{R}^3}\mathrm{e}^{\mathrm{i}{\boldsymbol{p}}\boldsymbol{\cdot}{\boldsymbol{x}}}\hat{{\boldsymbol{\phi}}}(- {{\boldsymbol{k}}}/{\varepsilon}-{{\boldsymbol{p}}}/{2},t)\hat{{\boldsymbol{\phi}}}^*(- {{\boldsymbol{k}}}/{\varepsilon}+{{\boldsymbol{p}}}/{2},t) \, \mathrm{d}{\boldsymbol{p}}, \end{equation}
with  $*$ denoting conjugate transpose, can be deduced straightforwardly from (2.11) (Ryzhik et al. Reference Ryzhik, Papanicolaou and Keller1996). Rewriting ${\boldsymbol {\phi }}$ in terms of $\hat {{\boldsymbol {\phi }}}$ and making use of (A5), we rewrite (A3) as
 \begin{align}
&\varepsilon\partial_t\boldsymbol{\mathsf{W}}({\boldsymbol{x}},{\boldsymbol{k}},t)+
\overbrace{\left({\boldsymbol{\mathsf{L}}}\left(\mathrm{i}{\boldsymbol{k}}+\frac{\varepsilon}{2}{\boldsymbol{\nabla}}_{{\boldsymbol{x}}}\right)
\boldsymbol{\mathsf{W}}({\boldsymbol{x}},{\boldsymbol{k}})+\text{c.c.}\right)}^{\textstyle
:=\mathcal{Q}^\varepsilon \boldsymbol{\mathsf{W}}}\nonumber\\
&\quad +\varepsilon^{1/2}\left(\underbrace{
\int_{\mathbb{R}^3}\mathrm{e}^{-\mathrm{i}{\boldsymbol{p}}\boldsymbol{\cdot}{\boldsymbol\xi}}{\hat{\boldsymbol{\mathsf{N}}}}({\boldsymbol{p}},\mathrm{i}\left({\boldsymbol{k}}+
\frac{{\boldsymbol{p}}}{2}\right)+\frac{\varepsilon}{2}{\boldsymbol{\nabla}}_{{\boldsymbol{x}}},\tau)\boldsymbol{\mathsf{W}}({\boldsymbol{x}},{\boldsymbol{k}}
+\frac{{\boldsymbol{p}}}{2}) \, \mathrm{d}{\boldsymbol{p}}
+\text{c.c.}}_{\textstyle :=\mathcal{P}^\varepsilon
\boldsymbol{\mathsf{W}}} \right)=0,
\end{align}
\begin{align}
&\varepsilon\partial_t\boldsymbol{\mathsf{W}}({\boldsymbol{x}},{\boldsymbol{k}},t)+
\overbrace{\left({\boldsymbol{\mathsf{L}}}\left(\mathrm{i}{\boldsymbol{k}}+\frac{\varepsilon}{2}{\boldsymbol{\nabla}}_{{\boldsymbol{x}}}\right)
\boldsymbol{\mathsf{W}}({\boldsymbol{x}},{\boldsymbol{k}})+\text{c.c.}\right)}^{\textstyle
:=\mathcal{Q}^\varepsilon \boldsymbol{\mathsf{W}}}\nonumber\\
&\quad +\varepsilon^{1/2}\left(\underbrace{
\int_{\mathbb{R}^3}\mathrm{e}^{-\mathrm{i}{\boldsymbol{p}}\boldsymbol{\cdot}{\boldsymbol\xi}}{\hat{\boldsymbol{\mathsf{N}}}}({\boldsymbol{p}},\mathrm{i}\left({\boldsymbol{k}}+
\frac{{\boldsymbol{p}}}{2}\right)+\frac{\varepsilon}{2}{\boldsymbol{\nabla}}_{{\boldsymbol{x}}},\tau)\boldsymbol{\mathsf{W}}({\boldsymbol{x}},{\boldsymbol{k}}
+\frac{{\boldsymbol{p}}}{2}) \, \mathrm{d}{\boldsymbol{p}}
+\text{c.c.}}_{\textstyle :=\mathcal{P}^\varepsilon
\boldsymbol{\mathsf{W}}} \right)=0,
\end{align}
where  ${\boldsymbol {\xi }}={\boldsymbol {x}}/\varepsilon$ and $\tau =t/\varepsilon ^{1/2}$. In (A6) we introduced the matrix ${\hat {\boldsymbol{\mathsf{N}}}}$, the Fourier counterpart to the operator ${\boldsymbol{\mathsf{N}}}$, defined by the equality
 \begin{equation} {\boldsymbol{\mathsf{N}}}({\boldsymbol{x}}, {\boldsymbol{\nabla}}_{{\boldsymbol{x}}}){\boldsymbol{\phi}}({\boldsymbol{x}}) = \iint \mathrm{e}^{-\mathrm{i} ({\boldsymbol{q}}+{\boldsymbol{p}}) \boldsymbol{\cdot} {\boldsymbol{x}}}{\hat{\boldsymbol{\mathsf{N}}}}({\boldsymbol{q}},-\mathrm{i}{\boldsymbol{p}})\hat{{\boldsymbol{\phi}}}({\boldsymbol{p}}) \, \mathrm{d}{\boldsymbol{q}}\,\mathrm{d}{\boldsymbol{p}} \end{equation}
holding for all  ${\boldsymbol {\phi }}({\boldsymbol {x}})$. Some care needs to be exercised in deducing the components of ${\hat {\boldsymbol{\mathsf{N}}}}$ from those of ${\boldsymbol{\mathsf{N}}}$ in (A1) because spatial derivatives act both on the components of ${\boldsymbol {\phi }}(x)$ and on $\psi ({\boldsymbol {x}})$. We note that the components of ${\boldsymbol{\mathsf{N}}}({\boldsymbol {x}},{\boldsymbol {\nabla }}_{{\boldsymbol {x}}}) {\boldsymbol {\phi }}$ are sums of the form
 \begin{equation} {{\mathsf{N}}}_{ij}({\boldsymbol{x}},{\boldsymbol{\nabla}}_{{\boldsymbol{x}}}) \phi_j({\boldsymbol{x}})=\sum_k \partial_{{\boldsymbol{x}}}^{{\boldsymbol{\alpha}}}\left[G_{ij}^k({\boldsymbol{x}})\partial_{{\boldsymbol{x}}}^{{\boldsymbol{\beta}}}\phi_j({\boldsymbol{x}})\right], \end{equation}
where  ${\boldsymbol {\alpha }},\,{\boldsymbol {\beta }}$ are multi-indices (depending on $(i,j,k)$) and $G_{ij}^k({\boldsymbol {x}})$ depends linearly on $\psi ({\boldsymbol {x}})$. We then have
 \begin{align} {{\mathsf{N}}}_{ij}({\boldsymbol{x}}, {\boldsymbol{\nabla}}_{{\boldsymbol{x}}}) \phi_j &= \sum_k \partial_{{\boldsymbol{x}}}^{{\boldsymbol{\alpha}}}\left[\int_{\mathbb{R}^3} \mathrm{e}^{-\mathrm{i}{\boldsymbol{q}} \boldsymbol{\cdot} {\boldsymbol{x}}}\hat{G}_{ij}^k ({\boldsymbol{q}})\mathrm{d}{\boldsymbol{q}}\,\partial_{{\boldsymbol{x}}}^{{\boldsymbol{\beta}}}\,\int e^{-\mathrm{i}{\boldsymbol{p}} \boldsymbol{\cdot} {\boldsymbol{x}} }\hat{\phi}_j({\boldsymbol{p}})\, \mathrm{d}{\boldsymbol{p}}\right] \nonumber\\ &= \sum_k \iint_{\mathbb{R}^3} \mathrm{e}^{-\mathrm{i}({\boldsymbol{q}}+{\boldsymbol{p}}) \boldsymbol{\cdot} {\boldsymbol{x}}}(-\mathrm{i}({\boldsymbol{q}}+{\boldsymbol{p}}))^{{\boldsymbol{\alpha}}}(-\mathrm{i}{\boldsymbol{p}})^{{\boldsymbol{\beta}}}\hat{G}_{ij}^k ({\boldsymbol{q}})\hat{\phi}_j({\boldsymbol{p}}) \, \mathrm{d}{\boldsymbol{q}}\,\mathrm{d}{\boldsymbol{p}}, \end{align}
from which we deduce the formula
 \begin{equation} {\hat{{\mathsf{N}}}}_{ij}({\boldsymbol{q}},-\mathrm{i}{\boldsymbol{p}}) = \sum_k (-\mathrm{i}({\boldsymbol{q}}+{\boldsymbol{p}}))^{{\boldsymbol{\alpha}}}(-\mathrm{i}{\boldsymbol{p}})^{{\boldsymbol{\beta}}}\hat{G}_{ij}^k ({\boldsymbol{q}}), \end{equation}
which makes it possible to compute  ${\hat {\boldsymbol{\mathsf{N}}}}$ from (A1). Since ${\hat {\boldsymbol{\mathsf{N}}}}$ is a linear function of $\hat {\psi }$, we can define a matrix ${\hat {\boldsymbol{\mathsf{U}}}}({\boldsymbol {q}},\mathrm {i}{\boldsymbol {p}})$ by
 \begin{equation} {\hat{\boldsymbol{\mathsf{N}}}}({\boldsymbol{q}},\mathrm{i}{\boldsymbol{p}})={\hat{\boldsymbol{\mathsf{U}}}}({\boldsymbol{q}},\mathrm{i}{\boldsymbol{p}})\hat{\psi}({\boldsymbol{q}}). \end{equation}
The computation of the cross-section below requires this matrix with arguments  ${\boldsymbol {q}}={\boldsymbol {k}}'-{\boldsymbol {k}}$ and $\mathrm {i} {\boldsymbol {p}} = \mathrm {i} {\boldsymbol {k}}'$. We therefore record the components of ${\hat {\boldsymbol{\mathsf{U}}}}({\boldsymbol {k}}'-{\boldsymbol {k}},\mathrm {i}{\boldsymbol {k}}')$, found to be
 \begin{align}
&{\hat{{\mathsf{U}}}}_{11}({\boldsymbol{k}}'-{\boldsymbol{k}},\mathrm{i}{\boldsymbol{k}}')\notag\\
&\quad =\frac{\hat{{\boldsymbol{k}}}_3\boldsymbol{\cdot}{\boldsymbol{k}}_{h}'\times{\boldsymbol{k}}_{h}}{|{\boldsymbol{k}}_{h}'|^2}\frac{|k_3|^2}{|{\boldsymbol{k}}|^2}\left[\frac{f^2}{\omega^2}(2{\boldsymbol{k}}_{h}\boldsymbol{\cdot}{\boldsymbol{k}}_{h}'-|{\boldsymbol{k}}_{h}||{\boldsymbol{k}}_{h}'|\textrm{sgn}(k_3k_3'))+\frac{N^2}{\omega^2}\frac{|{\boldsymbol{k}}_{h}|^2|{\boldsymbol{k}}_{h}'|^2}{k_3k_3'}
\right], \end{align}
\begin{align}
&{\hat{{\mathsf{U}}}}_{11}({\boldsymbol{k}}'-{\boldsymbol{k}},\mathrm{i}{\boldsymbol{k}}')\notag\\
&\quad =\frac{\hat{{\boldsymbol{k}}}_3\boldsymbol{\cdot}{\boldsymbol{k}}_{h}'\times{\boldsymbol{k}}_{h}}{|{\boldsymbol{k}}_{h}'|^2}\frac{|k_3|^2}{|{\boldsymbol{k}}|^2}\left[\frac{f^2}{\omega^2}(2{\boldsymbol{k}}_{h}\boldsymbol{\cdot}{\boldsymbol{k}}_{h}'-|{\boldsymbol{k}}_{h}||{\boldsymbol{k}}_{h}'|\textrm{sgn}(k_3k_3'))+\frac{N^2}{\omega^2}\frac{|{\boldsymbol{k}}_{h}|^2|{\boldsymbol{k}}_{h}'|^2}{k_3k_3'}
\right], \end{align}
 \begin{align}&{\hat{{\mathsf{U}}}}_{22}({\boldsymbol{k}}'-{\boldsymbol{k}},\mathrm{i}{\boldsymbol{k}}')\notag\\
&\quad=\frac{\hat{{\boldsymbol{k}}}_3\boldsymbol{\cdot}{\boldsymbol{k}}_{h}'\times{\boldsymbol{k}}_{h}}{|{\boldsymbol{k}}_{h}'|^2}\frac{|k_3|^2}{|{\boldsymbol{k}}|^2}\left[2{\boldsymbol{k}}_{h}\boldsymbol{\cdot}{\boldsymbol{k}}_{h}'-|{\boldsymbol{k}}_{h}||{\boldsymbol{k}}_{h}'|\textrm{sgn}(k_3k_3')+\frac{|{\boldsymbol{k}}_{h}|^2|{\boldsymbol{k}}_{h}'|^2}{k_3k_3'}\right],
\end{align}
\begin{align}&{\hat{{\mathsf{U}}}}_{22}({\boldsymbol{k}}'-{\boldsymbol{k}},\mathrm{i}{\boldsymbol{k}}')\notag\\
&\quad=\frac{\hat{{\boldsymbol{k}}}_3\boldsymbol{\cdot}{\boldsymbol{k}}_{h}'\times{\boldsymbol{k}}_{h}}{|{\boldsymbol{k}}_{h}'|^2}\frac{|k_3|^2}{|{\boldsymbol{k}}|^2}\left[2{\boldsymbol{k}}_{h}\boldsymbol{\cdot}{\boldsymbol{k}}_{h}'-|{\boldsymbol{k}}_{h}||{\boldsymbol{k}}_{h}'|\textrm{sgn}(k_3k_3')+\frac{|{\boldsymbol{k}}_{h}|^2|{\boldsymbol{k}}_{h}'|^2}{k_3k_3'}\right],
\end{align}
 \begin{align}&{\hat{{\mathsf{U}}}}_{12}({\boldsymbol{k}}'-{\boldsymbol{k}},\mathrm{i}{\boldsymbol{k}}')=\frac{f}{|{\boldsymbol{k}}_{h}'|^2}\frac{|k_3|^2}{|{\boldsymbol{k}}|^2}\left[(k_3'-k_3)^2\frac{|{\boldsymbol{k}}_{h}'||{\boldsymbol{k}}_{h}|}{|k_3'||k_3|}-|{\boldsymbol{k}}_{h}'-{\boldsymbol{k}}_{h}|^2 \right] {\boldsymbol{k}}_{h}'\boldsymbol{\cdot}{\boldsymbol{k}}_{h}, \end{align}
 \begin{gather}{\hat{{\mathsf{U}}}}_{21}({\boldsymbol{k}}'-{\boldsymbol{k}},\mathrm{i}{\boldsymbol{k}}')=2\frac{f}{\omega^2}\frac{|k_3|^2}{|{\boldsymbol{k}}|^2}\frac{|{\boldsymbol{k}}_{h}'\times{\boldsymbol{k}}_{h}|^2}{|{\boldsymbol{k}}_{h}'|^2}, \end{gather}
after a lengthy calculation that uses  $\varOmega (\mathrm {i}{\boldsymbol {k}})=\omega ({\boldsymbol {k}})$.
A.2. Multiscale asymptotics
We now derive the asymptotic limit of (A6) using a multiscale expansion. We introduce the expansion (2.12) into (A6), expanding the differential operators as
 \begin{equation} {\boldsymbol{\nabla}}_{{\boldsymbol{x}}}\mapsto{\boldsymbol{\nabla}}_{{\boldsymbol{x}}}+\varepsilon^{{-}1}{\boldsymbol{\nabla}}_{\boldsymbol\xi} \quad \text{and} \quad \partial_t\mapsto\partial_t+\varepsilon^{{-}1/2}\partial_\tau, \end{equation}
where  ${\boldsymbol {x}}$ and $\boldsymbol \xi$, $t$ and $\tau$ are treated as independent variables, leading to the expansion
 \begin{equation} \mathcal{Q}^\varepsilon=\mathcal{Q}_0+\varepsilon\mathcal{Q}_1+O(\varepsilon^2),\quad \mathcal{P}^\varepsilon=\mathcal{P}_0+\varepsilon\mathcal{P}_1+{O}(\varepsilon^2) \end{equation}
of the operators in (A6). It turns out that only the leading-order term  $\mathcal {P}_0$ is required for the derivation of the kinetic equation.
The operators in (A14a,b) can be written explicitly through their action on an arbitrary function  $Z({\boldsymbol {x}},{\boldsymbol {\xi }},{\boldsymbol {k}})$ as follows:
 \begin{gather} \tilde{\mathcal{Q}}_0Z({\boldsymbol{x}},{\boldsymbol{\xi}},{\boldsymbol{k}})= {\boldsymbol{\mathsf{L}}}(\mathrm{i} {\boldsymbol{k}}+\tfrac{1}{2}{\boldsymbol{\nabla}}_{\boldsymbol\xi})Z({\boldsymbol{x}},{\boldsymbol{\xi}},{\boldsymbol{k}})+\text{c.c.} \end{gather}
 \begin{gather}\tilde{\mathcal{Q}}_1Z({\boldsymbol{x}},{\boldsymbol{\xi}},{\boldsymbol{k}})=\frac{1}{2\mathrm{i}{}}\left[{\boldsymbol{\nabla}}_{{\boldsymbol{k}}}{\boldsymbol{\mathsf{L}}}(\mathrm{i} {\boldsymbol{k}}+\frac{1}{2}{\boldsymbol{\nabla}}_{\boldsymbol\xi})\right] \boldsymbol{\cdot}{\boldsymbol{\nabla}}_{{\boldsymbol{x}}}Z({\boldsymbol{x}},{\boldsymbol{\xi}},{\boldsymbol{k}}) +\text{c.c.} \end{gather}
 \begin{gather}\tilde{\mathcal{P}}_0Z({\boldsymbol{x}},{\boldsymbol{\xi}},{\boldsymbol{k}})=\int_{\mathbb{R}^3}\mathrm{e}^{-\mathrm{i} {\boldsymbol{p}}\boldsymbol{\cdot}\boldsymbol\xi}{\hat{\boldsymbol{\mathsf{N}}}}\left({\boldsymbol{p}},\mathrm{i} \left({\boldsymbol{k}}+\frac{{\boldsymbol{p}}}{2}\right)+\frac{1}{2}{\boldsymbol{\nabla}}_{\boldsymbol\xi},\tau\right)Z\left({\boldsymbol{x}},{\boldsymbol{\xi}},{\boldsymbol{k}} +\frac{{\boldsymbol{p}}}{2}\right)\,\mathrm{d}{\boldsymbol{p}} +\text{c.c.} \end{gather}
We have decorated the operators with a tilde to highlight the presence of  ${\boldsymbol {\nabla }}_{{\boldsymbol {\xi }}}$ in their definition; the tildes will be removed whenever this dependence disappears.
Substituting the operators into (A6) gives us the evolution equation for the Wigner function as
 \begin{equation} \left[\frac{1}{\varepsilon}\tilde{\mathcal{Q}}_0+\frac{1}{\varepsilon^{1/2}}\left(\tilde{\mathcal{P}}_0+\frac{\partial}{\partial\tau}\right)+\left(\tilde{\mathcal{Q}}_1+\frac{\partial}{\partial t}\right) \right]\boldsymbol{\mathsf{W}}^\varepsilon({\boldsymbol{x}},\boldsymbol\xi,{\boldsymbol{k}},t,\tau)=0.\end{equation}
Introducing the expansion (2.12) then leads to a hierarchy of equations to be solved at each order in  $\varepsilon$.
The leading-order equation is
 \begin{equation} \mathcal{Q}_0\boldsymbol{\mathsf{W}}^{(0)}={\boldsymbol{\mathsf{L}}}(\mathrm{i}{\boldsymbol{k}})\boldsymbol{\mathsf{W}}^{(0)}({\boldsymbol{x}},{\boldsymbol{k}},t)+\text{c.c.}=0\end{equation}
whose general solution
 \begin{equation} \boldsymbol{\mathsf{W}}^{(0)}({\boldsymbol{x}},{\boldsymbol{k}},t)=\sum_{j={\pm}}a_j({\boldsymbol{x}},{\boldsymbol{k}},t){\boldsymbol{\mathsf{E}}}_j({\boldsymbol{k}}), \end{equation}
is a linear combination of the matrices  ${\boldsymbol{\mathsf{E}}}_j({\boldsymbol {k}})={\boldsymbol {e}}_j({\boldsymbol {k}}){\boldsymbol {e}}^*_j({\boldsymbol {k}})$ constructed from the (right) eigenvectors ${\boldsymbol {e}}_j({\boldsymbol {k}})$ of ${\boldsymbol{\mathsf{L}}}(\mathrm {i}{\boldsymbol {k}})$ (see (2.15)). The so-far undetermined amplitudes $a_j({\boldsymbol {x}},{\boldsymbol {k}},t)$ are real because the Wigner function is Hermitian.
At  $O(\varepsilon ^{-1/2})$, we find
 \begin{equation} \tilde{\mathcal{Q}}_0\boldsymbol{\mathsf{W}}^{(1)}({\boldsymbol{x}},\boldsymbol\xi,{\boldsymbol{k}},t,\tau)={-}\mathcal{P}_0 \boldsymbol{\mathsf{W}}^{(0)}({\boldsymbol{x}},{\boldsymbol{k}},t),\end{equation}
where we have used that  $\partial _\tau \boldsymbol{\mathsf{W}} ^{(0)}=0$. To solve (A21), we rewrite $\boldsymbol{\mathsf{W}} ^{(1)}$ in terms of its Fourier transform with respect to $\boldsymbol \xi$,
 \begin{equation} \boldsymbol{\mathsf{W}}^{(1)}({\boldsymbol{x}},\boldsymbol\xi,{\boldsymbol{k}},t,\tau)=\int_{\mathbb{R}^3}\mathrm{e}^{-\mathrm{i}{\boldsymbol{p}}\boldsymbol{\cdot}\boldsymbol\xi}\hat{\boldsymbol{\mathsf{W}}}^{(1)}({\boldsymbol{x}},{\boldsymbol{p}},{\boldsymbol{k}},t,\tau)\,\mathrm{d}{\boldsymbol{p}}. \end{equation}
Substituting this into (A21) yields
 \begin{align}
&{\boldsymbol{\mathsf{L}}}\left(\mathrm{i}\left({\boldsymbol{k}}-\frac{{\boldsymbol{p}}}{2}\right)\right)\hat{\boldsymbol{\mathsf{W}}}^{(1)}({\boldsymbol{p}},{\boldsymbol{k}})+\left[{\boldsymbol{\mathsf{L}}}\left(\mathrm{i}\left({\boldsymbol{k}}
+\frac{{\boldsymbol{p}}}{2}\right)\right)\hat{\boldsymbol{\mathsf{W}}}^{(1)}(-{\boldsymbol{p}},{\boldsymbol{k}})\right]^*
+
\theta\hat{\boldsymbol{\mathsf{W}}}^{(1)}({\boldsymbol{p}},{\boldsymbol{k}})\nonumber\\
&\quad ={-}{\hat{\boldsymbol{\mathsf{N}}}}\left({\boldsymbol{p}},\mathrm{i}\left({\boldsymbol{k}}
+\frac{{\boldsymbol{p}}}{2}\right)\right)\boldsymbol{\mathsf{W}}^{(0)}\left({\boldsymbol{k}}+\frac{{\boldsymbol{p}}}{2}\right)-\left[{\hat{\boldsymbol{\mathsf{N}}}}\left(-{\boldsymbol{p}},\mathrm{i}\left({\boldsymbol{k}}
-\frac{{\boldsymbol{p}}}{2}\right)\right)\boldsymbol{\mathsf{W}}^{(0)}\left({\boldsymbol{k}}-\frac{{\boldsymbol{p}}}{2}\right)\right]^*,
\end{align}
\begin{align}
&{\boldsymbol{\mathsf{L}}}\left(\mathrm{i}\left({\boldsymbol{k}}-\frac{{\boldsymbol{p}}}{2}\right)\right)\hat{\boldsymbol{\mathsf{W}}}^{(1)}({\boldsymbol{p}},{\boldsymbol{k}})+\left[{\boldsymbol{\mathsf{L}}}\left(\mathrm{i}\left({\boldsymbol{k}}
+\frac{{\boldsymbol{p}}}{2}\right)\right)\hat{\boldsymbol{\mathsf{W}}}^{(1)}(-{\boldsymbol{p}},{\boldsymbol{k}})\right]^*
+
\theta\hat{\boldsymbol{\mathsf{W}}}^{(1)}({\boldsymbol{p}},{\boldsymbol{k}})\nonumber\\
&\quad ={-}{\hat{\boldsymbol{\mathsf{N}}}}\left({\boldsymbol{p}},\mathrm{i}\left({\boldsymbol{k}}
+\frac{{\boldsymbol{p}}}{2}\right)\right)\boldsymbol{\mathsf{W}}^{(0)}\left({\boldsymbol{k}}+\frac{{\boldsymbol{p}}}{2}\right)-\left[{\hat{\boldsymbol{\mathsf{N}}}}\left(-{\boldsymbol{p}},\mathrm{i}\left({\boldsymbol{k}}
-\frac{{\boldsymbol{p}}}{2}\right)\right)\boldsymbol{\mathsf{W}}^{(0)}\left({\boldsymbol{k}}-\frac{{\boldsymbol{p}}}{2}\right)\right]^*,
\end{align}
where we have suppressed dependencies on  ${\boldsymbol {x}}$, $t$ and $\tau$ for conciseness. Following Ryzhik et al. (Reference Ryzhik, Papanicolaou and Keller1996), we have introduced a regularisation parameter $\theta >0$ which will be taken to zero at a later stage.
We solve (A23) by projection on the left eigenvectors of  ${\boldsymbol{\mathsf{L}}}(\mathrm {i}{\boldsymbol {k}})$, that is, on the row vectors ${\boldsymbol {c}}_j$ solving
 \begin{equation} {\boldsymbol{c}}_j{\boldsymbol{\mathsf{L}}}=\mathrm{i}\omega_j{\boldsymbol{c}}_j \end{equation}
and satisfying
 \begin{equation} {\boldsymbol{c}}_j={\boldsymbol{e}}_j^*{\boldsymbol{\mathsf{M}}}\quad\text{and}\quad{\boldsymbol{c}}_i{\boldsymbol{e}}_j=\delta_{ij} \end{equation}
as can be shown using that  ${\boldsymbol{\mathsf{M}}}({\boldsymbol {k}}) {\boldsymbol{\mathsf{L}}}(\mathrm {i} {\boldsymbol {k}})$ is skew-Hermitian. Premultiplying and postmultiplying (A23) by ${\boldsymbol {c}}_n({\boldsymbol {k}}-{\boldsymbol {p}}/2)$ and ${\boldsymbol {c}}^*_m({\boldsymbol {k}}+{\boldsymbol {p}}/2)$ and using that $\hat {\boldsymbol{\mathsf{W}} }^{(1)}({\boldsymbol {p}},{\boldsymbol {k}})=\hat {\boldsymbol{\mathsf{W}} }^{(1)*}(-{\boldsymbol {p}},{\boldsymbol {k}})$ (because the Wigner transform is Hermitian) gives
 \begin{align}
&-\left(\mathrm{i}\left(\omega_n\left({\boldsymbol{k}}-\frac{{\boldsymbol{p}}}{2}\right)-\omega_m\left({\boldsymbol{k}}+\frac{{\boldsymbol{p}}}{2}\right)\right)+\theta\right){\boldsymbol{c}}_n
\left({\boldsymbol{k}}-\frac{{\boldsymbol{p}}}{2}\right)\hat{\boldsymbol{\mathsf{W}}}^{(1)}({\boldsymbol{p}},{\boldsymbol{k}}){\boldsymbol{c}}_m^*\left({\boldsymbol{k}}+\frac{{\boldsymbol{p}}}{2}\right)
\nonumber\\
&\quad =\sum_{i={\pm}}a_i\left({\boldsymbol{k}}+\frac{{\boldsymbol{p}}}{2}\right){\boldsymbol{c}}_n\left({\boldsymbol{k}}-\frac{{\boldsymbol{p}}}{2}\right)
{\hat{\boldsymbol{\mathsf{N}}}}\left({\boldsymbol{p}},\mathrm{i}\left({\boldsymbol{k}}+\frac{{\boldsymbol{p}}}{2}\right)\right)
{\boldsymbol{e}}_i\left({\boldsymbol{k}}+\frac{{\boldsymbol{p}}}{2}\right){\boldsymbol{e}}_i^*
\left({\boldsymbol{k}}+\frac{{\boldsymbol{p}}}{2}\right){\boldsymbol{c}}_m^*\left({\boldsymbol{k}}+\frac{{\boldsymbol{p}}}{2}\right)
\nonumber\\
&\qquad +\sum_{j={\pm}}a_j\left({\boldsymbol{k}}-\frac{{\boldsymbol{p}}}{2}\right){\boldsymbol{c}}_n
\left({\boldsymbol{k}}-\frac{{\boldsymbol{p}}}{2}\right){\boldsymbol{e}}_j
\left({\boldsymbol{k}}-\frac{{\boldsymbol{p}}}{2}\right){\boldsymbol{e}}_j^*\left({\boldsymbol{k}}-\frac{{\boldsymbol{p}}}{2}\right) \notag\\
&\qquad\times {\hat{\boldsymbol{\mathsf{N}}}}^*\left(-{\boldsymbol{p}},\mathrm{i}\left({\boldsymbol{k}}-\frac{{\boldsymbol{p}}}{2}\right)\right){\boldsymbol{c}}_m^*
\left({\boldsymbol{k}}+\frac{{\boldsymbol{p}}}{2}\right).
\end{align}
\begin{align}
&-\left(\mathrm{i}\left(\omega_n\left({\boldsymbol{k}}-\frac{{\boldsymbol{p}}}{2}\right)-\omega_m\left({\boldsymbol{k}}+\frac{{\boldsymbol{p}}}{2}\right)\right)+\theta\right){\boldsymbol{c}}_n
\left({\boldsymbol{k}}-\frac{{\boldsymbol{p}}}{2}\right)\hat{\boldsymbol{\mathsf{W}}}^{(1)}({\boldsymbol{p}},{\boldsymbol{k}}){\boldsymbol{c}}_m^*\left({\boldsymbol{k}}+\frac{{\boldsymbol{p}}}{2}\right)
\nonumber\\
&\quad =\sum_{i={\pm}}a_i\left({\boldsymbol{k}}+\frac{{\boldsymbol{p}}}{2}\right){\boldsymbol{c}}_n\left({\boldsymbol{k}}-\frac{{\boldsymbol{p}}}{2}\right)
{\hat{\boldsymbol{\mathsf{N}}}}\left({\boldsymbol{p}},\mathrm{i}\left({\boldsymbol{k}}+\frac{{\boldsymbol{p}}}{2}\right)\right)
{\boldsymbol{e}}_i\left({\boldsymbol{k}}+\frac{{\boldsymbol{p}}}{2}\right){\boldsymbol{e}}_i^*
\left({\boldsymbol{k}}+\frac{{\boldsymbol{p}}}{2}\right){\boldsymbol{c}}_m^*\left({\boldsymbol{k}}+\frac{{\boldsymbol{p}}}{2}\right)
\nonumber\\
&\qquad +\sum_{j={\pm}}a_j\left({\boldsymbol{k}}-\frac{{\boldsymbol{p}}}{2}\right){\boldsymbol{c}}_n
\left({\boldsymbol{k}}-\frac{{\boldsymbol{p}}}{2}\right){\boldsymbol{e}}_j
\left({\boldsymbol{k}}-\frac{{\boldsymbol{p}}}{2}\right){\boldsymbol{e}}_j^*\left({\boldsymbol{k}}-\frac{{\boldsymbol{p}}}{2}\right) \notag\\
&\qquad\times {\hat{\boldsymbol{\mathsf{N}}}}^*\left(-{\boldsymbol{p}},\mathrm{i}\left({\boldsymbol{k}}-\frac{{\boldsymbol{p}}}{2}\right)\right){\boldsymbol{c}}_m^*
\left({\boldsymbol{k}}+\frac{{\boldsymbol{p}}}{2}\right).
\end{align}
We now decompose  $\hat {\boldsymbol{\mathsf{W}} }^{(1)}$ using the vectors ${\boldsymbol {e}}_i({\boldsymbol {k}})$, which form a complete basis, as
 \begin{equation} \hat{\boldsymbol{\mathsf{W}}}^{(1)}({\boldsymbol{x}},{\boldsymbol{p}},{\boldsymbol{k}},t,\tau)=\sum_{m,n={\pm}}\alpha_{mn}({\boldsymbol{x}},{\boldsymbol{p}},{\boldsymbol{k}},t,\tau){\boldsymbol{e}}_n\left({\boldsymbol{k}}- \frac{{\boldsymbol{p}}}{2}\right){\boldsymbol{e}}_m^*\left({\boldsymbol{k}}+\frac{{\boldsymbol{p}}}{2}\right). \end{equation}
Using this along with the orthonormality of the eigenvectors and (A11) we finally write the solution
 \begin{align}
\hat{\boldsymbol{\mathsf{W}}}^{(1)}({\boldsymbol{x}},{\boldsymbol{p}},{\boldsymbol{k}},t,\tau)&=\sum_{m,n={\pm}}\left[a_m\left({\boldsymbol{x}},{\boldsymbol{k}}+
\frac{{\boldsymbol{p}}}{2},t\right){\boldsymbol{c}}_n\left({\boldsymbol{k}}-
\frac{{\boldsymbol{p}}}{2}\right){\hat{\boldsymbol{\mathsf{U}}}}\left({\boldsymbol{p}},\mathrm{i}\left({\boldsymbol{k}}+\frac{{\boldsymbol{p}}}{2}\right)\right){\boldsymbol{e}}_m\left({\boldsymbol{k}}
+\frac{{\boldsymbol{p}}}{2}\right)\right.\nonumber\\
&\quad +\left.a_n\left({\boldsymbol{x}},{\boldsymbol{k}}-\frac{{\boldsymbol{p}}}{2},t\right){\boldsymbol{e}}_n^*\left({\boldsymbol{k}}-\frac{{\boldsymbol{p}}}{2}\right){\hat{\boldsymbol{\mathsf{U}}}}^*\left(-{\boldsymbol{p}},\mathrm{i}\left({\boldsymbol{k}}-
\frac{{\boldsymbol{p}}}{2}\right)\right){\boldsymbol{c}}^*_m\left({\boldsymbol{k}}+
\frac{{\boldsymbol{p}}}{2}\right)\right]\notag\\
&\quad\times \frac{\displaystyle{\boldsymbol{e}}_n\left({\boldsymbol{k}}-
\frac{{\boldsymbol{p}}}{2}\right){\boldsymbol{e}}_m^*\left({\boldsymbol{k}}+
\frac{{\boldsymbol{p}}}{2}\right)\hat{\psi}({\boldsymbol{p}},\tau)}{\displaystyle\mathrm{i}\left(\omega_m\left({\boldsymbol{k}}+
\frac{{\boldsymbol{p}}}{2}\right)-\omega_n\left({\boldsymbol{k}}-\frac{{\boldsymbol{p}}}{2}\right)\right)-\theta},
\end{align}
\begin{align}
\hat{\boldsymbol{\mathsf{W}}}^{(1)}({\boldsymbol{x}},{\boldsymbol{p}},{\boldsymbol{k}},t,\tau)&=\sum_{m,n={\pm}}\left[a_m\left({\boldsymbol{x}},{\boldsymbol{k}}+
\frac{{\boldsymbol{p}}}{2},t\right){\boldsymbol{c}}_n\left({\boldsymbol{k}}-
\frac{{\boldsymbol{p}}}{2}\right){\hat{\boldsymbol{\mathsf{U}}}}\left({\boldsymbol{p}},\mathrm{i}\left({\boldsymbol{k}}+\frac{{\boldsymbol{p}}}{2}\right)\right){\boldsymbol{e}}_m\left({\boldsymbol{k}}
+\frac{{\boldsymbol{p}}}{2}\right)\right.\nonumber\\
&\quad +\left.a_n\left({\boldsymbol{x}},{\boldsymbol{k}}-\frac{{\boldsymbol{p}}}{2},t\right){\boldsymbol{e}}_n^*\left({\boldsymbol{k}}-\frac{{\boldsymbol{p}}}{2}\right){\hat{\boldsymbol{\mathsf{U}}}}^*\left(-{\boldsymbol{p}},\mathrm{i}\left({\boldsymbol{k}}-
\frac{{\boldsymbol{p}}}{2}\right)\right){\boldsymbol{c}}^*_m\left({\boldsymbol{k}}+
\frac{{\boldsymbol{p}}}{2}\right)\right]\notag\\
&\quad\times \frac{\displaystyle{\boldsymbol{e}}_n\left({\boldsymbol{k}}-
\frac{{\boldsymbol{p}}}{2}\right){\boldsymbol{e}}_m^*\left({\boldsymbol{k}}+
\frac{{\boldsymbol{p}}}{2}\right)\hat{\psi}({\boldsymbol{p}},\tau)}{\displaystyle\mathrm{i}\left(\omega_m\left({\boldsymbol{k}}+
\frac{{\boldsymbol{p}}}{2}\right)-\omega_n\left({\boldsymbol{k}}-\frac{{\boldsymbol{p}}}{2}\right)\right)-\theta},
\end{align}
where we have taken into account that  $\hat {\psi }({\boldsymbol {p}})=\hat {\psi }^*(-{\boldsymbol {p}})$. We note that this solution shows $\boldsymbol{\mathsf{W}} ^{(1)}$ is linear in the random field $\psi$.
The slow evolution of the leading-order Wigner function  $\boldsymbol{\mathsf{W}} ^{(0)}$ is controlled by the $O(1)$ term in the expansion of (A18), given by
 \begin{equation} -\tilde{\mathcal{Q}}_0\boldsymbol{\mathsf{W}}^{(2)}=(\tilde{\mathcal{P}}_0+\partial_\tau)\boldsymbol{\mathsf{W}}^{(1)}+(\mathcal{Q}_1+\partial_t)\boldsymbol{\mathsf{W}}^{(0)}.\end{equation}
We assume that the random stream function is a stationary process in  $\tau$ and homogeneous in ${\boldsymbol {\xi }}$, with zero mean, $\langle \psi (\boldsymbol \xi ,\tau ) \rangle =0$, and covariance
 \begin{equation} \langle \psi(\boldsymbol\xi,\tau)\psi(\boldsymbol\xi',\tau) \rangle=R(\boldsymbol\xi-\boldsymbol\xi'), \end{equation}
where  $\langle \boldsymbol {\cdot } \rangle$ denotes an ensemble average, or equivalently an average over $\boldsymbol \xi$. In terms of Fourier transforms, this implies that
 \begin{equation} \langle \hat{\psi}({\boldsymbol{p}})\hat{\psi}({\boldsymbol{p}}') \rangle=\hat{R}({\boldsymbol{p}})\delta({\boldsymbol{p}}+{\boldsymbol{p}}'), \end{equation}
where the stream function power spectrum  $\hat {R}$ is the Fourier transform of $R$. Then since ${\boldsymbol {u}}={\boldsymbol {\nabla }}_{h}^\bot \psi$, the more familiar kinetic energy spectrum is then
 \begin{equation} \hat{E}_{K}({\boldsymbol{k}})=\lvert {\boldsymbol{k}}_{h} \rvert^2\hat{R}({\boldsymbol{k}}). \end{equation}
 We now take the average of (A29). The slow time derivative term on the right-hand side disappears since  $\langle \boldsymbol{\mathsf{W}} ^{(1)} \rangle =0$. Since $\langle \partial _\xi \boldsymbol{\mathsf{W}} ^{(2)} \rangle =0$, $\langle \tilde {\mathcal {Q}}_0 \boldsymbol{\mathsf{W}} ^{(2)} \rangle =\mathcal {Q}_0 \langle \boldsymbol{\mathsf{W}} ^{(2)} \rangle$, where the removal of the tilde corresponds to setting ${\boldsymbol {\nabla }}_{{\boldsymbol {\xi }}}$ to $0$ in $\mathcal {Q}_0$. This leads to
 \begin{equation} -{\mathcal{Q}}_0\boldsymbol{\mathsf{W}}^{(2)}= \langle {\tilde{\mathcal{P}}_0\boldsymbol{\mathsf{W}}^{(1)}+(\mathcal{Q}_1+\partial_t)\boldsymbol{\mathsf{W}}^{(0)}} \rangle,\end{equation}
an inhomogeneous version of (A19).
The matrix  $\mathcal {Q}_0$ has a non-trivial null space, spanned by the matrices ${\boldsymbol{\mathsf{E}}}_j({\boldsymbol {k}})$; the right-hand side of (A33) must therefore satisfy a solvability condition. Since $\mathrm {i}\mathcal {Q}_0 = \mathrm {i} {\boldsymbol{\mathsf{L}}}(\mathrm {i} {\boldsymbol {k}})$ is self-adjoint with respect to the matrix inner product
this condition is obtained by applying ![]() to (A33). We deal with the resulting terms one by one. First, by orthogonality and (A20) we have
to (A33). We deal with the resulting terms one by one. First, by orthogonality and (A20) we have
Next,

In order to evaluate the remaining term, we note that, using (A11) and (A31), we have
 \begin{equation} \langle {{\hat{{\mathsf{N}}}}_{\alpha\beta}({\boldsymbol{p}}, \mathrm{i}{\boldsymbol{q}}){\hat{{\mathsf{N}}}}_{\gamma\delta}({\boldsymbol{p}}', \mathrm{i}{\boldsymbol{q}}')} \rangle ={\hat{{\mathsf{U}}}}_{\alpha\beta}({\boldsymbol{p}}, \mathrm{i}{\boldsymbol{q}}){\hat{{\mathsf{U}}}}_{\gamma\delta}({\boldsymbol{p}}', \mathrm{i}{\boldsymbol{q}}')\hat{R}({\boldsymbol{p}})\delta({\boldsymbol{p}}+{\boldsymbol{p}}'),\end{equation}
where Greek indices are used for matrix elements to make the following derivation clearer, and summation over repeated Greek indices is implied.
Expanding all terms, and making use of the delta function in (A37), we have

where we let  ${\boldsymbol {k}}':={\boldsymbol {k}}+{\boldsymbol {p}}$. Setting the regularisation parameter $\theta \to 0$, we have that $\theta /(x^2+\theta ^2)\to {\rm \pi}\delta (x)$. This leads to a factor $\delta (\omega _i({\boldsymbol {k}})-\omega _n({\boldsymbol {k}}'))$ which indicates that scattering is restricted within a single branch of the dispersion relation, and so we may drop the sum over $n$ and let $i=n$.
We simplify (A38) by computing
 \begin{align} c^\pm_\lambda({\boldsymbol{k}}){\hat{{\mathsf{U}}}}_{\lambda\mu}({\boldsymbol{k}}'-{\boldsymbol{k}},\mathrm{i}{\boldsymbol{k}}')b^\pm_\mu({\boldsymbol{k}}') &= \left\langle{{\boldsymbol{e}}_\pm({\boldsymbol{k}}), {\hat{\boldsymbol{\mathsf{U}}}}({\boldsymbol{k}}'-{\boldsymbol{k}},\mathrm{i}{\boldsymbol{k}}'){\boldsymbol{e}}_\pm({\boldsymbol{k}}')}\right\rangle_{\boldsymbol{\mathsf{M}}} \end{align}
 \begin{align} &= \frac{1}{2\omega}\frac{|{\boldsymbol{k}}||{\boldsymbol{k}}_{h}'||k_3'|}{|{\boldsymbol{k}}'||{\boldsymbol{k}}_{h}||k_3|}[\omega({\hat{{\mathsf{U}}}}_{11}+{\hat{{\mathsf{U}}}}_{22})\pm \mathrm{i}({\hat{{\mathsf{U}}}}_{12}-\omega^2{\hat{{\mathsf{U}}}}_{21})] \end{align}
 \begin{align} &=:\alpha({\boldsymbol{k}},{\boldsymbol{k}}')\pm\mathrm{i}\beta({\boldsymbol{k}},{\boldsymbol{k}}'), \end{align}
using (2.18) and (A12) and omitting the arguments  $({\boldsymbol {k}}'-{\boldsymbol {k}},\mathrm {i}{\boldsymbol {k}}')$ of the functions ${\hat {{\mathsf{U}}}}_{ij}$. The last line defines the two real functions $\alpha ({\boldsymbol {k}},{\boldsymbol {k}}')$ and $\beta ({\boldsymbol {k}},{\boldsymbol {k}}')$ which can be written down using the explicit expressions for ${\hat {{\mathsf{U}}}}_{ij}$ in (A12). The symmetry properties
 \begin{equation} \alpha({\boldsymbol{k}},{\boldsymbol{k}}')={-}\alpha({\boldsymbol{k}}',{\boldsymbol{k}}) \quad \text{and}\quad \beta({\boldsymbol{k}},{\boldsymbol{k}}')=\beta({\boldsymbol{k}}',{\boldsymbol{k}}) \end{equation}
can be verified from these expressions. Using (A39)–(A40a,b), the terms in (A38) simplify as
 \begin{align} &\mathrm{Re}
\left(c_\lambda({\boldsymbol{k}}){\hat{{\mathsf{U}}}}_{\lambda\mu}({\boldsymbol{k}}'-{\boldsymbol{k}},\mathrm{i}{\boldsymbol{k}}')e_\mu({\boldsymbol{k}}')\right)\left(c_\alpha({\boldsymbol{k}}'){\hat{{\mathsf{U}}}}_{\alpha\beta}({\boldsymbol{k}}-{\boldsymbol{k}}',\mathrm{i}{\boldsymbol{k}})e_\beta({\boldsymbol{k}})\right) \notag\\
&\quad ={-}(\alpha^2({\boldsymbol{k}},{\boldsymbol{k}}')+\beta^2({\boldsymbol{k}},{\boldsymbol{k}}')),
\end{align}
\begin{align} &\mathrm{Re}
\left(c_\lambda({\boldsymbol{k}}){\hat{{\mathsf{U}}}}_{\lambda\mu}({\boldsymbol{k}}'-{\boldsymbol{k}},\mathrm{i}{\boldsymbol{k}}')e_\mu({\boldsymbol{k}}')\right)\left(c_\alpha({\boldsymbol{k}}'){\hat{{\mathsf{U}}}}_{\alpha\beta}({\boldsymbol{k}}-{\boldsymbol{k}}',\mathrm{i}{\boldsymbol{k}})e_\beta({\boldsymbol{k}})\right) \notag\\
&\quad ={-}(\alpha^2({\boldsymbol{k}},{\boldsymbol{k}}')+\beta^2({\boldsymbol{k}},{\boldsymbol{k}}')),
\end{align}
 \begin{align}&\mathrm{Re}
\left(c_\lambda({\boldsymbol{k}}){\hat{{\mathsf{U}}}}_{\lambda\mu}({\boldsymbol{k}}'-{\boldsymbol{k}},\mathrm{i}{\boldsymbol{k}}')e_\mu({\boldsymbol{k}}')\right)\left(c_\alpha({\boldsymbol{k}}){\hat{{\mathsf{U}}}}_{\alpha\beta}({\boldsymbol{k}}'-{\boldsymbol{k}},\mathrm{i}{\boldsymbol{k}}')e_\beta({\boldsymbol{k}}')\right)^* \notag\\
&\quad =\alpha^2({\boldsymbol{k}},{\boldsymbol{k}}')+\beta^2({\boldsymbol{k}},{\boldsymbol{k}}'),
\end{align}
\begin{align}&\mathrm{Re}
\left(c_\lambda({\boldsymbol{k}}){\hat{{\mathsf{U}}}}_{\lambda\mu}({\boldsymbol{k}}'-{\boldsymbol{k}},\mathrm{i}{\boldsymbol{k}}')e_\mu({\boldsymbol{k}}')\right)\left(c_\alpha({\boldsymbol{k}}){\hat{{\mathsf{U}}}}_{\alpha\beta}({\boldsymbol{k}}'-{\boldsymbol{k}},\mathrm{i}{\boldsymbol{k}}')e_\beta({\boldsymbol{k}}')\right)^* \notag\\
&\quad =\alpha^2({\boldsymbol{k}},{\boldsymbol{k}}')+\beta^2({\boldsymbol{k}},{\boldsymbol{k}}'),
\end{align}
and (A38) simplifies to

Combining this result with (A35) and (A36) reduces the solvability condition for (A33) to the kinetic equation (1.1), with the cross section
 \begin{equation} \sigma({\boldsymbol{k}},{\boldsymbol{k}}'):=2{\rm \pi}\left(\alpha^2({\boldsymbol{k}},{\boldsymbol{k}}')+\beta^2({\boldsymbol{k}},{\boldsymbol{k}}')\right)\hat{R}({\boldsymbol{k}}'-{\boldsymbol{k}})\delta\left(\omega({\boldsymbol{k}})-\omega({\boldsymbol{k}}')\right). \end{equation}
Replacing the stream function spectrum  $\hat {R}$ by the kinetic-energy spectrum $\hat {E}_{K}$ using (A31) and substituting explicit expressions for $\alpha ({\boldsymbol {k}},{\boldsymbol {k}}')$ and $\beta ({\boldsymbol {k}},{\boldsymbol {k}}')$ gives the full form (2.22) of the cross-section.


 Open access