


Introduction
One of the most interesting problems in the theory of glacier flow concerns the extent to which glaciers slip past the bedrock. The problem is of theoretical interest because, until recently, there was no theory which enabled the amount of this slip to be predicted, and the recent theory of WeertmanReference Weertman 1 has still to be tested experimentally. It is also of interest in any consideration of the mechanism of glacial erosion, for clearly a glacier which is stuck fast to its bed will be a less active eroding agent than one which is slipping and carrying with it debris which can scour the bedrock. However the slip of a glacier over its bed at depth is a difficult quantity to measure, and it is therefore of interest to see how fast glaciers slip relative to the rock in those places where the interface is easily accessible, that is, where the glacier side is sufficiently clear of snow and moraine for the ice-rock contact to be visible from the surface.
Forbes,Reference Forbes 2 with his usual discernment, noted two features of glacier movement that have appeared in our measurements on Austerdalsbreen. He observed that on the Glacier des Bossons, near Chamonix, the difference of velocity between the centre and the sides was least at the higher part and most at the lower part of the glacier. He further notedReference Forbes 3 that the Mer de Glace moved unevenly, quicker in warm, fine weather than in cold weather. Erratic movements on glaciers have been recorded again and again, for example by Goldthwait and WashburnReference Washburn and Goldthwait 4 on the South Crillon Glacier, by BattleReference Battle 5 in Greenland, and by MeierReference Meier 6 on the Saskatchewan Glacier. Abrupt changes both of direction and speed of movement have been measured accurately on Veslgjuv-breen, a cirque glacier in JotunheimenReference Jackson, Thomas and Lewis 7 with firn moving down from its névé fields in two directions almost at right angles; but in the small, simple, neighbouring cirque glacier Vesl-Skautbreen, ice within 1 m. of the bed moved uniformly at about 1 cm. per day.Reference McCall and Lewis 8
In 1956 one of us made some measurements of side-slip at two places immediately below the ice falls which join to form Austerdalsbreen, a distributary from Jostedalsbreen, Norway.Reference Glen 9 It was then found that at these sites the flow was of the same order of magnitude as the velocity at the centre of the glacier, Since the foot of an ice fall is a place where, according to Nye’s theory of glacier flow,Reference Nye 10 large amounts of slip on the bed are to be anticipated, and also are regions where Blockschollen movements of the kind discussed by PillewizerReference Pillewizer 11 are most marked, these results were not unexpected.
Since 1956 members of the Cambridge Austerdalsbre Expeditions have made various measurements of the glacier, including, more recently, measurements on the main part of the glacier tongue and on the snout. In the course of these it was thought desirable to look for sites further down-glacier than those in the earlier side-slip measurements, and to test whether at these stations also there was appreciable slipping past the side walls. In his measurements on Austerdalsbreen in 1937, Pillewizer had deduced the variation of velocity across the glacier and had found that, although the velocity was roughly constant over the middle parts, it did appear to fall off rapidly as the edge was approached. A similar result was obtained from stake measurements made by the Cambridge Austerdalsbre Expedition in 1958; it was thus of interest to see whether in this region the slip of the glacier past its bed had fallen to zero, or whether a small amount of definite slip remained.
Experimental Details
Three sites were found on the left bank of the glacier (the east side) and one on the right bank (the west side) at which the ice-rock interface was relatively unencumbered by moraine. The location of these sites is shown in Figure 1. Their locations will also be described here in some detail, as they help to account for some of the variations in the amount of side-slip from place to place. On the left bank the uppermost site was immediately downstream from a fan of avalanche material which fell to the glacier from a hanging valley. The avalanche snow and ice persists through the year and so forms a small but definite part of the accumulation of the glacier. Just downstream from the fan which had formed in the previous winter we found a place where the ice flowed past rock with only a small number of encumbering boulders on its surface. Upstream the fan provided a region of relatively thicker ice, while downstream there was a region of comparatively gentle surface gradient. This site was called “East Fan” station.
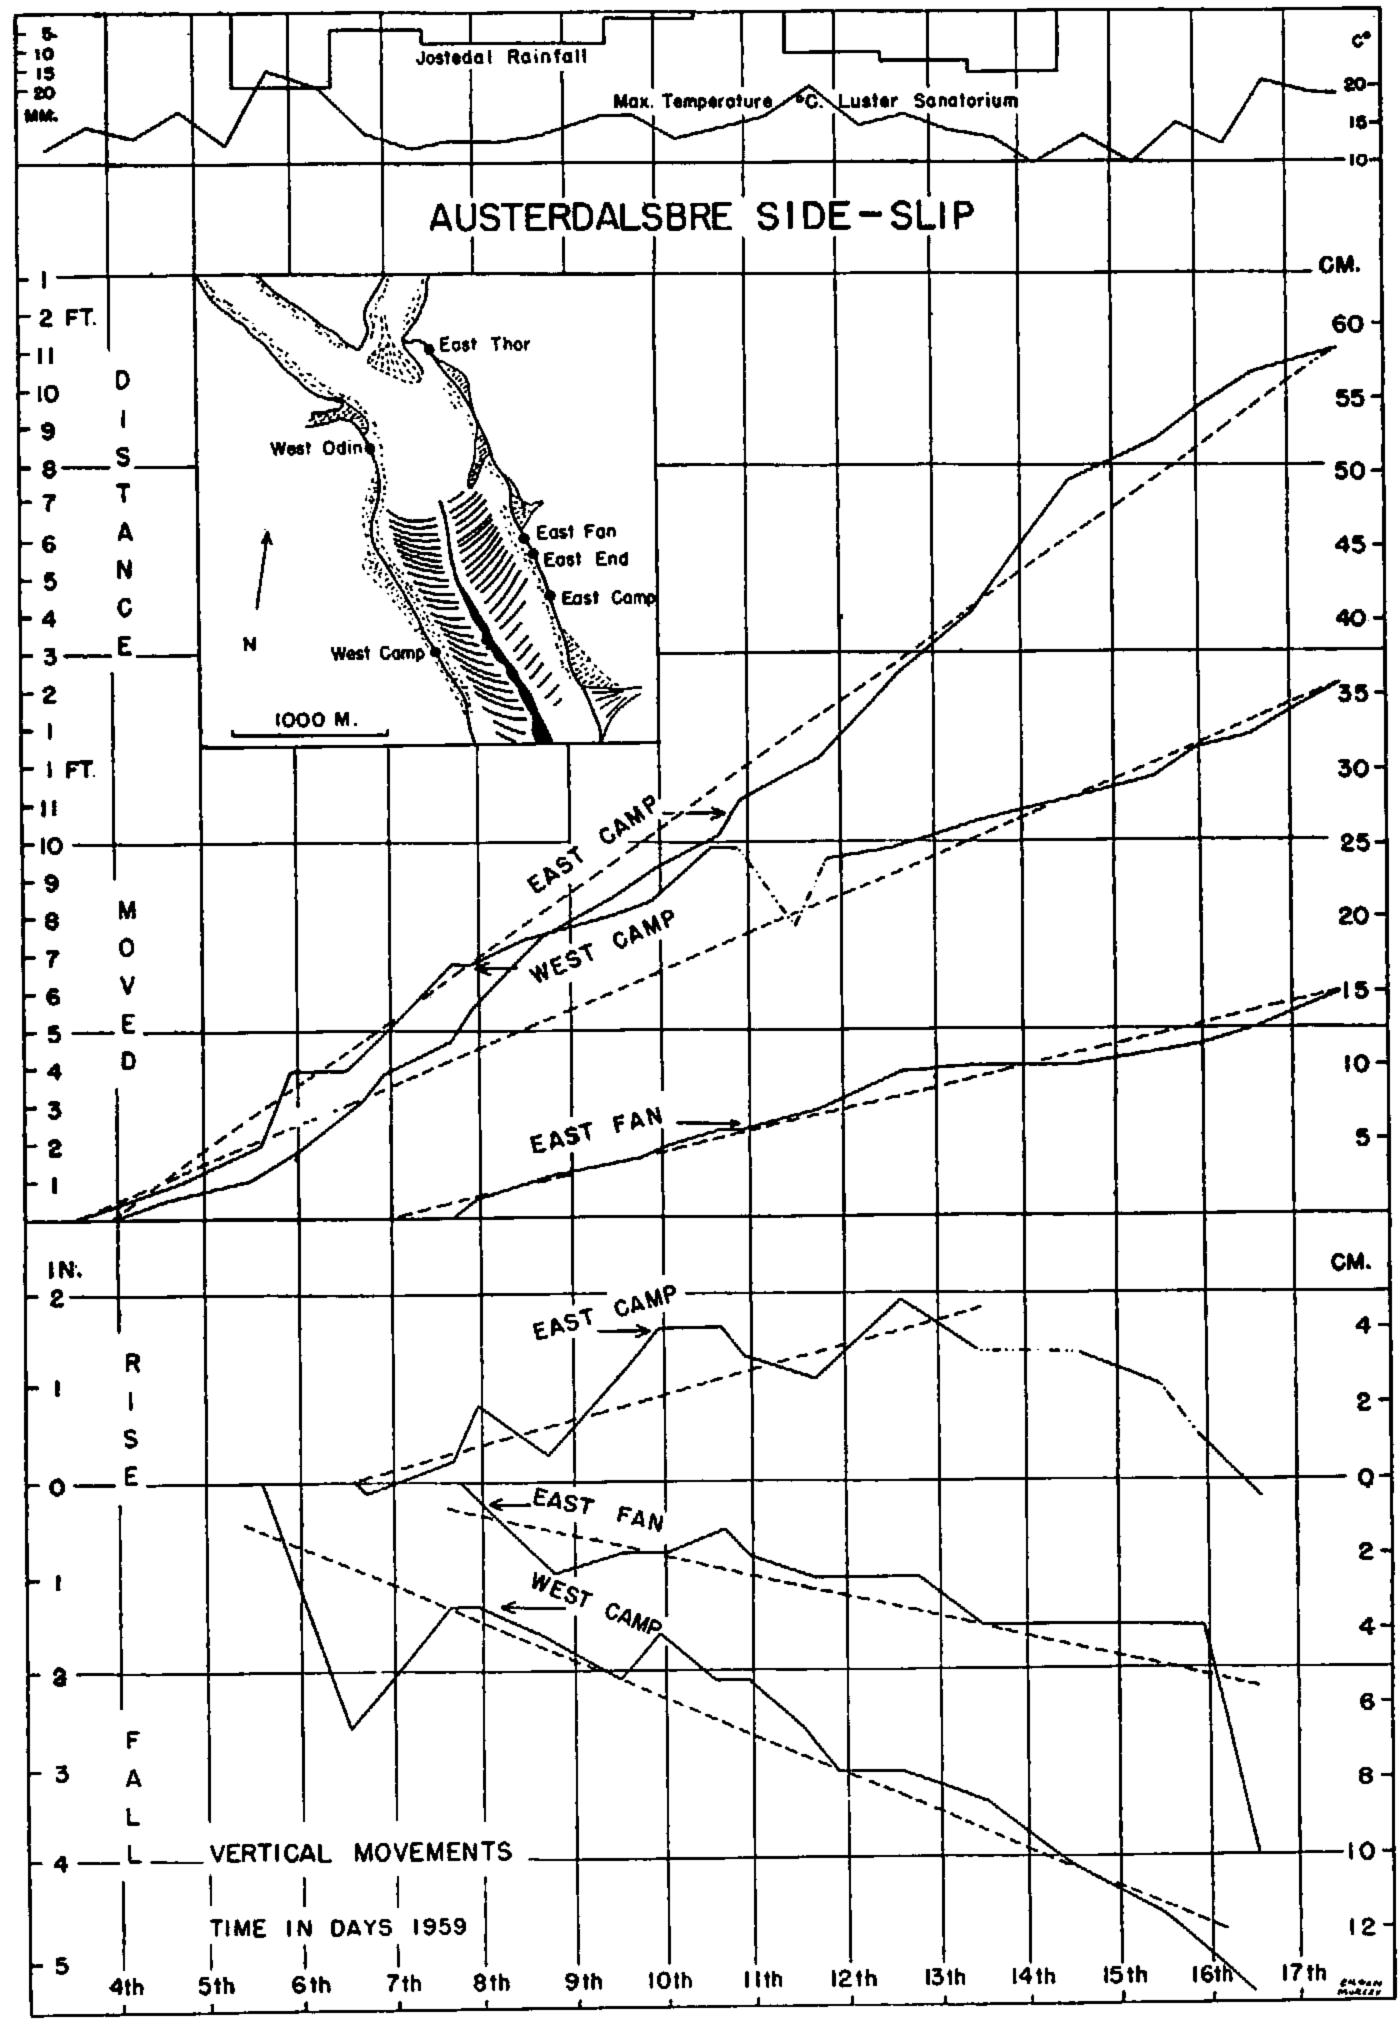
Measurements of horizontal and vertical movements of ice past rock using the first method, with graphs of rainfall and temperature and, inset, map of Austerdalshreen showing location of sites used for measuring side-slip
The second site was a few hundred metres down-glacier from the first, where a transverse line of stakes used for velocity measurements reached the east margin of the glacier; it was therefore called “East End” station. There was slightly more debris on the ice here, and several large boulders had entered the gap between the ice and the rock. The surface slope of the glacier was still relatively slight, though the ample covering of rock debris had protected the margins of the glacier from ablation so that the surface lay above the general level of the debris-free ice a hundred or more metres from the side wall.
The third site on this side of the glacier was a few hundred metres still further down-stream, and, being approximately opposite the camp site used by the expedition on the medial moraine, was called “East Camp” station. It was just up-glacier from a point where the valley widened and the surface gradient increased suddenly. The site may be on the down-stream edge of a rock bar. There was still a considerable amount of debris on the glacier surface, but sites for drilling into relatively clean ice could still be found.
The new site on the right bank of the glacier was down-stream from the transverse line of stakes, and was approximately opposite the position of the camp site and so was named “West Camp” station. This margin of the glacier was considerably more covered with moraine than at the sites on the left bank, and the surface stood higher above the main debris-free glacier (Fig. 2, p. 1119). This site was not ideal, but was the only one available on that side of the glacier. The stake position was at the foot of a steep slope of ice, marked by the arrow at the top of Figure 2. Rocks slipped down this slope from time to time as their supporting ice melted away. This hazard made it difficult to preserve stakes for any length of time, and a stake was in fact destroyed by such a rock slide, curtailing measurements at this station.
Location of “West Camp” side-slip station

In addition to these new sites, measurements were also made at “West Odin” a position close to that adopted in 1956 on the right bank of the glacier. The actual site, L, used in 1956 could not be re-Iocated. but the new site was within a few tens of metres of the old position. The object of this station was to see whether velocities of flow in this region were still of the same order of magnitude as they had been three years previously.
The methods of measurement adopted were the same at all the new sites, and two independent series of measurements were made at each, each of us being responsible for one method. In the first method (W.V.L.), use was made of the gap between glacier and side wall that was present at every site. A hole about 2 m. long was bored through the ice into this gap and a 3 m. stake of square section with 2.5 cm. sides was inserted through it. The end of this stake was pointed, and the movement of this end was measured relative to pencilled marks on the rock wall. However, in order to avoid damage to the stake from stones falling down the gap between ice and rock, and to reduce ablation effects, some stakes were pulled back into the ice between measurements. Figure 3 (p. 1119) shows the gap at “East Fan” station; it is filled with boulders and fine debris. The end of the bore hole near the rock was in the shade and the other end was covered each day with snow and rock debris after the stake had been pulled in. This reduced melting in the hole to a minimum so the stake remained firm enough not to wobble, and yet could be pushed forward to touch the rock for a measurement to be made. One night when the stake had not been withdrawn, a boulder fell down the gap and snapped the end off. Figure 4 (p. 1119) shows a closer view of “West Camp” station showing the measuring stake and three protecting stakes, used to deflect debris falling from the pile at the top of the photograph. Ablation was severe here, as the position was exposed and sunny, and the stake had to be re-sited every few days. Figure 5 (p. 1119), which is an even closer view at this site, shows the current marker stake as well as an old stake almost melted out. Pencil marks on the rock, from which measurements were made, are visible in this photograph. Despite precautions, slumped debris filled the gap in wet weather and had to be removed to reveal the stake for measurement. The main advantage of this method of measurement is that it records both horizontal and vertical components of motion very close to the wall; the disadvantages are that melting tends to make the stake fit only loosely into its hole, causing uncertainties as to its correct positioning, and also that a rotation of the ice near the wall may be misinterpreted as a translational motion.
View of “East Fan” side-slip station

View of “West Camp” side-slip station

Close-up of “West Camp” station

The second method of measurement (J.W.G.) was that described in the earlier paper;Reference Glen 9 a stake was inserted vertically into the ice a convenient distance away from the edge and its distance from two paint marks on the rock was measured. In this way the movement of the top of the stake relative to the rock wall can be calculated. The advantages of this method are that a vertical stake suffers less from ablation than one in a sloping hole projecting right through the ice, and that measurements of velocity components perpendicular to the wall can be made. The disadvantages are that the point of measurement is necessarily some definite distance away from the actual margin, and that vertical components of motion, or more accurately components parallel to the wall and perpendicular to the line joining the paint marks, cannot be determined.
Experimental Results
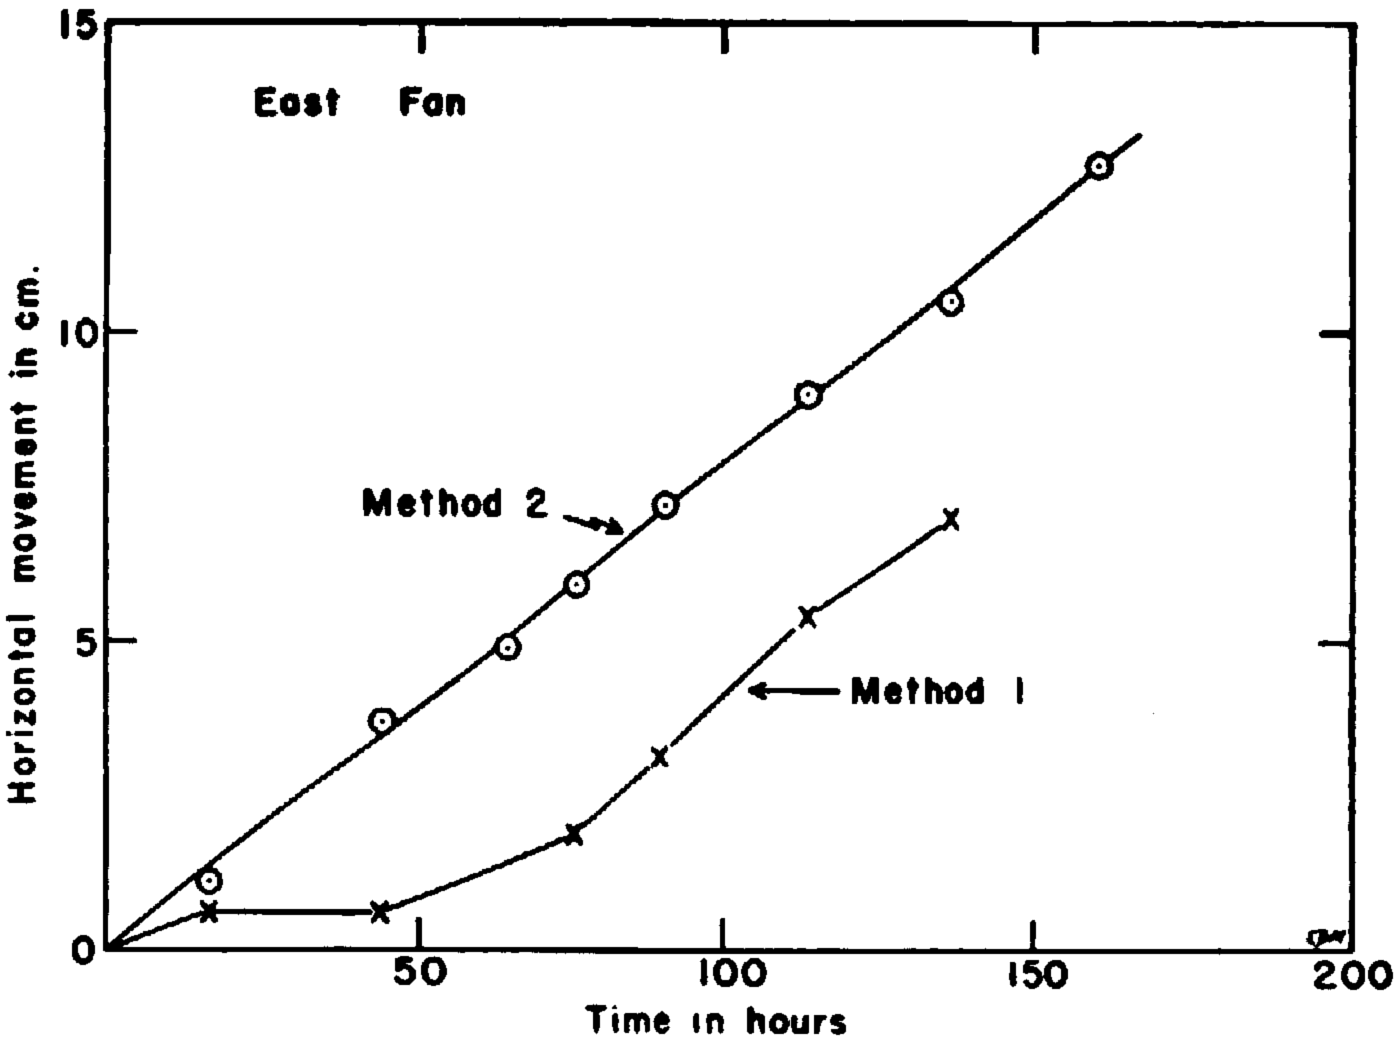
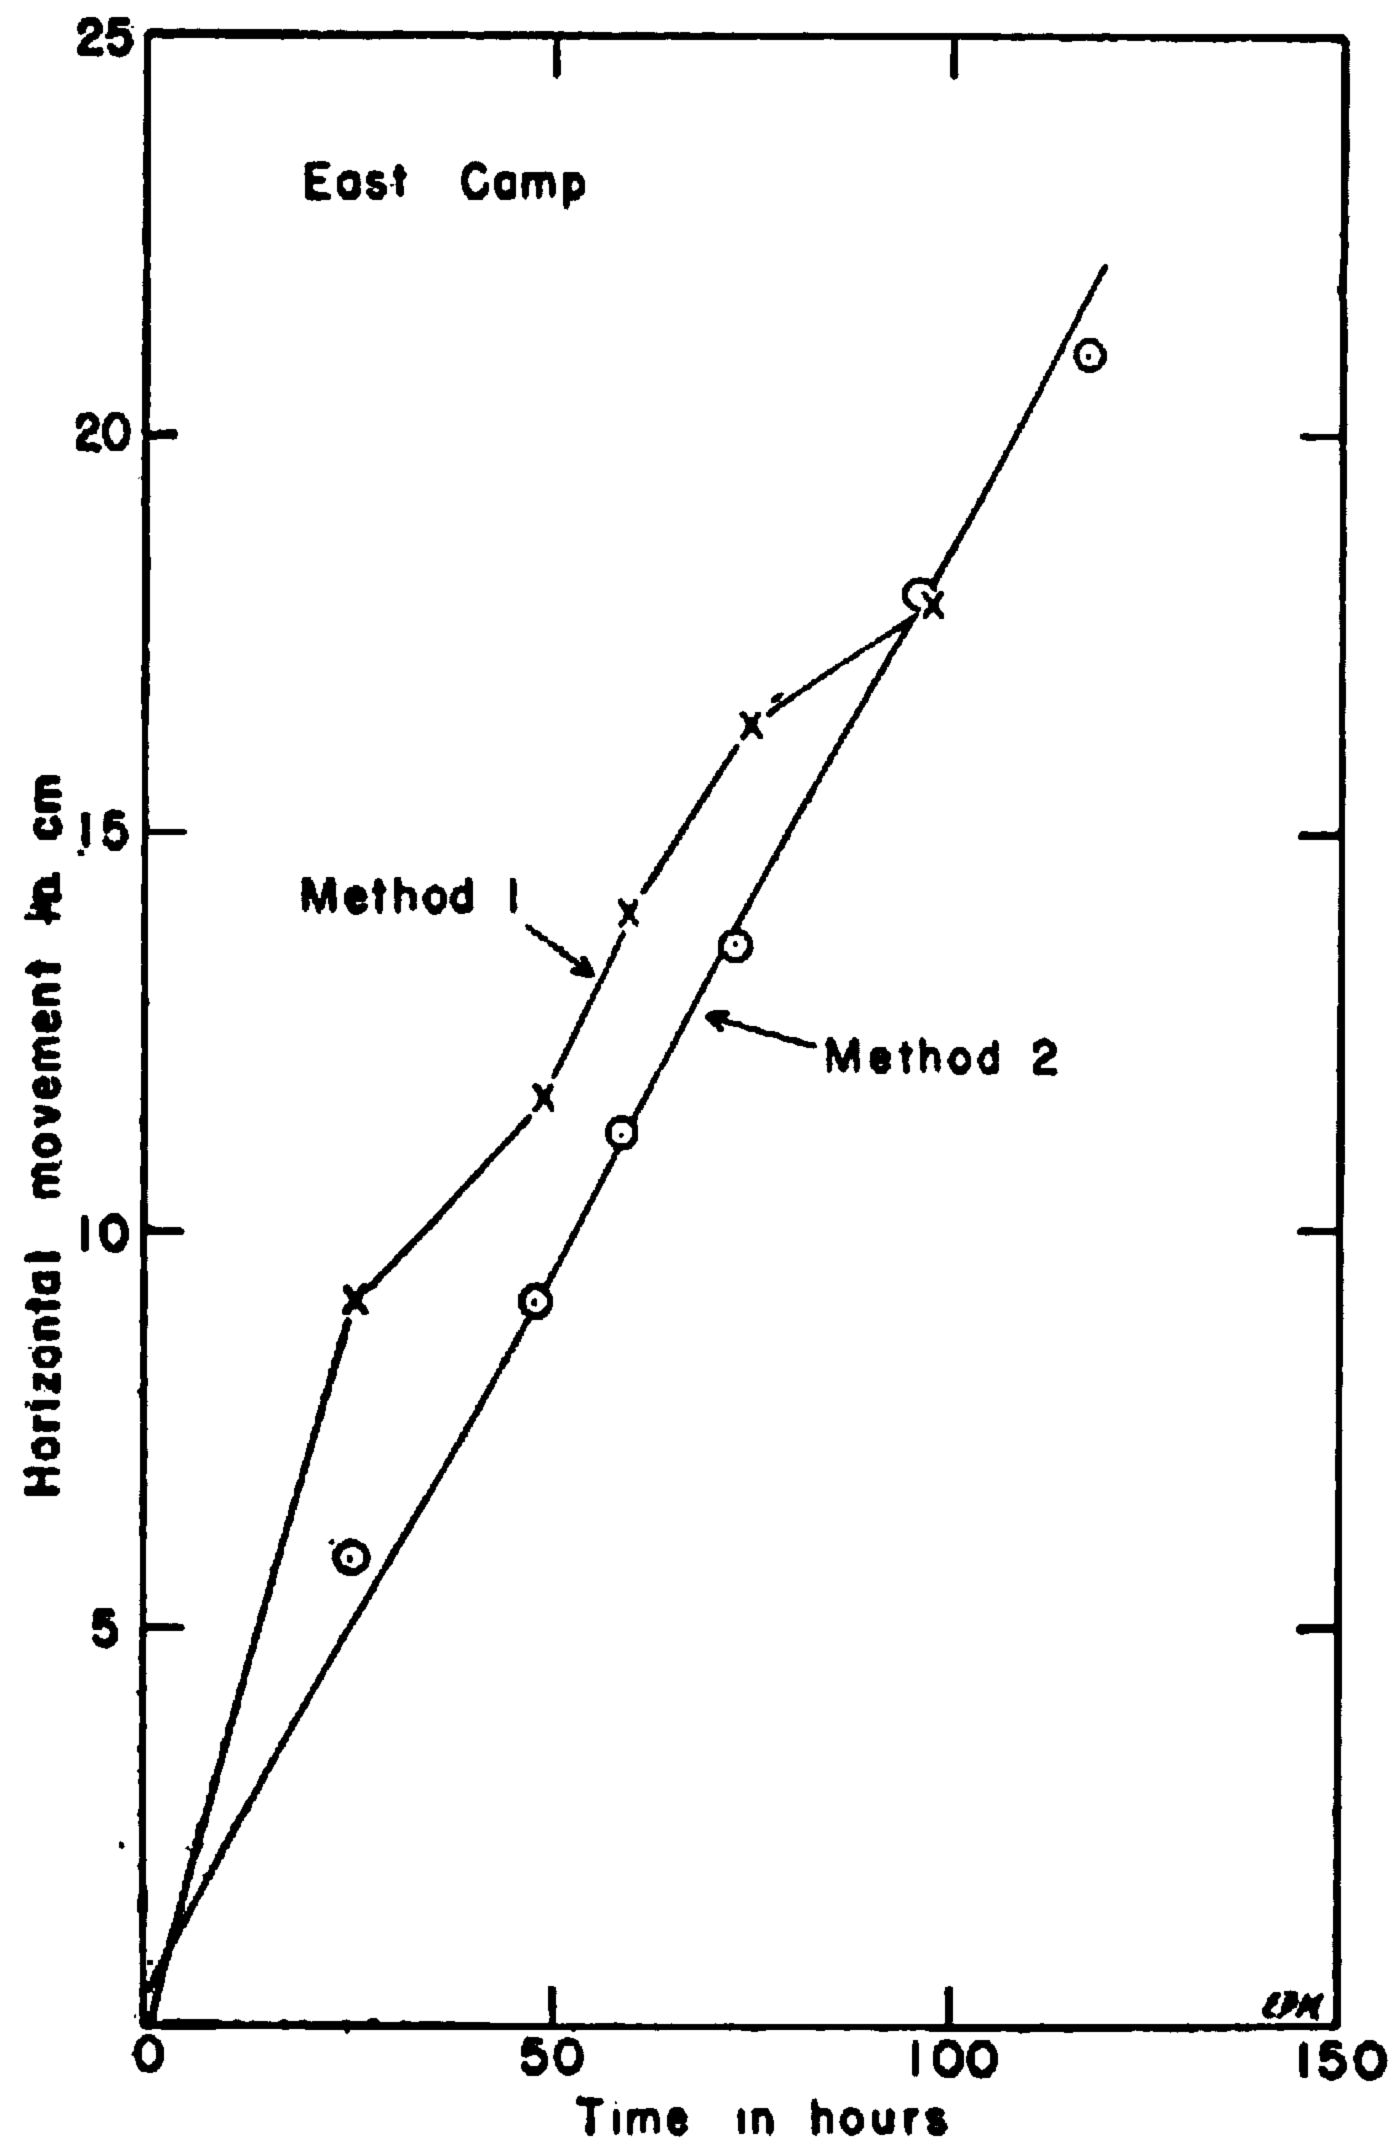
At all sites definite slip past the sides was recorded by one of the two methods, and at only one site, “East End,” was it not recorded by both methods. Here the first method of measurement gave neither horizontal nor vertical movement during the seven days from 6 to 13 July. As this stake was sheltered from falling rock it was left in position throughout this time, so the lack of movement cannot be attributed to errors in re-positioning. However melting revealed a large boulder, mainly enclosed within the ice but also extending across the gap to the rock wall, just down-glacier from the stake. This may account for the null readings in one of two ways; either it may have been holding back the ice at this point, or else the stake, which touched the boulder at one point, may itself have been pivoted back relative to the ice as the ice pushed its other end past the rock, so as to leave stationary the point of the stake. The first alternative seems to be the more likely. At all the other new positions results were obtained by both methods and it is thus possible to compare them. Figures 6 to 8 show the total movement measured by the second method compared with the horizontal component of movement parallel to the wall obtained by the first method for the time during which both methods were employed. It will be seen that the first method appears to give more erratic movements than does the second method. The variations are probably too large to be solely due to errors in the first method such as the melting of the hole containing the stake, and so represent in part genuine fluctuations in velocity at the very edge of the ice. These fluctuations are smoothed out at the distance of about 2 m., which is the approximate distance of the stakes from the ice edge at all the sites for the second method. These measurements thus seem to show fairly definitely that at about 2 m. from the edge of the ice the flow is very uniform, and is not much influenced by weather conditions, while closer to the ice edge more erratic movements are taking place which may be related to weather conditions.
Graph of movement of ice at “East Fan” station as measured by the two methods
Graph of movement of ice at “East Camp” station as measured by the two methods
Graph of movements of ice at “West Camp” station as measured by the two methods
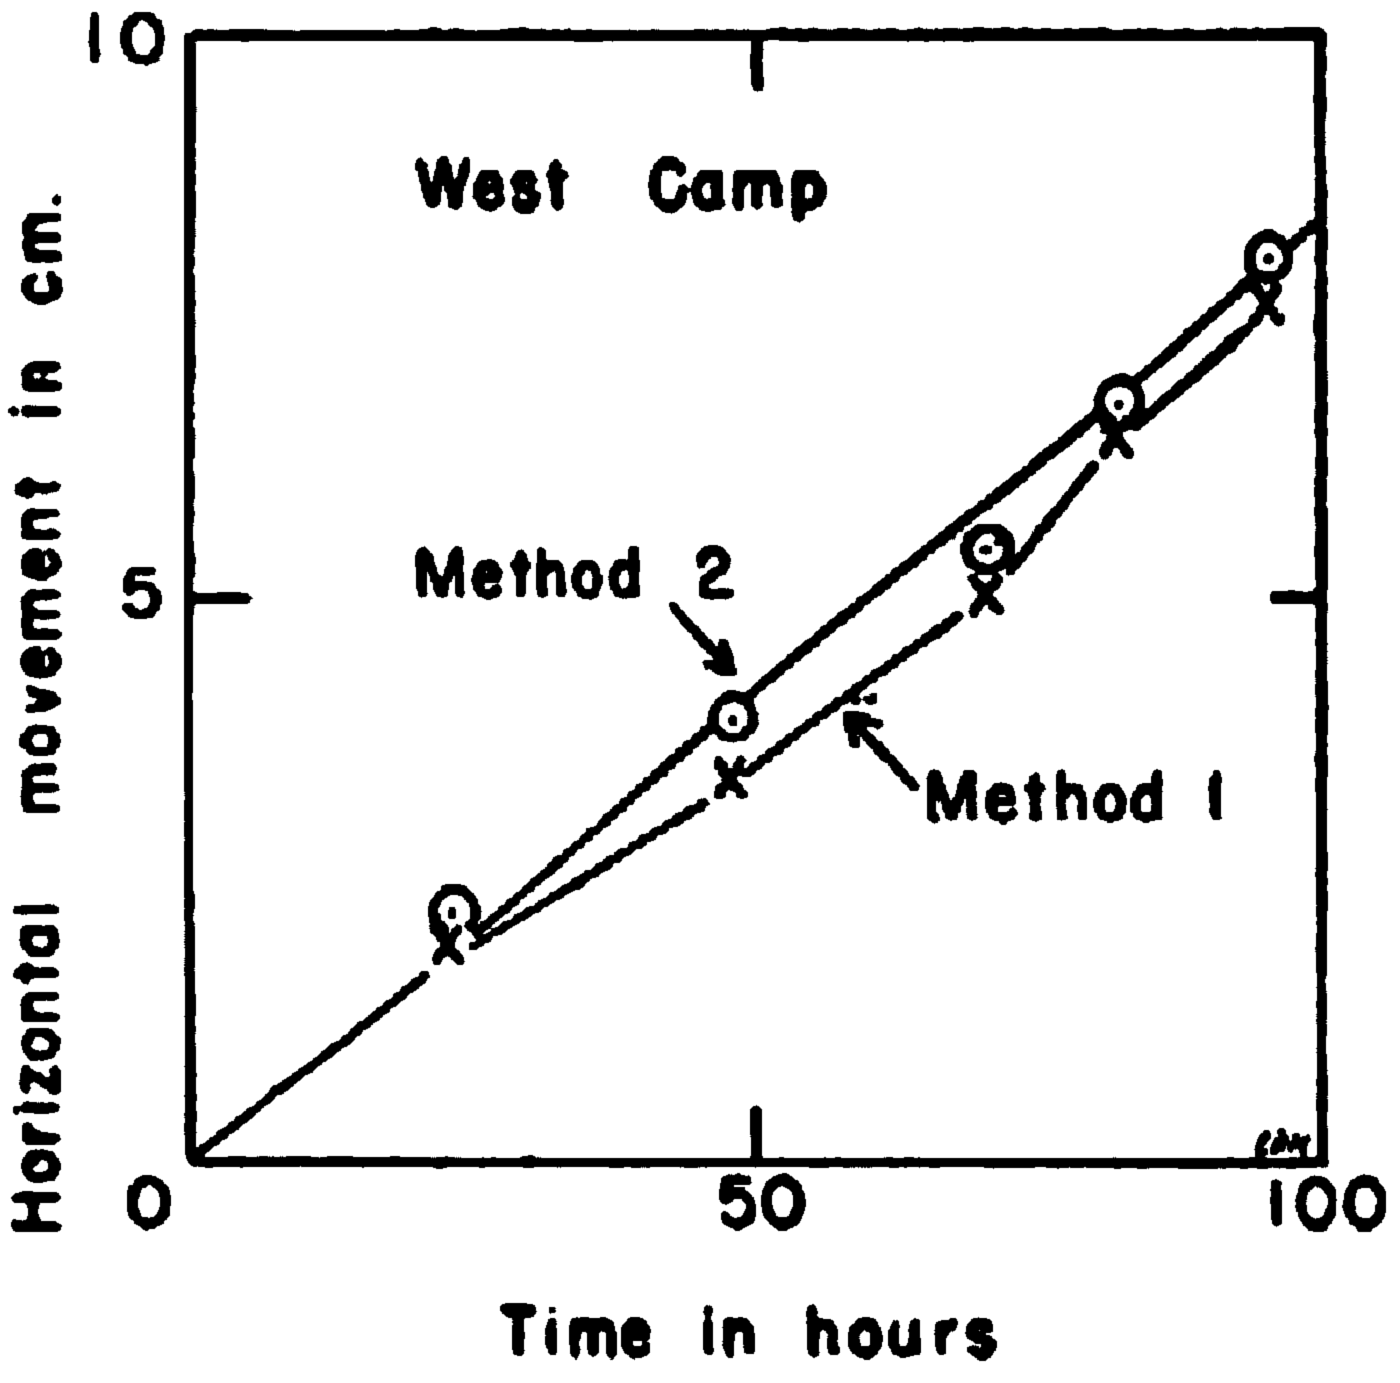
Figure 1 shows the measurements made by the first method over the whole period of observation, a longer period than that during which both measurements were being made. Minor suggestions of halts can be seen on several of the traces. The reverse movement shown in the “West Camp” record on 11 July may partly be due to an inaccurate measurement at this station when the observer was alone at the site in the rain. The system of measurement at this station, the first that was chosen for work by this direct method of observation, was rather crude. A plumb-bob had to be suspended with the point touching the point of the stake and held by hand in mid-air; then this hand holding the plumb line string had to bemoved horizontally in a fixed direction until it touched the rock wall. Then a pencil mark was made along the string. The fixed direction was taken from the corner of a boulder some metres out on the ice, and in the absence of a second observer the determination of this direction was only approximate. A partial correction was carried out when the station was occupied by two observers because the second observer could readily see if the pencil line was out of the vertical as given by the plumb line when viewed from the corner of the boulder.
The average rate of movement varied from site to site. The results obtained for the average rate of horizontal flow using the first method and for the total flow rate (ignoring the unmeasured component in the vertical direction) using the second method, are shown in Table I. It will be seen from this table that the two methods give velocities which, while not identical, show the same general pattern of variation from site to site, thus “East Camp” had the fastest slip of all the new sites.
Measurements of Average Rate of Horizontal Side-Slip on Austerdalsbreen
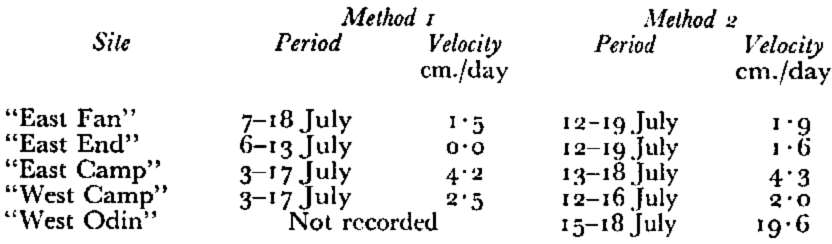
The movement at “West Odin” was somewhat slower than the 30 cm./day found at L in 1956, but since a second determination that year gave 25.6 cm./day, there seem to be Iarge variations in this area and it cannot be said with certainty that the velocity at a given point has decreased over the years. It is clear, however, that the velocities at the lower sites are considerably smaller. They are to be compared with velocities of about 13 cm./day in the centre of the glacier in the neighbourhood—measured at the transverse line of stakes. The slip past the side is thus some 10 to 20 per cent of the velocity at the centre of the glacier, a smaller percentage than that obtained just below the ice fall.Reference Glen 9
Vertical movements by the first method are also recorded in Figure 1. These, like the horizontal movements with this method, were usually accurate to ±3 mm. judged from repeating measurements during one observation. The movements are again erratic, and this appears more markedly than with the horizontal measurements because the net vertical movements are smaller. “East Fan” showed a fairly consistent fall averaging 3.5 cm. in ten days with relatively small departures from this average. “East Camp” station, on the other hand, rose at an average of 6.5 cm. in ten days and showed large variations. The suspected rock bar beneath this station may account for part of this upward movement, but a rise is natural in the lower reaches of glaciers where ablation is great, provided that the mass balance of the glacier is in approximate equilibrium over a period of years. The surface gradient is that which is sufficient to enable the glacier to carry down-stream its normal load of ice. Ablation during the hot summer months lowers the surface, and thins the glacier, which would reduce its velocity and still more its discharge unless the glacier thickens due to compression until equilibrium between supply and discharge is approximately restored.
The departures from average rate of movement on these two traces are closely in phase, if allowance is made for the departures being consistently smaller at “East Fan” station than at “East Camp.” Several of these erratic movements start later at “East Fan” station although it is further up-glacier. Perhaps the smaller disturbing forces at this locality take a little longer to make themselves felt.
“West Camp” station fell at an average rate of 7 cm. in ten days, i.e. slightly quicker than “East Camp” station on the opposite side of the glacier rose. There is Iittle or no sign of a rock bar on this side of the glacier and the considerable height of this station above the general level of the glacier may have tended to increase the downhill movements as melting progressed. The movements were very erratic during 5, 6, 7 July. Thereafter they became much steadier as did the horizontal movements at this station.
Discussion of Results
The most significant feature of the results obtained is that slipping of the glacier past its side wall does occur in this region of Austerdalsbreen at all sites at which measurements were taken, and that the amount of slip varies markedly from site to site. In particular the slip at the middle station on the left bank was less than that both above and below it. The rate of slip is probably determined by the nature of glacier flow in the vicinity of the site. At “East End” station the glacier was relatively level and of constant width, however downstream from “East Camp” station the glacier passes out of a constriction and then widens and loses height relatively rapidly. At such a position the ice can be imagined to be squeezed past the rock, giving an enhanced rate of side-slipping. This helps us to understand the erosive power of glaciers at such places.
The more variable rate of flow observed by the first method using a stake projecting through the ice may, as has been mentioned above, be partly due to experimental errors. If, as seems likely, it indicates a genuine variation in the rate of flow very close to the edge of the glacier, this may be due to irregularities in the side wall, to boulders incorporated in the ice and jammed against the rock near the stakes, and to sudden melting due to heavy rain and high temperatures. Table II shows precipitation and temperature conditions at the nearest meteorological stations during the period of observations. Fanaråken, at an altitude of 2,062 m., is 50 km. to the east; Luster Sanatorium at an altitude of 484 m., is 25 km. to the east, and Jostedal, at 370 m., is 16 km. to the east. Temperature figures are not available for Jostedal. Rainfall data for Jostedal, and maximum temperatures for Luster Sanatorium are shown in Figure 1, as these stations are near to Austerdalsbreen and at roughly the same altitude. They confirm an experience gained in the field, that heavy rain, and to a lesser extent high temperatures, influence the glacier movement. The sudden forward lunge of “West Camp” station by 5 cm. between 14.00 hours and 22.00 hours occurred during a very heavy rainstorm on 5 July. The temperature was also high, reaching the maximum during the period of observation of 22.5° C. at Luster Sanatorium. This was by far the quickest and the greatest movement measured at any of the side-slip stations. It was accompanied by the greatest vertical movement which, however, continued when the horizontal movement had ceased. This brief pause was followed by another large horizontal movement on 6 and 7 July, making a total movement of more than 12 cm. in 48 hours. The ice then settled down to move a little more than a third of that speed for the next ten days. The vertical movement was also excessive and erratic during and immediately after that period of heavy rain and high temperature, falling abruptly nearly 7 cm. and then rising 3 cm. rather suddenly.
Temperature and Precipitation Data for the Jostedal-West Jotunheim Area by courtesy of the Director, Det Norske Meteorologiske Institutt
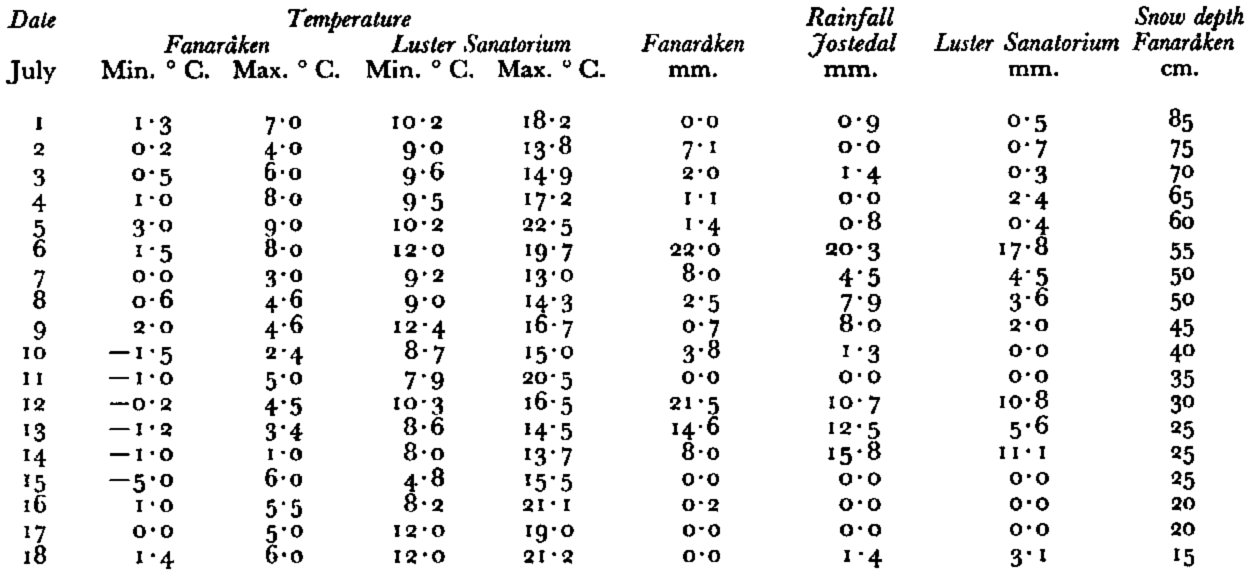
The “East Camp” station, though much steadier in its movements, also surged forward at this time, and it accelerated again during the period of fairly heavy rain on 7 and 8 July. “East Fan” station, where measurements began on 6 July, also lurched forward and downward on the evening of 7 July when the “West Camp” station paused for a second time after its second forward lunge. It is instructive to note that the rain of 7 and 8 July was not accompanied by high temperatures. The heavy rain and high temperature of 11 July was accompanied by the puzzlingly erratic behaviour of the glacier at “West Camp” station, and by the second quicker horizontal movement of “East Fan” station together with distinctly active forward movement of the fast moving “East Camp” station. An even faster movement of this station on the evening of 10 July, however, coincides neither with rain nor high temperature. The high temperature, but without rain, of 16 July coincided with a slight but definite acceleration of both “East Fan” and “West Camp” stations, but with a retardation of “East Camp” station.
The presence of deep, narrow gaps between the glacier and the side walls with the ice only in contact with protuberances of the rock walls, leads to the suggestion that erratic movements result from the melting of the ice which is pressing hard against these protuberances. The reality of these deep gaps was demonstrated by our accidentally dropping the container end of a 33 m. tape down a gap that was almost invisible at the surface at “West Camp” station. The tape rapidly unwound to its full length and then did not reach the bottom. It seems that the more uniform movement of the neighbouring ice further from the side wall exerts a relatively uniform drag on the marginal ice, but that this latter ice jerks forward as it frees itself from the projections in the side wall, or from boulders jammed in the gap between the ice and the rock. Then after a large forward movement, a pause ensues until the drag is sufficient to overcome the side resistance once more. Some of the changes of velocity which relate neither to rain nor to temperature may be related to the varying resistance of the bulging side walls and to the encumbrance of boulders jammed between the ice and the solid rock.
Glacial Erosion
The forward surges, especially at “West Camp” station, the jamming of the boulder at “East End” station, the load of boulders always present in the gap between the glacier and the rock walls, and above all the grooved and striated appearance of the massive rock faces, help us to appreciate how glaciers may erode their beds. Figure 9 (p. 1120) shows striations and grooves, some crossing each other, on a massive exposure of gneiss immediately alongside “East Fan” station. The ice axe rested on boulders and stones which filled the gap between the rock mass and the ice just above the stake position. The grooves were remarkably fresh and unweathered, and the largest could almost hold the shaft of the ice axe. One is shown level with the band on the ice axe. It ends abruptly at a steeply inclined quartz vein shown near the centre line of the photograph. Half-way up the photograph the grooves and striations can be seen almost touching each other. The responsible stones and boulders seem to have ground almost away a bulge which ended abruptly on the down-stream side at a quarried face verynear to, and parallel with, the edge of the photograph. The left side of the photograph at this same level shows the generally smoother and curved surface of the up-glacier side of this same rock mass. A further and perhaps fresher example of this quarrying—or block removal as opposed to particle removal which we term grinding and grooving—can be seen in the bottom right-hand corner. The surface of the rock recess in and near the diagonal shadow is fractured and pocketed, but not striated and smoothed. Striations and smoothing begin to show again as the distance from the shadow increases. The fracture which encouraged the removal of the block continues nearly half-way across a triangular area of rock with a smoothed and striated surface, and another ill-defined crack points towards it from the shadow that bounds this surviving lump of rock on the right. Continued gouging would, no doubt, in time have removed this further block of rock. A triangular-shaped piece had been removed from the otherwise smooth rock mass above. Perhaps the deep grooves immediately down-glacier from this dark hollow represent striations caused by the pieces of rock being removed. This grooving and quarrying demonstrate the two chief ways in which glaciers remove massive rock with few joints and bedding planes. These effects have long been recognized but the cause has been little understood.Reference Lewis 12
Striations on massive gneiss adjacent to “East Fan” station

McCall’s approximations and calculations (Ref. 8, p. 56) throw light on this problem. He followed others in discarding plucking as a mechanism because the yield stress in shear for ice is only 1 kg. /cm.2, approximately 1/160 of that for granite. So in a tug-of-war the ice would break and not the granite. For grinding and grooving considerably greater forces need to be exerted on the rock walls. Consider an ideal case such as a cube of granite of 1 m. side resting on the bed of a glacier. Compression on the up-glacier face can theoretically be 20,000 kg. (i.e. 2 kg./cm.2, the yield stress for ice in compression, times 100 cm. squared, the area of the surface). Shear along the top and side faces in line with the flow may theoretically equal 30,000 kg. (i.e. 1 kg./cm.2 × 100 cm. × 100 cm. × 3). The ice may press up-glacier against the down-stream face, it may not touch it at all, or it may exert a slight downstream drag, so we shall ignore this problematical and relatively small effect. So the maximum theoretical force may approximate to 50,000 kg., but even assuming it is only half this, it is still sufficient to shear off a projection with an initial surface of contact with the parent rock of 160 cm.2, an area greater than the area of your hand. Granite and other rocks are far stronger in compression than tension, yielding at about 1,400 kg./cm.2. So if the cube pressed solely on one point it may be able to gouge an area of 18 cm.2. So a block of about this size could have gouged the groove shown level with the ice axe. Perhaps the resistant quartz vein caused the boulder to turn slightly so that its point no longer pressed against the side wall. In order to appreciate the different possibilities for quarrying and for grooving, it is instructive to realize that this same block could have pulled away a piece of rock with a sound surface contact of about 180 cm.2. This may help to explain why glaciers can remove considerably more material from the down-stream side of projections such as roches mounionnées then they can grind away from a bulging surface roughly parallel with the direction of flow.
There are usually lines or surfaces of weakness within rocks of which glacial quarrying will take full advantage. These show well in Figure 10 (p. 1120) from a photograph taken on the other side of the glacier, near “West Camp” station. It shows a much larger area of side wall than does Figure 9, and so the smoothing, fluting, grooving and quarrying seen are on a far larger scale. A series of parallel major joints traversed this wall, one of which can be seen continuing from the bottom right to the top left corners of the photograph. These appeared to have been used repeatedly in this quarrying process. On the left a multiple series is shown which presumably assisted in the removal of enormous blocks of rock. A few metres down-glacier to the left from this position a great recessed gable occurred from which a volume of rock as large as a group of houses had been removed. One block was over 20 m. long. Lack of support on the downstream side may have encouraged the multiple diagonal joints to form. It is also necessary to remember that originally deep-seated igneous, and some other rocks may contain stresses within them which help the initial formation of such joint planes.Reference Lewis 12 So the effects of glacial quarrying on such rocks might be far greater than a simple calculation based on the relative strengths of ice and rock would suggest.
Striations on massive gneiss adjacent to “West Camp” station, showing fluting and quarrying

None of these processes of glacial erosion need be quick to accomplish prodigious erosion. If a glacier removed only 1 mm. per year from its rock bed this would amount to 250 m. in a quarter-million years, i.e. in about a quarter of the length of the Pleistocene Ice Age including both glacial and interglacial periods. 3 mm. per year continuing for half the length of the Ice Age would accomplish 1,500 m. of erosion, probably sufficient to account for the quite exceptional over-deepening of the trough containing the Sogne Fjord. Such erosion requires a plentiful supply of boulders and stones at the surface of contact between ice and rock. Our experience on Austerdalsbreen and elsewhere suggests that there is no shortage of such grinding and prising tools, and they are constantly renewed by debris falling on to the glacier from the frost-shattered side walls far above. Perhaps the frequency of these tools along the sides of glaciers—witness the side moraines—may help glaciers to erode their side walls at a faster rate than their beds, a characteristic that is suggested by the rather wide U-shape of the typical glaciated valley. But the glaciers must slip actively along their side walls for this erosion to occur. Our present evidence suggests that this active side-slip occurs below ice falls where wide and deep rock basins are known to occur.Reference Martonne 13 However, the boulder that was jammed against the rock wall at “East End” station and did not move could have accomplished no material erosion. This is because near the surface of a glacier, where hydrostatic pressure is low, the ice can flow round or over such a boulder, exerting little force upon it. The ice can only exert its full force if the boulder is covered by 60 to 70 m. of ice. The full force of the ice, limited only by its inherent strength, is then exerted on the boulder. At still greater depths the forces exerted by the moving ice may not be much greater owing to the limited strength of the ice. On the other hand the boulder may press very much harder against the bedrock especially if the surface of contact between rock and rock is free from ice or water. We need to know more about the mechanics of flow at these great depths to understand deep glacial erosion. One thing is fairly certain, that providing the glacier is slipping at all, velocity is a relatively minor factor, as the force exerted by the ice on a single boulder increases only as the

The availability of tools may also be a factor in bed as well as valley-side erosion by glaciers. They may never be as plentiful beneath a glacier as at the sides, but they may well be more plentiful in some areas than others. One of the few places where the bottom of a glacier has been properly studied was at the inner end of the lower tunnel dug through Vesl-Skautbreen (Ref. 8, p. 52). Angular blocks of rock occurred there, and the rock face showed signs both of grooving and quarrying. The bottom of the glacier was not, in fact, frozen hard on to the bedrock. The ice came away easily from the rock floor, perhaps because the heat from the Earth had melted the ice in intimate contact with the rock. Seeping melt water would always tend to follow and enlarge such cracks. Such blocks of rock may also occur beneath Austerdalsbreen near the foot of the ice fall. Thinning and excessive crevassing in the swiftly moving ice falls may have allowed rocks tumbling from the cliffs on to the ice falls to penetrate deeply, and finally to sink slowly to the bottom because of their considerable mass and greater density than the surrounding, slowly yielding ice. This process would be accelerated by the fact that ice in the ice fall is already under considerable stress due to its rapid flow.Reference Glen 15 Abundant moraine emerges at the snout of the glacier arranged along ogives, just as if they had been deeply injected into the glacier each summer.Reference King and Lewis 16
Acknowledgements
The authors express their thanks to the other members of the Expedition who assisted with the measurements reported here, and particularly to Dr. Cuchlaine A. M. King for her sustained help. They also thank Dr. J. F. Nye for details of the measurements of flow velocity in the centre of the glacier and Mr. W. H. Ward who led the Expedition. We are also most grateful for financial assistance from the Royal Society and Trinity College, Cambridge.
The photographs were taken by W.V.L.



