


Introduction
Snow and ice affect humans in many ways. The high reflectance of solar radiation makes extensive seasonal and annual snow covers an important factor in the Earth’s radiation balance and influences the Earth’s climate in a global sense (Reference Foster, Chang, Gurney, Foster and ParkinsonFoster and Chang, 1993). More locally, floods after rapid snowmelt in spring, which endanger humans, are a function of the water storage in glaciers and seasonal snow covers (see, e.g., Reference RangoRango, 1993). Conversely, the extent and distribution of snow cover depend on a variety of climatic factors and therefore reflect changes in the Earth’s climate. These changes are visible, for example, in moraines left behind by retreating glaciers or in the lack of snow in ski resorts.
On a global scale U.S. National Oceanic and Atmospheric Administration (NOAA) Advanced Very High Resolution Radiometer (AVHRR) satellite data (pixel resolution 1 km), for example, are used to monitor snow cover (Reference CarrollCarroll, 1990) and are incorporated into general circulation models (GCMs) (e.g. Reference Bromwich, Tzeng and ParishBromwich and others, 1994). Recent development of satellite technology, providing data with a higher spatial resolution, has been used to improve GCMs (Reference Hall, Riggs and SalomonsonHall and others, 1995; Reference Rosenthal and DozierRosenthal and Dozier, 1996). Landsat 3, 4 and 5 had a resolution of 30–60m, and the spatial resolution was improved with the successful launch of Landsat 7. A new panchromatic band (band 8) with a pixel resolution of 15 615 mwas added. In this paper I employ a new Landsat 7 band 8 classification (LB8) as a precise tool for obtaining remotely the size and form of snowpatches in the mountainous area west of Abisko, northern Sweden, and investigate its use to determine the annual minimum extent of snow coverage. These results are compared with the established normalized-difference snow index (NDSI) to assess the accuracy of the LB8 classification at three different spatial scales.
The largest area analyzed in this study, referred to as the overview area, covers 6648 km2. It extends from the Fjordland around Narvik, Norway, at sea level to the mountainous area around Abisko with summits around 1500ma.s.l. Within the overview area is an area covering 50 km2 of mountainous terrain west of Abisko (Fig. 1). This area, referred to as the focus area, contains several permanent snowfields and mini glaciers, which are of particular interest for an ongoing climate-impact study. Five of these snowfields (1–5) are included in this study.
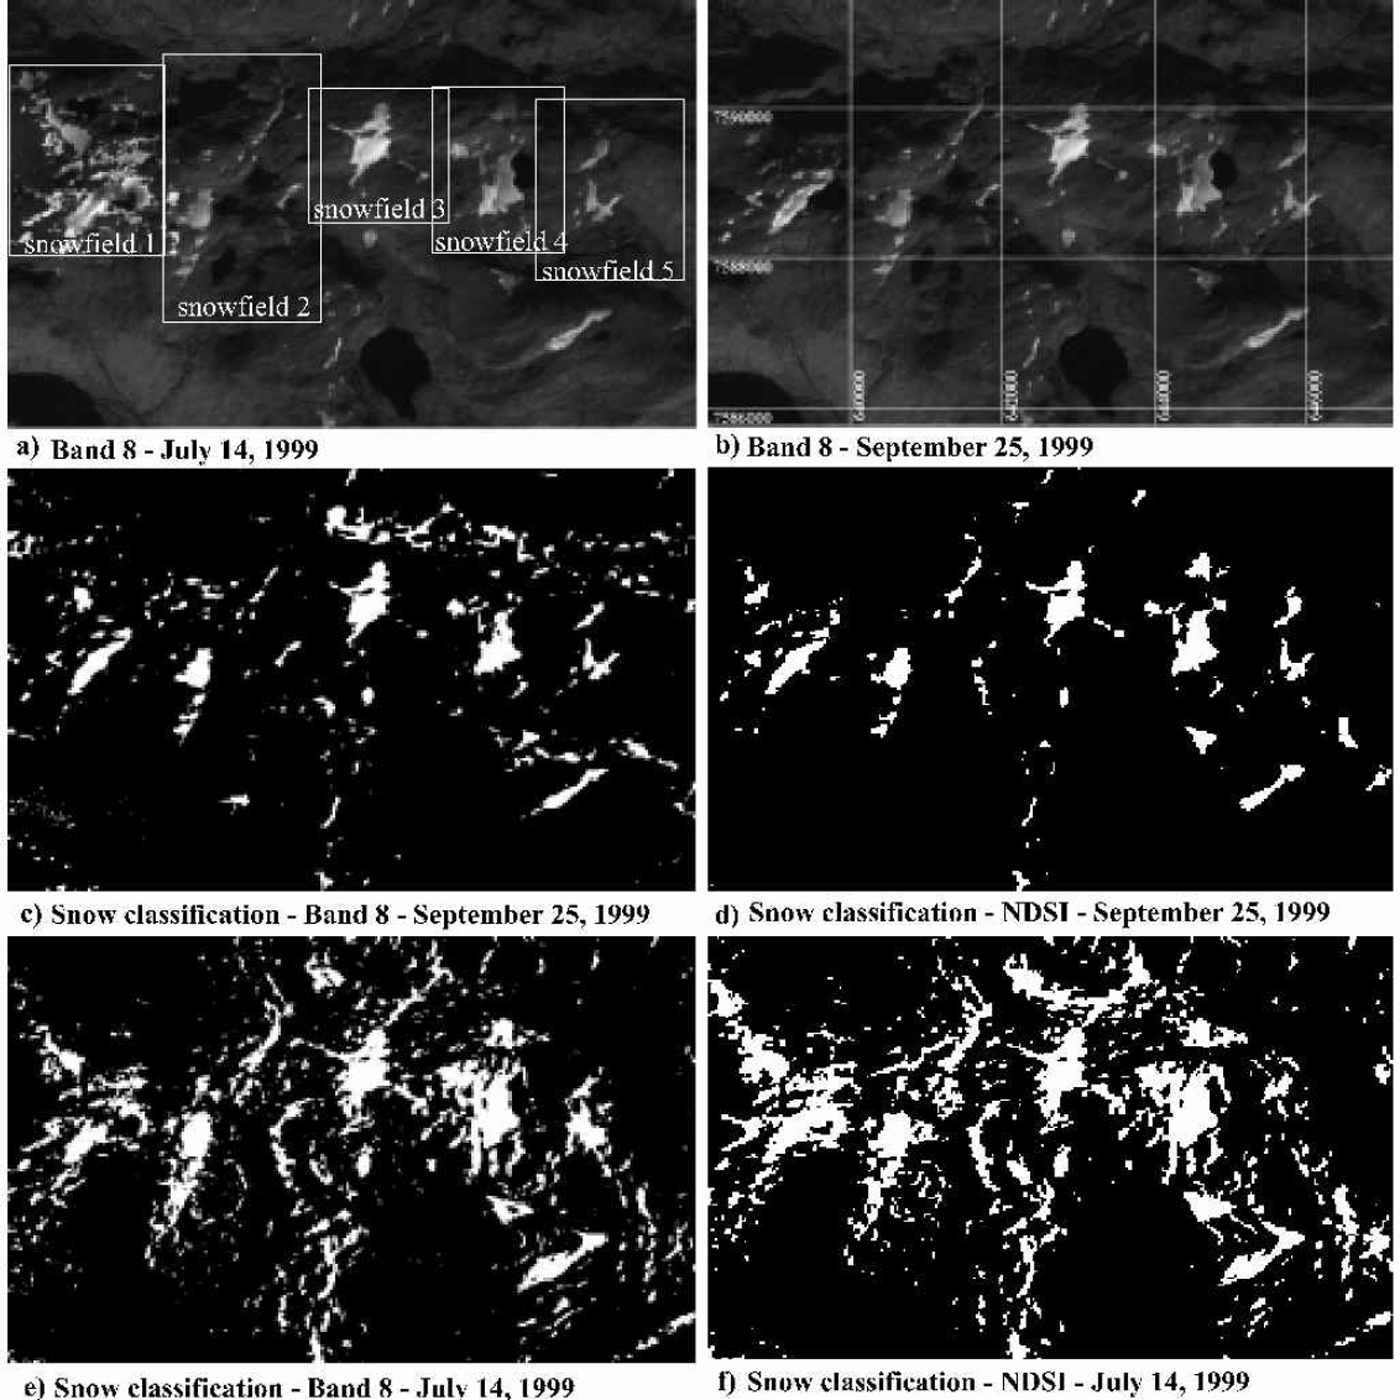
The overview area in the mountains west of Abisko. The grid (b) has a spacing of 262 km and points toward north. The numbers on the gridlines provide the UTM-33 coordinates of the area. (a, b) The Landsat 7 band 8 image of 14 July 1999 (a) and 25 September 1999 (b). Snow is brightest and appears light, while vegetation and soils are gray to dark gray, respectively. Lakes and shadowed area appear nearly black. (c, d) Comparison of the results of the LB8 (c) and NDSI (d) classification for 25 September 1999. (e, f) Results of LB8 (e) and NDSI (f) for the 14 July 1999 image.
Landsat 7
The Landsat 7 satellite was launched in April 1999 and replaced Landsat 5 after the unsuccessful launch of Landsat 6. The orbit of Landsat 7 is sun-synchronous and circles with an inclination of 98.2° at 705 km. The time crossing the Equator is 1000 h ±15 min. As a passive remote-sensing satellite, Landsat 7 is equipped with the Enhanced Thematic Mapper Plus (ETM+). The ETM+ has eight bands and records the Earth’s reflection and radiation in the spectral range 0.450–23.5 μm (see Table 1).
Spectral range and ground resolution of Landsat 7 bands
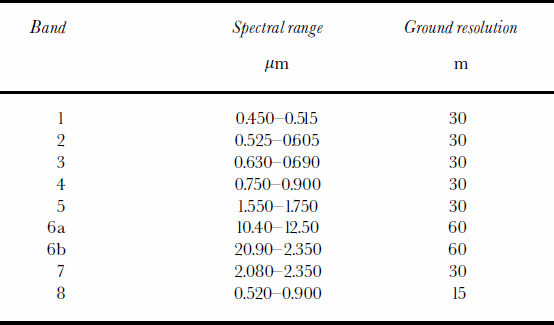
Bands normally used for snow-cover investigations are the visible bands 1 and 2, in which snow is highly reflective while most rocks and vegetation appear dark. Rocks also appear dark in the near-infrared band 4, where vegetation and snow are bright. In the middle infrared bands, 5 and 7, rocks appear bright compared to snow and ice. The combination of bands 1, 4 and 7 or of 2, 4 and 5 is commonly used in false-color images (RGB) to visualize snow. In this study I used the false-color image from bands 2, 4 and 5, referred to as the RGB 245 image. In RGB 245, generally snow and ice appear blue, lakes dark, rocks, vegetation and bare soils reddish brown, and vegetated land green. In the gray-scale converted RGB 245 images shown in this paper, snow appears white, rocks, vegetation and bare soils gray and lakes appear black.
The new Landsat 7 band 8 covers the spectral range of bands 2–4. As snow is reflective throughout the whole spectral range of these bands, it appears brightest (white) in the Landsat band 8 images (Fig.1a and b). Soils and rocks are dark, due to a lower albedo, throughout all bands, while vegetation gains brightness in the spectral range of band 4 and therefore appears dependent on the grade of vegetation coverage (light to dark gray). Clouds are also highly reflective and limit the sole use of band 8 for snow-cover studies. Lakes appear black due to the high absorption of light in water, as do shadowed areas due to the lack of incoming radiation.
Image Processing
This study uses two radiometrically and geometrically corrected Landsat 7 scenes of the Abisko region collected on 14 July and 25 September 1999, referred to as the July and September images, respectively. I used IDRISI 32 image-processing software from Clark Labs and Matlab to calculate radiance and reflectance from the digital numbers and to process the images. To validate the results, photographs of the individual snowfields were taken during fieldwork on 12 and 13 July 1999. To convert digital numbers into radiance (Wm–2 ster–1μm–1) and the reflectance I used formulas provided by NASA (NASA, 2001; see also Reference Markham and BarkerMarkham and Barker, 1986).

where Lmax is spectral radiance for DN255, Lmin is spectral radiance for DN1, Qmax = 255, Qmin = 1 and DN is the digital number from the image.

where d is Earth–Sun distance in astronomical units, esun is the mean solar exoatmospheric irradiance and θs is the solar zenith angle in degrees.
Subsequent values in this paper are either NDSI values or planetary reflectance with radiance in parentheses, unless otherwise stated.
NDSI
The established NDSI uses the brightness of snow in the visible band 2 vs the low reflectivity in the near-infrared band 5. The value is calculated from the difference between bands 2 and 5 divided by their sum(for more information on the origin of the NDSI see, e.g., Reference Kyle, Curran, Barnes and EscoeKyle and others 1978; Reference DozierDozier, 1984).

NDSI values range from –1 to 1. Values of 40.4 are usually assumed to represent snow (Reference DozierDozier, 1989; Reference Hall, Riggs and SalomonsonHall and others 1995). However, a comparison of the results of the NDSI with photographs and the RGB 245 images showed that a threshold value of 0.4 was too low to be used in this investigation. After a careful comparison of the shape of the individual snowfields 1–5, obtained from the NDSI classification, with their shape in the photographs and the RGB 245 image, a threshold value of 0.48 for the July image was found to represent snow most accurately. For the September image the comparison was based on the RGB 245 image only. The corresponding threshold value was 0.6.
As the usage of reflectance compared to digital numbers enhances water, Reference Hall, Riggs and SalomonsonHall and others (1995) used the absorption of water in band 4 to further distinguish between water and snow. Here a threshold value of 8% reflectance was used to separate water from snow. This is similar to the threshold value of 11% used by Reference Hall, Riggs and SalomonsonHall and others (1995).
LB8 Classification
For the LB8 snow-cover classification, I used the high reflectivity of snow over the whole spectral range to separate the snow-covered from the non-snow-covered area. In the July image, pixels with a reflectance of 434% (96.64 W m–2 ster–1 μm–1) were classified as snow. In the September image the corresponding threshold value was 26% (40.76Wm–2 ster–1μm–1). These threshold values were defined, as stated above for the NDSI classification, by comparing the shape of individual snowfields in the analyzed images with their shape in the photographs and the RGB 245 images.
In the September image, mountain shadows from the low angle of the Sun required the development of a separate classification for the shadowed areas. The problem in this additional classification was to eliminate the influence of partially illuminated pixels at the edge of the shadowed area and individual pixels representing water but having a reflectance similar to that of shadowed snow. Multiple steps were taken to reduce the number of pixels incorrectly classified as snow. The shadowed area was first masked, and non-shadowed pixels with a reflectance of 48.6% (13.32 Wm–2 ster–1μm–1) were set to the theoretical value of 159% (244.67 Wm–2 ster–1 μm–1). Next a 363 maximum filter was applied to reduce the influence of partially illuminated pixels at the edge of the shadowed area and to enhance the snow-covered area. Now all pixels with a reflectance of 6.09–8% (9.39–12.34Wm–2 ster–1 μm–1) were assigned as snow by setting their value to 16, while all others were set to 0.
Further steps were necessary to remove snow-classified pixels, incorrectly mapped as snow, outlining the shadowed area. These incorrectly snow-classified pixels were removed by using a 363 edge-enhancement filter (Laplacian filter in the IDRISI module) and then reclassifying pixels with a value of 15–16 as snow. The output of the two separated classifications was finally summed. In a last step I removed individual lake pixels that were incorrectly classified as snow. Here all single snow pixels not connected to other snow pixels were eliminated. Although a few correctly snow-classified pixels were thereby removed, the overall result improved the classification.
Comparison Of The Results
To assess the accuracy of the LB8 classification developed herein, I compared the total amount of snow estimated by the LB8 classification to the total estimated by the established NDSI classification. The two classifications were compared on three different spatial scales: the above-described overview area, the focus area and the five individual snowfields. To qualitatively assess the ability to detect details in the shape and extent of individual snowfields, I compared the results of the two classifications to the RGB 245 image in the case of the September image and to both the RGB 245 image and the available photographs in the case of theJuly image.
Table 2 compares the results of the snow coverage estimated by the two classifications. The results are provided as total snow-covered area in km2 and in percentage of the analyzed area. For each image and analyzed area Table 2 also provides the percentage change in the snow cover for a variation of the NDSI threshold value of +0.04 and of the LB8 threshold value of +5 Wm–2 ster–1 μm–1.
Results from LB8 and NDSI classification

Results And Discussion
Because the LB8 classification developed here in was intended to obtain the minimum extent of snowfields, I will present the results of the overview area briefly and then concentrate in the following discussion on the results of the focus area and the individual snowfields.
Due to the inability of the LB8 classification to distinguish between clouds and snow, the total amount of snow in theJuly image is overestimated by a factor of 2.46. For the September image, where the cloud coverage is low, a 38% overestimation of the snow-covered area by the LB8 classification can be attributed to the inability of the NDSI classification to detect snow in shadowed areas (see discussion below).
In the July image the NDSI classification estimates a snow-covered area of 12.2%. This is 0.5% larger then the estimated snow coverage of the LB8 classification. Comparing the two results with the photographs and the RGB images, we see that the NDSI classification overestimates the amount of snow mainly on the northern slopes of the mountains in a slightly shadowed area (see Fig. 1c and d).
The comparison also showed that the LB8 classification detects greater detail in the shape of individual snowfields. For example, in snowfields 3 and 4 (Fig.2) the LB8 reproduces details such as the small snow-free area within the larger snowfields and smaller snowpatches in the surrounding area. Photographs obtained during fieldwork on 12–13 July 1999 and the RGB 245 images confirmed that most of these areas are actually snow-free or snow-covered areas and not artifacts of the classification. An example is the large snow-free area in
Comparison of the results of the LSB8 snow-cover classification with the results of the NDSI classification. The higher spatial resolution of the LB8 classification (a, d, g) reproduces details with more accuracy then the NDSI classification (c, f, i). (b, e, j) Gray-scale converted false-color composite images (RGB 245) of the same area. (h) Band 8 image of snowfield 4 for comparison. In the classification images, snow is white. In the RGB and band 8 image, snow is white to light gray, while soils and bare rocks are dark gray. The lake in the image of snowfield 4 shows up black. The gridlines in (j) and (d) are pointing north and have both a vertical and horizontal distance of 500 m. The numbers on the gridlines provide the UTM-33 coordinates.

the center of snowfield 3 (Fig. 2a–f), which connects in the September image to the smaller one in the west. The September RGB image (Fig. 2e) shows that this snow-free area, a small step in the terrain, is surrounded by snow on 25 September 1999. In Figure 2f and g the NDSI classification overestimates the width of the ∼30m wide band of snow on the eastern side of the lake (unpublished data fromJuly 1999).
To test if these details are only due to the higher resolution of band 8, I resampled the Landsat band 8 images, averaging up the pixel values from the 15×15m Landsat band 8 resolution to the 30×30m resolution of bands 2 and 5, and re-analyzed the image. The total amount of snow from the classification with the merged band 8 image corresponded well with that of the higher-resolution image. The lower-resolution image tended to show about 1–8% less snow than the higher-resolution image. The same details in the shape of the analyzed snowfields (described above) can also be found in the lower-resolution image, so the ability of the LB8 classification to show more detail of the shape and extent of individual snowfields cannot be attributed solely to the higher resolution of the Landsat 7 band 8.
For the September image of the focus area, the total amount of snow classified by the LB8 classification is 5.7% of the analyzed area. This is 34% more than the snow coverage estimated by the NDSI classification. The difference between the two classifications is a result of the separate classification of snow in the shadowed areas included in the LB8 classification. While the LB8 classification can reproduce part of the shadowed snowfields, the NDSI does not reproduce any of this snow. This is most likely also the reason for the overestimation of snow extent in the overview area in the September image.
Summary
The two classification methods produced similar estimates of snow coverage for cloud-free areas. In the focus area, the NDSI classification slightly overestimated (by 5%) the total amount of snow coverage in the July image, and did not detect snow coverage within the shadowed area on the steep northern side of the mountain in the September image. For the analyzed snowfields, the LB8 classification detected the shape and extent of snowfields in greater detail and more accurately, as the comparison with photographs (available only for the July image) and the RGB 245 images had shown. Finally, in the September image the LB8 classification characterized snow coverage in shadowed areas, whereas the NDSI classification failed to do so.
Conclusion
I conclude that the LB8 snow-cover classification developed here is able to classify snow-covered areas in cloud-free images as accurately as the established NDSI classification. The disadvantage of the LB8 classification is its inability to distinguish between cloud and snow coverage. In cloud-free images, the NDSI classification tends to slightly overestimate the snow-covered area compared to the LB8 classification. The main advantage of the LB8 classification is its higher resolution of 15×15m, which is particularly useful when monitoring the extent of individual snowfields. The LB8 classification provides much more detail on the shape and extent of snowfields than the NDSI classification, which cannot be attributed solely to its higher resolution. Therefore, together with the Landsat 7 acquisition plan, the LB8 classification could be used to monitor changes of individual snowpatches or glacier termini not detectable earlier with the available satellite technology. In particular, this approach will be useful for climate-change studies in Arctic regions like northern Scandinavia, where temperature records measured over the last 30 years do not show the general large increase in temperature of up to 2°C but show either stagnation or slight decrease in the annual temperature (Reference Chapman, Walsh, Weller and AndersonChapman and Walsh, 1998). In these regions changes in the snow coverage might be small but will inform us early, when detected, about future tendencies and therefore should be monitored carefully.
Acknowledgement
The author would like to thank S. Tulazyck of the University of California Santa Cruz for making the satellite images available.



