Introduction
Considerable effort has been made during the past 30 years to measure the concentrations of heavy metals, especially the toxic metals lead, cadmium and mercury, in polar ice (Reference Murozumi, Chow and PattersonMurozumi and others, 1969; Reference Wolff and PeelWolff and Peel, 1985; Reference Boutron, Gorlach, Candelone, Bolshov and DelmasBoutron and others, 1991; Reference Suttie and WolffSuttie and Wolff, 1992). Such studies offer a unique opportunity to reconstruct the temporal evolution of the atmospheric concentrations of these species. In recent years, special attention has been paid to the investigation of lead concentration in Antarctic snow and ice because it is a sensitive indicator of anthropogenic activity (Reference Scarponi, Barbante, Turetta, Gambaro and CesconScarponi and others, 1997). Unfortunately, much of the pre-mid-1980s data in the literature is now considered unreliable (Reference Peel, Oeschger and LangwayPeel, 1989; Reference WolffWolff, 1990; Reference Boutron, Candelone and HongBoutron and others, 1994). Reference Peel, Oeschger and LangwayPeel (1989) analyzed the lead-concentration data taken before 1990 in ancient and present precipitation in Antarctic and Arctic regions, and believed that most of the data suffered from contamination. Consequently, reliable lead data from the Antarctic ice sheet are extremely rare. In order to obtain reliable data, extreme precautions must be taken throughout sampling, transportation and analysis procedures, and sensitive analytical techniques are necessary. To date, the reliable data largely cover only a few years (around 1980) at sites along the coast of Antarctica (Reference Wolff and PeelWolff and Peel, 1985; Reference Boutron and PattersonBoutron and Patterson, 1987; Reference Scarponi, Barbante, Turetta, Gambaro and CesconScarponi and others, 1997). Snow-firn cores collected at D55, East Antarctica, reveal lead concentrations over the last two centuries (Reference Boutron and PattersonBoutron and Patterson, 1983) and the period 1940-80 (Reference Gorlach and BoutronGörlach and Boutron, 1992). A longer record is available from Dome C and Vostok station, but with only sparse sampling (Reference Boutron and PattersonBoutron and Patterson, 1986; Reference Boutron, Patterson, Lorius, Petrov and BarkovBoutron and others, 1988,Reference Boutron, Bolshov, Koloshnikov, Patterson and Barkov1990) over the past 27 ka BP and the last climatic cycle. Therefore, there is a gap in our understanding of lead-concentration distribution over the whole of Antarctica. Glaciological investigation along the International Trans-Antarctic Expedition (ITAE) route in 1990 offered a unique opportunity to study the geographic distribution and environmental significance of lead in surface snow over the Antarctic ice sheet.
Experimental Procedures
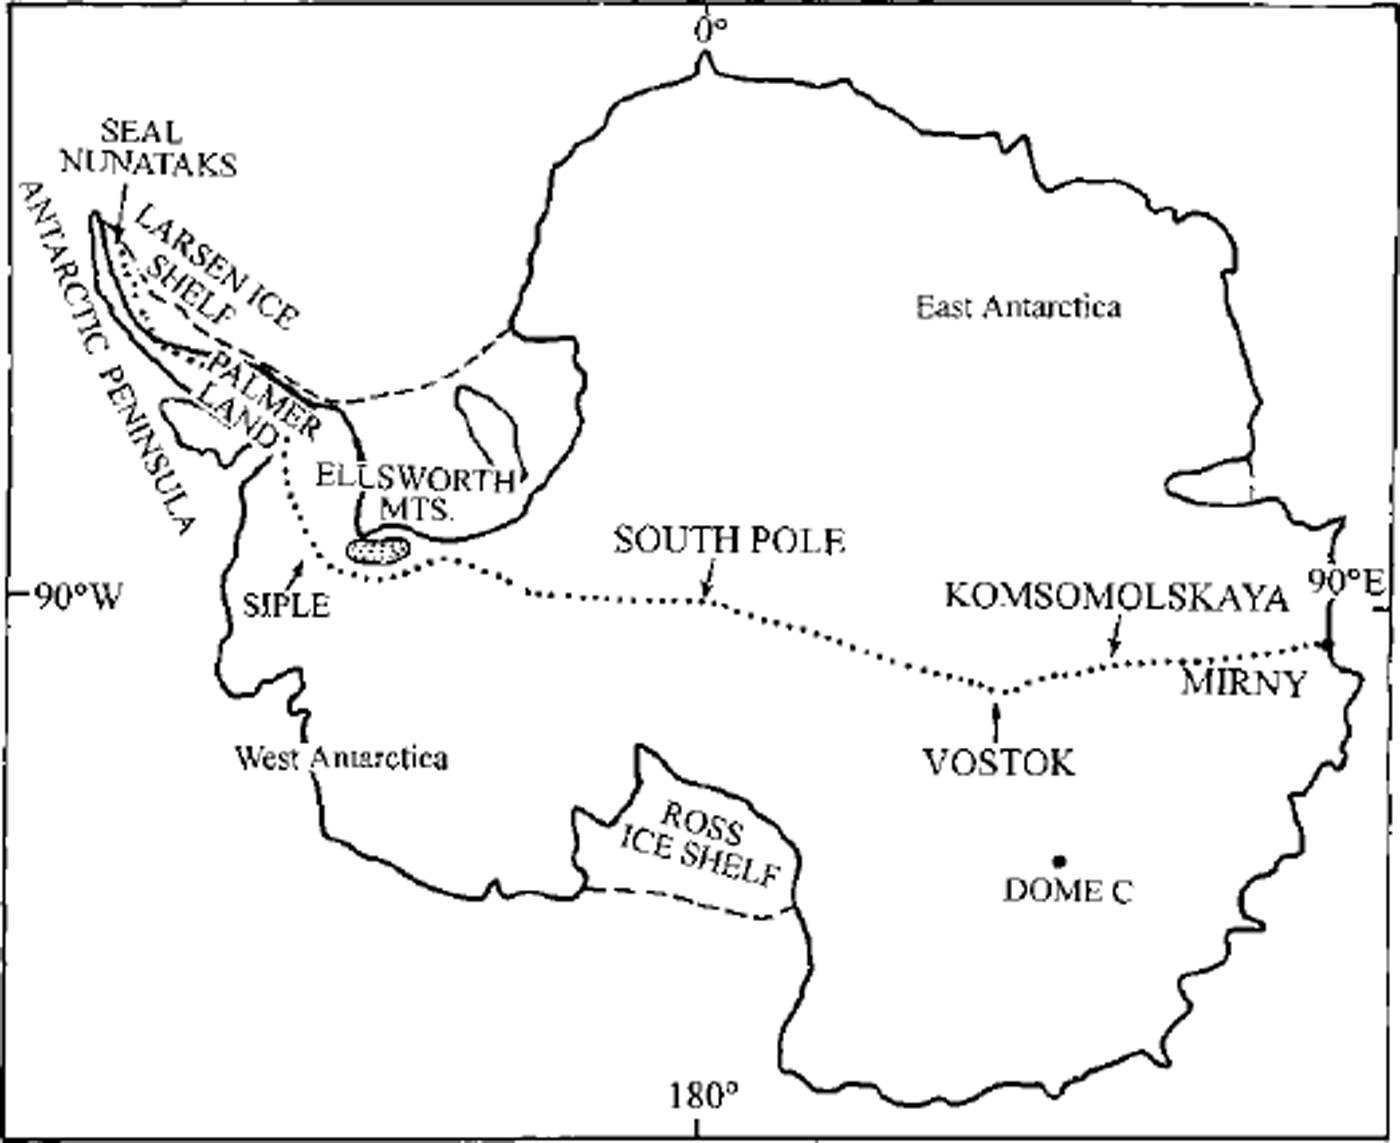
Between 27 July 1989 and 3 March 1990, 25 cm surface snow samples at 97 sites along the 5896 km ITAE route were collected in polyethylene bottles (Fig. 1). The bottles were washed three times using Milli-Q,-Water, and air-dried in a class 100 ultra-clean laboratory. The washed bottles were packed in clean bags in a clean room and opened only during sampling. To minimize contamination, the sample collector was dressed in full clean clothing (coverall, hood, boots and polyethylene gloves) throughout sampling. All samples were kept frozen during transport. Lead concentration was measured by laser excitation atom fluorescence spectroscopy (LEAFS) analysis in a class 100 ultra-clean room in the Laser Single Atom Detection Laboratory, Department of Modern Applied Physics, Tsinghua University, Beijing, China. Each sample was measured seven times (discarding the maximum and minimum values, then averaging) and the standard was measured before and after sample measurements. The detectivity of this technique for lead is 0.2 pg g−1, and the accuracy is about 10%. The laboratory blank value for lead is about 2 pg g−1; the reported concentrations have the blank value subtracted (Reference Dahe, Jiawen, Junying, Dieyan, Keling and LiQin Dahe and others, 1995; Reference MengXue Meng and others, 1997).

Fig. 1. Sketch map showing the sampling sites along the 1990 ITAE route. The expedition started on 28 July 1989 and ended on 3 March 1990, covering 5896 km in 220 days. It crossed major geographic zones of Antarctica, including the Larsen Ice Shelf, the Antarctic Peninsula, the Ellsworth Mountains and the Antarctic Plateau. Sampling sites were located along the route every 60 km.
Results
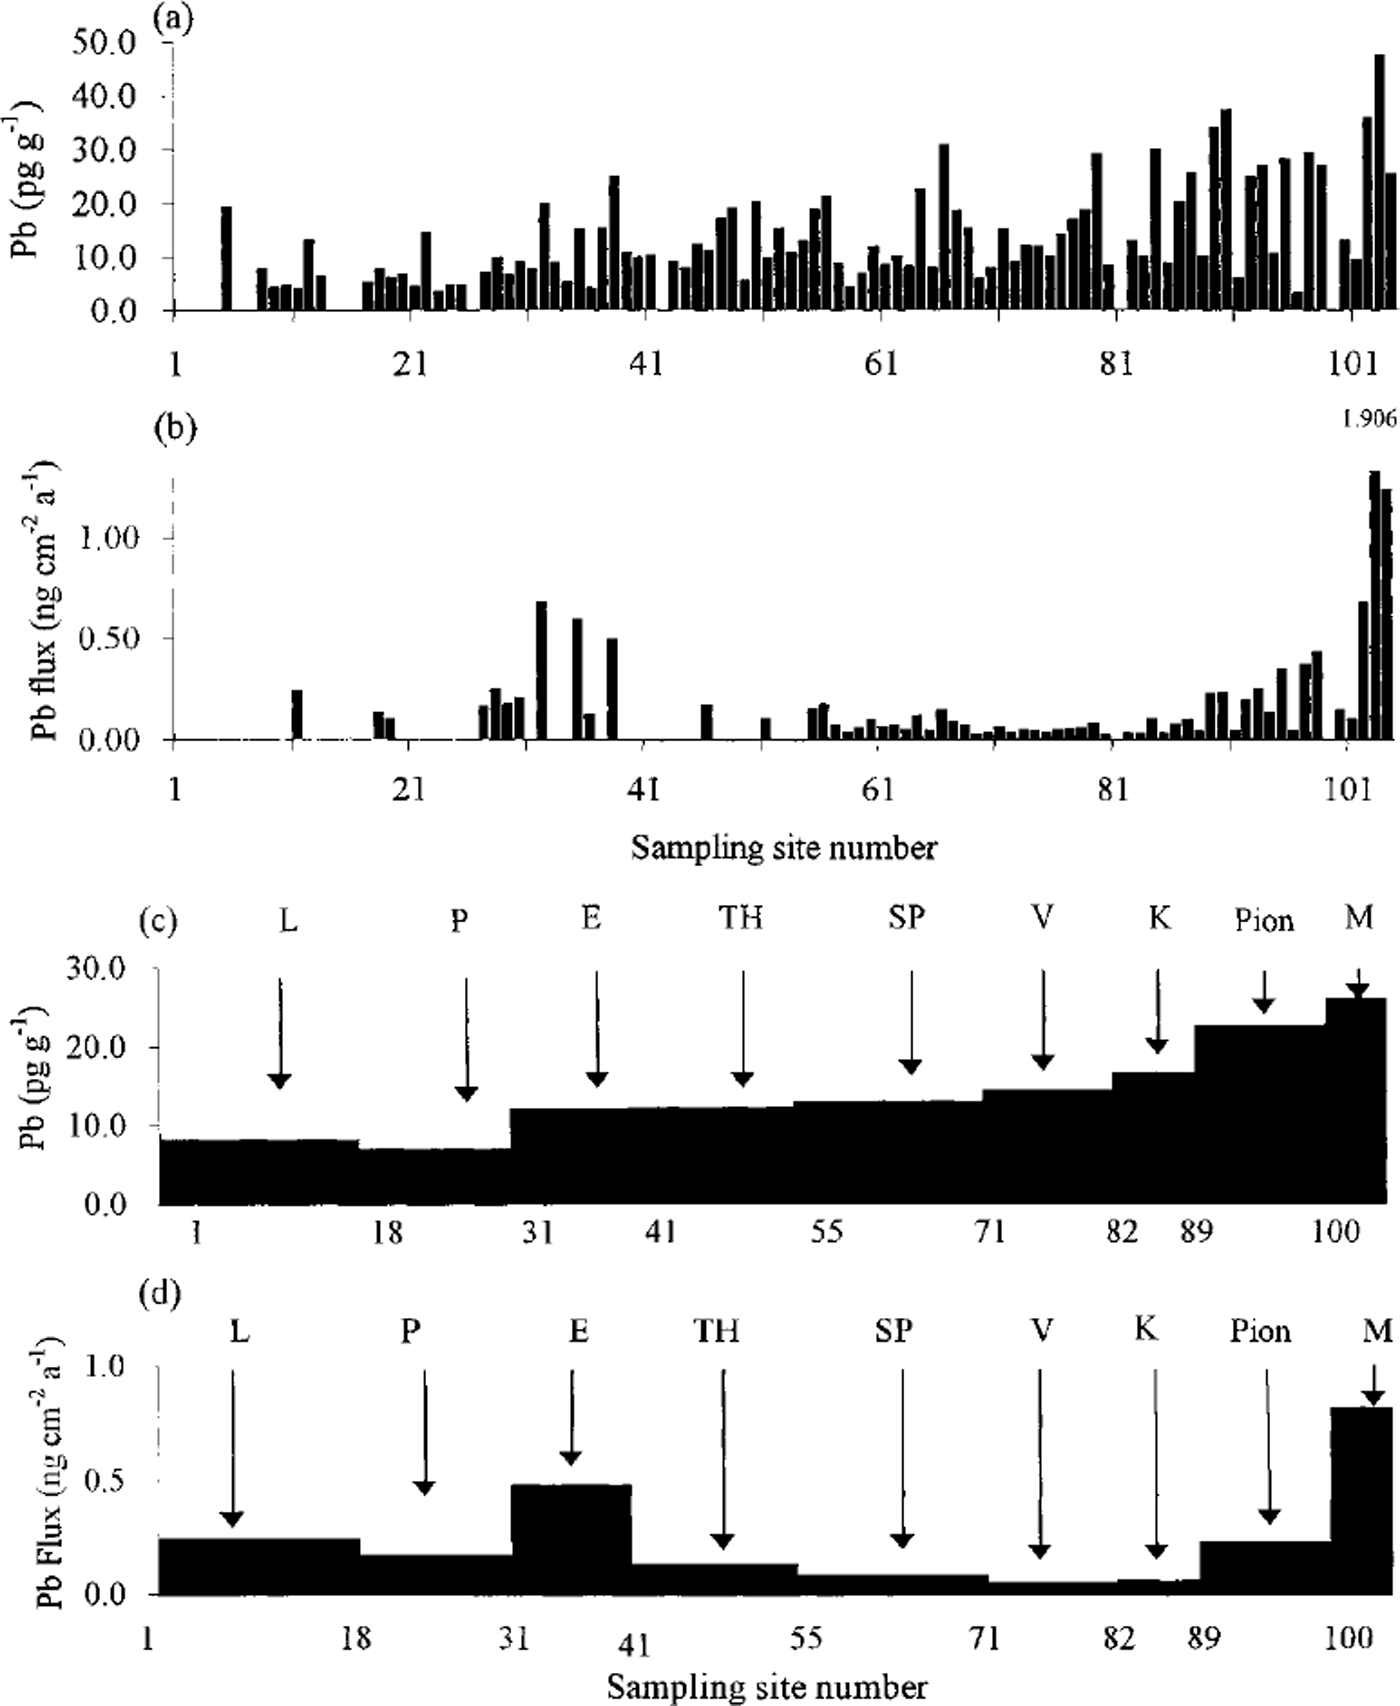
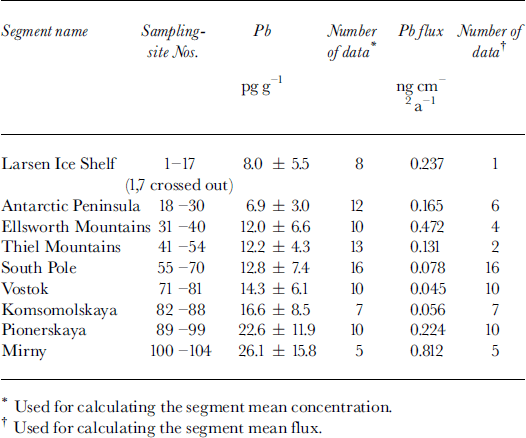
Lead concentrations at sites 1 and 7 (located on the Larsen Ice Shelf in the north of the Antarctic Peninsula) were about 1000 and 64 pgg−1, respectively. These values are much higher than those for surrounding sites. An alloy knife was used for snow-pit sampling at sites 1-7 because the snow layer was hard in this area. This may have resulted in the elevated lead concentrations. Ninety-one reliable Pb samples were obtained, with a mean of 13.7 pg g−1, a median of 10.4 pg g−1, a range of 3.1-47.3pg g−1 and a standard derivation of 9.0 pg g−1. There were ten samples whose lead concentration was <5 pg g−1, 35 samples between 5 and 10 pg g−1, 29 samples between 10 and 20 pgg−1, and 17 samples higher than 20 pgg−1, accounting for 11%, 38%, 32% and 19% of all samples, respectively. The lead flux was calculated for those sampling sites where accumulation rate was available, by multiplying the lead concentration and the accumulation rate. Lead-concentration and flux data are reported inTable 1, and plotted in Figure 2a and b, respectively. In order to determine the regional values of lead, the ITAE route was divided into nine segments according to geographic character (Table 2). Mean concentrations of each segment are listed inTable 2 and plotted in Figure 2c. The mean lead concentration from the Ellsworth Mountains segment to the South Pole segment (12.3 pg g−1) is about double that of the Larsen Ice Shelf and Antarctic Peninsula segments (7.4 pg g−1), while the mean lead concentration of Pionerskaya and Mirny segmerits (24.4 pg g−1) is three times that of the Larsen Ice Shelf and Antarctic Peninsula segments. It is clear that the lead concentration increases continuously from the Ellsworth Mountains to Mirny station.

Fig. 2. Distribution of lead concentration andflux along the ITAE route, (a) Pb concentration (site by site); (b) Pbflux (site by site); ( c) the mean Pb concentration of different geographic units; (d) the mean Pb flux of different geographic units. L, Larsen Ice Shelf; P, Antarctic Peninsula; E, Ellsworth Mountains; TH, Thiel Mountains;, SP, South Pole; V,Vostok; K, Komsomolskaya; Pion, Pionerskaya; M, Mirny.
Table 1. Pb concentration and flux of 25 cm surface snow and interrelated data along the 1990 ITAE route. (Continuation)

Table 2. Mean Pb concentration and flux in nine segments along ITAE route

The lowest lead flux (0.045 ng cm−2 a−1) appeared in the Vostok segment of the route. The lead flux in the regions from Pionerskaya to Mirny station is around double that of the region from Larsen Ice Shelf to the Ellsworth Mountains (Table 2; Fig. 2d).
Discussion and Conclusion
Natural and anthropogenic sources can contribute to the lead concentration present in Antarctic snow. Reference Boutron and PattersonBoutron and Patterson (1987) reported that the relative contribution of soil dust, volcanoes and the oceans to measured lead in Antarctica is about 0.5 pg g−1. If this is the case for the whole of Antarctica, our lead data indicate that most of the lead in the Antarctic precipitation is a result of human activity.
Previously published lead data for Antarctic surface snow are listed in Table 3. Reference Boutron and PattersonBoutron and Patterson (1987) collected large blocks of surface snow at South Pole and Terre Adelie, East Antarctica, and reported lead concentrations of 6.6,7.4, 2.3 and 6.3 pg g−1 for sites D40, D47, D80 and South Pole, respectively. A 3 m snow pit was dug by Reference Scarponi, Barbante, Turetta, Gambaro and CesconScarponi and others (1997) on the high plateau of Victoria Land, East Antarctica. They reported a lead-concentration decrease from 8.4 pg g−1 in 1986 to 2.5 pg g−1 in 1991 and a corresponding fallout-flux decrease from 0.184 to 0.034 ng cm−2 a−1. The decreasing trend was assumed to be related to the decrease in the consumption of leaded gasolene in the Southern Hemisphere. Reference Wolff and PeelWolff and Peel (1985) reported a lead level of 6.3 ±3.3 pg g−1 in present precipitation, probably representing just one snowfall in late January 1980 in southern Palmer Land. Reference Suttie and WolffSuttie and Wolff (1992) obtained 2 year seasonal variations of lead in Antarctic snow through the detailed analysis of a 1.7 m snow pit recovered from Dolleman Island on the east coast of the Antarctic Peninsula in December 1985. The lead concentration was in the range 1-9pg g−1 with a mean of 4.0 pgg−1. Significant seasonality with an autumn/winter maximum is in accordance with variations in marine and crustal aerosol input ascribed to enhanced transport of atmospheric lead from the other continents to Antarctica during winter. In this work, the mean lead concentration for winter snow on the Larsen Ice Shelf and Antarctic Peninsula was 7.4 ±4.1 pg g−1. If seasonal variation and location are considered, the mean lead concentration for segments of Larsen Ice Shelf and Antarctic Peninsula is very close to the value of 6.3 ±3.3 pg g−1 at southern Palmer Land in 1980. There are no obvious differences in lead concentration in the precipitation from 1980 to 1989 in the Larsen Ice Shelf and Antarctic Peninsula regions.
Table 3. Available reliable Pb data for Antarctic snow

The reported lead concentrations at several different sites in Antarctica are quite similar (Table 3). All of the reported samples, except from South Pole, were collected from coastal regions. The lead concentration in coastal regions may not reflect the situation for the inland Antarctic Plateau.
The large seasonal changes in solar insolation reaching the Antarctic ice surface modulate the intensity of the katabatic wind regime and thus the resulting mean meridional circulation between the Antarctic and subpolar latitudes. The mean meridional circulation is well defined throughout the year by (i) intense, shallow outflow presumably associated with the katabatic wind regime below approximately 700 hPa, (ii) rising motionjust to the north of the continent at 60-65° S, (hi) a broad return branch from approximately 400 hPa to well into the stratosphere, and (iv) subsidence over the Antarctic. The mass redistribution extends to the subtropics of the Southern Hemisphere during austral autumn and spring transition periods (Reference Parish and BromwichParish and Bromwich, 1997). A series of aerosol measurements (Reference HoganHogan, 1979) over Antarctica show that the most frequent transport route of aerosols to the polar plateau is near the lower troposphere to mid-troposphere, especially those layers below 400 hPa. In addition, there is a weak front over the Transantarctic Mountains at approximately 85° S, which divides extremely stable continental Antarctic cold air from peripheral Antarctic air. For coastal stations, katabatic winds tend to drive local pollution away from the continent, so few of these emissions should reach the continental interior, except when cyclonic systems penetrate the interior. On the high plateau, the presence of cold high pressures dramatically reduces the influence of oceanic air masses. The atmosphere over the high interior plateau may be considered to be a background atmosphere that is supplied by long-range transport of impurities from extra-Antarctic sites.
Reference Scarponi, Barbante, Turetta, Gambaro and CesconScarponi and others (1997) reported that the lead concentration in a snow pit from Victoria Land (150 km from the coast) decreased during the period 1986-91. Based on the atmospheric circulation mentioned above, it is possible that the pollutants emitted from the Southern Hemisphere outside of the Antarctic reached the continent by meridional transport, especially through the lower to mid-troposphere. This may be the case for the region from the Larsen Ice Shelf to the Ellsworth Mountains. Lowest lead concentrations and high lead fluxes may be explained by the high accumulation rates in this region, because precipitation events may scavenge the impurities in the atmosphere effectively and dilute the concentration.
The region from the Thiel Mountains to Komsomolskaya is controlled by stable continental air, where oceanic air mass input is rare. When strong subsidence is present, the impurities in the upper troposphere and stratosphere may reach the surface, supplied by long-range transport. This may explain why the lead flux is very low (0.064 ng cm−2 a−1) in this area, although the lead concentration is higher than in West Antarctica (from the Larsen Ice Shelf to the Ellsworth Mountains). The lead concentration increases from Vostok to Mirny and there is an accompanying dramatic increase of lead flux. It is well known that the 1450 km passage from Vostok to Mirny was an important land and air supply line for Soviet Antarctic expeditions. The use of gasolene and diesel oil in large motor vehicles, generators and airplanes results in enhanced lead concentration in this region. Moreover, the lead content in the gasolene utilized by the Soviet Union was 2.5 times higher than standard for Western countries. The atmospheric high-pressure system over the Vostok and Pionerskaya area favours the transport of local emissions into downwind areas. We suggest that the area from Vostok to Mirny has been polluted by local anthropogenic impacts more seriously than other areas.
Acknowledgements
This project was supported by the Chinese Academy of Sciences (KZ951-A1-205) and the State Commission of Science and Technology of China (98-927-01-05 and 98-927-01-07). We thank ITAE members and staff for their help. We would also like to thank Li Hui, Yi Rong and Xue Meng of the Department of Modern Applied Physics, Tsinghua University; Xiao Guili of the Science Instrument Factory of the Chinese Academy of Sciences; and Li Shuling of the Research and Analysis Institute of Rock and Minerals, Geological Academy, for their help in sample analyses processes; Wang Xiaoxiang for her help in sorting the data; and YaoTandong for suggestions.


