


Introduction
Snow–air transfer processes are important in a variety of fields. Ice-core interpretation requires knowledge of the transfer of mass and chemical species through the snow and firn before they become embedded in the ice-core record. Recent findings in atmospheric chemistry suggest that some of the key processes for boundary-layer ozone depletion may in fact not be occurring in the atmosphere, but instead in the underlying snowpack (Reference Sumner and ShepsonSumner and Shepson, 1999). the air–snow transfer processes affect the concentrations of the chemical species in the snow (Reference Waddington, Cunningham, Harder, Wolff and BalesWaddington and others, 1996; Reference GjessingGjessing, 1997), and are dependent on the physical properties of the snow. the primary material parameter for advective processes is permeability, which, for snow, reflects the nature of the interconnected pore space and controls the degree to which a fluid or gas may move through the snow. Most of the modeling studies of air advection through snow (ventilation) have assumed that the snow is uniform (e.g. Reference ColbeckColbeck, 1989; Reference Cunningham and E. D.Cunningham and Waddington,1993), and although a few have included varying permeability with depth (Reference AlbertAlbert, 1996; Reference McConnell, Bales, Stewart, Thompson, Albert and RamosMcConnell and others, 1998), all have assumed that the permeability is a scalar. Reference AlbertAlbert (1996) presented measurements of firn permeabilities at Summit, Greenland, that showed that firn permeability is directional for some samples; in particular, samples that contained hoar layers had a much larger lateral permeability than a vertical permeability. the current work contains additional measurements and microstructure analysis on samples of uniform firn in order to assess the impact of crystal structure on the directional nature of permeability. These measurements will contribute to a better understanding of air–snow transfer processes and will be useful in modeling for chemical transport through snow.
Methods
Selected 10 cm samples from a 13 m firn core from Summit were obtained approximately 1m apart down through the firn. the layers analyzed were at least 10 cm thick, so the same samples of snow could be measured for permeability in both lateral and vertical directions. In addition, they were layers that visually appeared to contain a uniform snow microstructure pattern (e.g. each sample was composed of only one layer of snow and had no visible stratigraphic horizons within the sample).
The permeability of each sample was measured using an airflow permeameter (Reference Albert, Shultz and PerronAlbert and others, 2000). the airflow and pressure drop through the sample were measured at a variety of user-set flow rates. for flow rates in the linear regime, Darcy’s law was used to calculate the permeability given the measured flow rates and pressure drops across each sample. for each sample, 6–8 pairs of flow rates and pressure drops were measured, all of which almost perfectly fit upon a linear regression line ensuring the suitability of Darcy’s law to describe the flow. After the vertical permeability was measured for each sample, a core from the sample was drilled laterally and the permeability measured. Stratigraphic ``up’’ relative to the sample’s prior polar surroundings was noted because the microstructure analysis is directionally dependent. the density of each sample was measured using a balance.
Thick sections representing vertical and lateral sections of the sample were cut and preserved using dimethyl phthalate pore filler for processing as described by Reference PerlaPerla (1982). the vertical thick section was cut downwards through the core, and lateral sections were cut laterally through the core (Fig.1). Each section was then halved lengthwise and microtomed. Microtoming eliminates imperfections such as bumps or notches that would otherwise cause spatial deformities during the imaging process. After sublimation, in which the dimethyl phthalate sublimation rate is insignificant compared to that of the snow, the sample was brushed with copier toner to distinguish between the snow and the air spaces. the toner occupies the air spaces which the snow previously occupied.
Orientation of permeability and thick-section measurements. Arrows represent airflow through the sample. Stratigraphic ``up’’ is toward the top of the page on the diagrams. the dotted areas represent samples cut for thick-section micro-structure analysis.

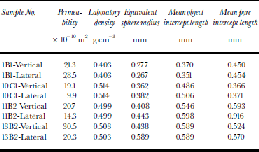
The samples were digitally imaged, and the negatives of the images were obtained so that the spaces that were snow appeared white and the spaces that were voids appeared black. Digital image-processing software (Image Processing Workbench) was used to automatically calculate microstructural characteristics (Table 1) such as density, equivalent sphere radius, mean object intercept lengths, and pore lengths. Assuming uniformity in the third dimension, the equivalent sphere radius is defined as the mean radii of spheres that have areas equal to that of any group of interconnected snow crystals, and the mean object intercept is the average span across the image of a group of interconnected snow crystals. the mean pore intercept length is the average span across the image of interconnected pore space. In the digital image processing, the contrast on the image was chosen to ensure that the digitally calculated density matched the measured laboratory density of the sample. the error in these measurements corresponds to the laboratory-measured density, which is about 10%. the program digitally calculates the density by determining the amount of white pixels per unit area and assuming that the third dimension of the thick section is uniform.
Microstructure statistics for samples with>20% difference between the measured vertical and lateral permeabilities
Permeability
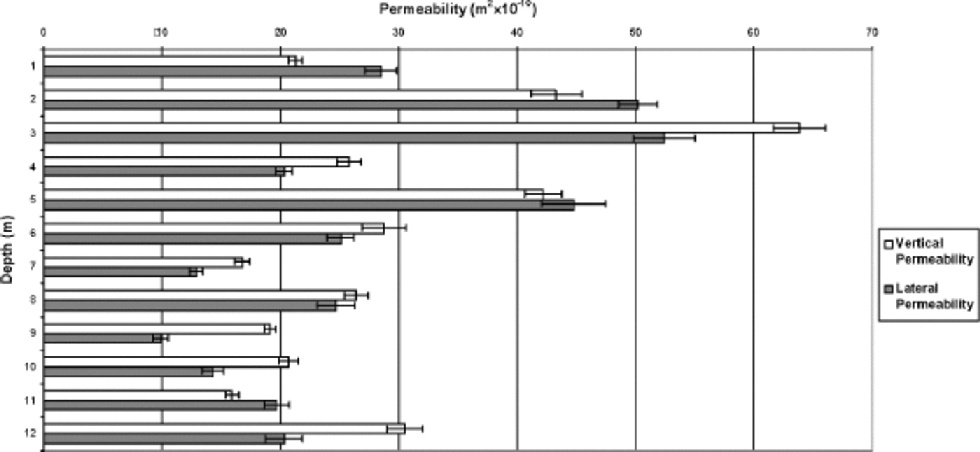
The measured lateral and vertical permeabilities are depicted in Figure 2, a comprehensive graph of the bidirectional data. the error bars at the end of each bar reflect the span in the eight replicate measurements for each sample. Replicate measurements using different flow rates on the same sample vary by 513.2 %. the overall permeability pattern, increasing permeability in the top several meters with decreasing permeability below that, follows the general trend observed in Greenland and Antarctica (Reference Albert, Shultz and PerronAlbert and others, 2000; Reference Albert and ShultzAlbert and Shultz, 2002). However, a clear difference can be seen between lateral and vertical permeability. for the uniform firn samples examined here, lateral permeability is larger in the near-surface snow layers. Below approximately 3 m depth, the vertical permeability generally becomes greater than the lateral permeability. the compaction of the overlying snow may cause deformation of the firn as weight increases with depth; however, more samples are needed to further investigate this idea.
Permeability vs depth: lateral and vertical permeabilities for selected layers of the top 13 m of firn. Permeability measurements using different flow rates on the same sample vary by 513.2%.
Microstructure
Air-flow direction
The thick sections (Fig. 3) correspond to vertical and lateral samples of the core. Stratigraphic ``up’’ is up on all images; the direction of airflow is up for the vertical sections and out of the page for the lateral images as depicted in Figure 1. the vertical thick sections represent the pathway through which the air would flow when the sample is measured for vertical permeability. the lateral section is then a cross-section of the microstructure through which the air is flowing for a vertical permeability measurement, and therefore represents the amount of open pore space in that layer of the core. for the lateral permeability measurements, the converse is then true of the air pathways.
Microstructure images for selected depths where lateral and vertical permeabilities differ by 20%.

Thick-section analysis
The microstructure images (Fig. 3) are from selected depths in the firn where lateral and vertical permeabilities differ by 420%. Only the samples that had lateral permeabilities greater than 20% deviation are presented, as we have found through experience that variation up to 10% can occur on different samples within the same layer at different nearby locations.
Sample 1B1 in Figure 3 depicts the vertical and lateral sections of a sample taken from the first meter of the core. the vertical sample had a permeability of 21.3610–10 m2, compared to 28.5610–10 m2 for the lateral sample. However, the vertical thick section visually appears to have more available space for airflow than the lateral thick section, due to an apparently greater pore area. This observation suggests that visual evidence alone is not sufficient to explain the discrepancy in permeability between different directional thick sections of the same snow core.
Samples 10C1,11B2 and 13B2 in Figure 3 show vertical and lateral microstructure images from layers of snow deeper in the firn. Compaction of the ice crystals is evident with increasing depth, from visual inspection of the thick sections. the upper layers of snow have more well-defined air channels with individual crystals present, as shown in sample 1B1. With depth, the crystals begin to compact and grow onto each other, and air channels become more difficult to define (Fig. 3; samples 10C1,11B2 and 13B2).
Relevant statistics from the image processing of these samples are given in Table 1. Compaction causing recrystallization and metamorphism is evident as mean object intercept length and equivalent sphere radius increase with depth; however, only equivalent sphere radius appears to be significant in comparing bidirectional permeabilities. Mean object intercept length increases with depth, but sample 13B2 has equivalent statistics for both vertical and lateral samples, so this statistic is not sufficient in determining bidirectional permeability differences. Mean pore length does not correlate with permeability data, as the mean pore intercept length takes into account the distance between pores separated by crystals but does not indicate the mean free path that the air can take through the snow. Mean free path corresponds to the average span of interconnected pore space in the direction of airflow. However, the directional sample with the greater permeability also has a lesser equivalent sphere radius. the difference between the two statistics is that mean object intercept length scans across the thick section, whereas equivalent sphere radius takes the entire crystal into account and transforms it into a sphere of equal area. the equivalent sphere radius correlates with permeability in the top and bottom few meters of the core, but not the middle of the core. the top 2m correlate because flow path does not contribute as much to the overall permeability as does grain-size. As seen in Figure 3 (sample 1B1), compaction and metamorphism has not yet occurred, causing individual grains to be more pronounced than conglomerations of grains; therefore, flowpaths are numerous.
Permeability may be a function of mean free-path length, so pore area alone is not a good indication of the permeability of a snow sample; additional microstructural statistics are needed before one can infer the permeability of a sample from only microstructural characteristics. Mean free-path length could be a useful statistic since it may show some impact of the tortuosity of the medium on the drag of the airflow through the path. Thus samples with numerous tortuous pathways would be expected to be less permeable than samples with many less tortuous pathways.
Conclusions
There does exist a significant difference between lateral and vertical permeability measurements of the same layer of firn core even though both directional samples follow previous polar trends. As is evident from the microstructure statistics, a clear correlation between microstructure and the difference between vertical and lateral permeability may be evident with equivalent sphere radius and mean free-path length. the equivalent sphere radius may be an indication of the difference in bidirectional permeabilities in the top few meters of core and at points past major recrystallization and metamorphism stages from 8 m downwards. Mean object intercept length and mean pore length do not correlate well with bidirectional permeability measurements. the above findings may prove useful in future chemical modeling and in the future understanding of air–snow transport processes. A study of mean free-path length and of the interrelationship of each pore in a thick section may produce useful results and will be investigated in the future.
Acknowledgements
We thank VECO polar support services for excellent field support in Greenland. This work was made possible by the Dickey Center of Dartmouth College through a Stefansson Fellowship for G.L., and by the U.S. National Science Foundation through research grant NSF-OPP 9813441 and 9907330.



