

Introduction
To western readers, analyzing a new healthcare system in the East might seem daunting. Indeed, it takes some of us decades to master an understanding of the healthcare system of our origin country. Nevertheless, there are several methods for approaching an analysis of another country’s healthcare system. These include exposition of some (hopefully) invariant principles regarding healthcare that apply across contexts: analysis of what a system of health might look like; comparison with the US system (with which many are already familiar); comparison with other emerging systems such as India; application of existing frameworks for healthcare system analysis; and an appraisal of the major transitions under way in the country’s socioeconomic, epidemiologic, and economic profile. This chapter analyzes China’s healthcare system using each of these methods.
Some Invariant Principles of Healthcare Systems
The Iron Triangle
One way to analyze a healthcare system is in terms of a set of principles that are (or at least seem to be) invariant across cultural contexts. One principle is that every system aspires to achieve both efficiency and effectiveness. “Efficiency” encompasses three intermediate ends: ensuring access to healthcare, promoting the quality of healthcare, and controlling the cost of healthcare. “Effectiveness” encompasses three corresponding ultimate ends: public satisfaction, positive health outcomes, and financial protection.
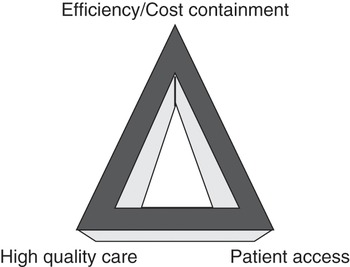
A related principle is the “iron triangle” depicted in Figure 1.1. The logic of this triangle is that there are inevitable societal trade-offs in pursuing any of the goals (vertices) in the triangle.1 If the triangle is an equilateral triangle, and thus each angle is 60 degrees, policy initiatives that expand one angle beyond 60 degrees force one or both of the other two angles to contract below 60 degrees. Thus, efforts to promote access to care (e.g., via insurance coverage) will lead to higher demand for care, rising utilization, and higher costs. Similarly, efforts to promote quality by virtue of enabling access to modern technologies (drugs, medical devices, and equipment) will also likely raise costs. Determining the right thrust and mix among the three angles constitutes the balancing act in resource allocation faced by most countries.
The iron triangle of healthcare: balancing act
Perhaps no country allocates equal attention to all three goals in the manner of an equilateral triangle. Indeed, healthcare policy in the United States has alternated its focus and attention between these three angles since the late 1920s. In the 1960s, policy makers focused on expanding access to healthcare services via broader insurance coverage by enacting the Medicare and Medicaid programs (to cover the elderly and poor, respectively). In subsequent decades, the policy focus shifted to cost containment to deal with the rising utilization and cost of services that naturally followed from expanding access to insurance for population segments with greater need for healthcare services. During the past decade, policy makers have devoted more attention to quality via such initiatives as pay-for-performance (P4P), value-based purchasing (VBP), accountable care organizations (ACOs), and “never events” (reimbursement withheld for controllable adverse events in hospital episodes).
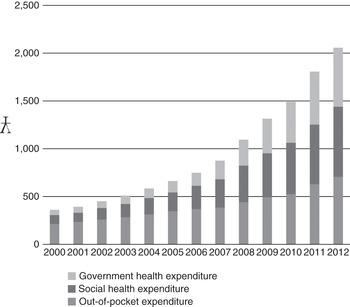
China faces challenges in pursuing each of these three goals. With regard to cost, national health expenditures in China have risen exponentially since the start of the new millennium (see Figure 1.2). Indeed, China seems poised to emulate the trajectory of spending in other western countries. Moreover, a large percentage of all healthcare is financed out of pocket by the population. Until recently, there has been little health insurance or other forms of risk pooling. The new health insurance schemes enacted in the new millennium now cover most of the population for basic hospital benefits and have only recently begun to implement (or call for) supplemental insurance protection against catastrophic costs. There is also little accountability of providers and a predominance of fee-for-service payment, all of which are associated with high costs. Finally, there is questionable efficiency of the roughly 50–60 percent of the healthcare system financed directly or indirectly (via social insurance) by government sources, with little measurement of inpatient utilization and appropriateness of care.
Per capita national health expenditures (NHE) in China
With regard to quality, there is little effective regulation of providers, treatments, and medical products (often from spurious sources), considerable variation in the training and education of providers, and enforcement of laws and regulations at the national or provincial levels. There is considerable overuse of pharmaceuticals and IV solutions. There is also mixed evidence regarding the health of the Chinese population. On the one hand, China’s rates of infant mortality, mortality of children under five years old, and life expectancy are all average compared to the region; on the other hand, China exhibits some of the highest declines in mortality rates and increases in life expectancy (covered below).
With regard to access, a substantial majority of the population still dwells outside of the cities where most (modern) healthcare facilities exist. Government spending on healthcare is disproportionately allocated to the urban areas rather than rural areas. Rural residents pay higher healthcare costs out of pocket as a percentage of household income. Access is also particularly problematic for the poor and migrant workers. Large variations also exist in the population’s access to healthcare across China’s provinces.
Countries like the United States and China face similar “iron triangle” trade-offs in sectors other than healthcare. For example, in the policy domain of energy, countries must balance their need for low-cost and efficient energy (cost angle) with low-emission and green energy (quality angle), and with rising demand and sustainable energy (access angle).
The balancing acts here seem formidable. Most economists believe it is impossible to achieve all three goals simultaneously and, thus, that trade-offs must be made.2 After all, marketing executives believe that in order to position their product against the offerings of competitors, they must excel on one dimension (product cost, quality, or service) and seek parity on the other two. Optimization on all three is rarely considered (and is more rarely observed).3 Nevertheless, there have been periodic efforts in the United States to pursue all three goals, usually in the context of national healthcare reform. The Health Security Plan (better known as the Clinton Health Plan) sought to do all three; more recently, the Patient Protection and Affordable Care Act (PPACA, better known as Obama Care) is likewise seeking to achieve all three. Underlying the new reform is “the triple aim”: improved experience of care, reduced per capita cost, and improved health of the population (accomplished partly by enabling access to preventive services).4 The jury is out regarding whether the triple aim is achievable, although there are organizations (e.g., Institute for Healthcare Improvement) actively involved in training providers on how to do so. Even its proponents recognize, however, that while the three goals are interdependent, sometimes they are negatively associated with one another (i.e., trade-offs are required).5
This discussion is pertinent to China’s healthcare system and subsequent chapters in this volume because the country has historically undertaken a series of initiatives that seek to solve the iron triangle in the delivery of healthcare services. Nearly every healthcare reform undertaken by the Chinese government has espoused the goal to make healthcare more affordable, higher in quality, and more accessible to its population. The 2009 reform’s goal is “to establish a basic, universal health system that can provide safe, effective, convenient, and low-cost health services to all of China’s 1.38 billion citizens.”6
Market Failure
Other principles observed in the US healthcare system also likely apply to China and elsewhere. These include the principle of market failure: i.e., non-competitive market conditions in the healthcare industry that inhibit the efficient operation of supply and demand. These features include lack of price information and pricing transparency; lack of data on product quality; the resulting inability to assess the comparative value (defined as quality divided by cost) of products and services; asymmetric information between providers and consumers; imperfect agency relationships between physicians and their patients; the heavy role of government as both a buyer and regulator; and moral hazard flowing from insurance coverage. Such features lead to distortions in market efficiency.
Principles Inherent in Healthcare Reform
Several principles emanating from healthcare reform efforts around the world may comprise an additional set of invariant principles. These include the reality of ever-rising healthcare costs (driven by population demographics and technological improvements, among other factors); rising public expectations from healthcare (driven by economic growth and rising national incomes, as well as increased global travel and immigration); the limited capacity of nations to afford the growing demand of their populace for increasingly expensive healthcare; and increased skepticism regarding traditional methods of organizing and managing healthcare finance and delivery (e.g., the breakdown of centrally planned systems, as well as the recognition of market failures).7
Healthcare System Defined
A second way to study another country’s healthcare system is through formal definitions. The phrase “health system” is widely used in discourse on global health (e.g., health systems strengthening) but enjoys no agreed-upon definition.8 “Health system” actually combines two nebulous terms. The first is “health.” According to the World Health Organization (WHO), “health” is “a state of complete physical, mental, and social well-being, and not merely the absence of disease and infirmity.”9 “Health” has also been defined as an important capability “that enables individuals to pursue things they might value.”10 There are as many indicators of health as there are definitions. These include life expectancy at birth, infant mortality rates, the percentage of children underweight, the percentage of women with body mass index (BMI) below 18.5, quality-adjusted life years (QALYs), and disability-adjusted life years (DALYs). Comparative historical data suggest that China has outpaced other developing countries on many of these indicators (see Table 1.1). Getting a comprehensive picture of a country across lots of indicators is impossible and probably futile. The United States, for example, is commonly lambasted for ranking relatively poorly among developed countries on infant mortality; on other indicators, however, such as cancer survival, the United States ranks quite highly.
 |
Notes:
YLL = years of life lost to premature mortality
YLD = years lost to disability
HALE = health-adjusted life expectancy
The concept of a “system” is also rather elusive. Piecing together definitions from several dictionaries, we might define a system as a whole comprised of several interdependent parts that have differentiated roles, are interconnected by three processes (input, throughput, output), and thus are integrated in a holistic fashion. Such a comprehensive definition begs the question: does any country have a “system” of healthcare? The payer, provider, and producer components found in any country’s healthcare industry are surely interdependent and interconnected (in the sense of serving one another as buyers and suppliers). But are they really integrated? And do they commonly focus on the provision of “health” as defined above?
The answer to both questions is likely “no.” There are few collaborative partnerships between these sectors in the United States.11 As noted earlier, there are huge disconnects between them in terms of their goals and incentives. Moreover, these sectors are commonly oriented to funding and delivering acute care, rather than promoting the health of the population. The latter would require greater emphasis and funding of prevention, healthcare promotion, and public health activities. Health, as defined in this section, is typically left to the public health system in most countries. What, then, does the United States have if not a system that delivers health? The reality more closely resembles a collection of public and private sector entities (e.g., firms, individuals, governmental bodies, professional associations) that pursue their individual interests, pursue one or more of the goals in the iron triangle, and may or may not interact with the patient.
Harvard University researchers define a healthcare system in a similar fashion as the collection of institutions and actors who provide healthcare (e.g., doctors, nurses, hospitals, pharmacies, and traditional healers); the organizations that supply specialized inputs to the providers (e.g., training schools, manufacturers of products); the financial intermediaries, planners, and regulators who control, fund, and influence the providers (e.g., insurers, government agencies, regulatory bodies); the organizations that offer preventive services; and the financial flows that finance the provision of healthcare.12
The World Health Organization defines a healthcare system more simply but more broadly as “all of the activities whose primary purpose is to promote, restore or maintain health.”13 In addition to the list of actors and institutions mentioned throughout this section, this definition of a healthcare system also includes health-enhancing interventions such as road improvements and environmental safety efforts. It also includes the efforts of informal healthcare givers in the home, behavioral change interventions conducted by employers or governments, and efforts to promote female education. The WHO explicitly acknowledges that their system definition does not imply any degree of integration among the activities and services performed.
United States versus China: Convergences and Divergences
A third method to approach another country’s healthcare system is by way of comparisons and contrasts with one’s own. There are a few commonalities worth noting at the national level. The United States is one of the world’s oldest democracies, while China is one of the world’s oldest countries. Both are distinguished by pluralistic systems of healthcare financing; both are currently seeking to simultaneously reform their financing and delivery systems and to reach nearly universal insurance coverage of their populations; and both need a concerted effort by their federal/central and state/provincial governments, along with considerable help from the private healthcare sector, in order to accomplish this reform. Both systems focus on the treatment of disease rather than the promotion of health. Finally, both offer a mix of allopathic and more traditional medicine (complementary and alternative medicine in the United States, traditional Chinese medicine in China) that formed the roots of their earlier healthcare delivery.
As noted in the Preface, healthcare systems in rapidly developing countries like China bear a number of remarkable similarities with the US context (see Table 1.2). Both countries (indeed, most countries around the world) worry about managing the iron triangle of healthcare: i.e., the difficulty in simultaneously pursuing the three goals of controlling healthcare costs while also expanding health insurance access to the population and improving the quality of care – for example, by ensuring access to new technologies and medicines. The affordability of healthcare is a common concern, especially with high and rising costs of hospitalization being a cause of impoverishment and personal bankruptcy in both countries.
|
|
There is also a common concern with geographic variations in healthcare spending, whereby more money is spent in some regions than in others (e.g., rich vs. poor states/provinces, urban vs. rural areas); there is the parallel concern with geographic disparities in health status (which may or may not result from spending variations). Another common concern is that the population’s lifestyle and personal behaviors contribute to chronic illness and increase healthcare spending. There is a common concern with supplier-induced demand – i.e., that providers over-prescribe and over-treat as one means to increase their incomes – and the conflicts of interest that providers have with one another (e.g., incentives and kickbacks for referrals) and with product manufacturers whose products they may be incented to (over) use.
There are numerous other similarities between the United States and China. Both operate a fee-for-service system combined with other payment approaches to reimburse providers. Both also include a mix of financing mechanisms that include payments from the federal/central government, state/provincial governments, employers, and individuals. As a result, both feature fragmentation between federal and provincial government efforts, and contend with the reality that provincial governments have many competing priorities for their limited budgets (e.g., education, social services, healthcare). Both desperately need to develop and invest in a broader capacity for primary care delivery (in terms of numbers and accessibility of providers), and both must confront a low degree of consumerism in getting their populations to take better care of themselves.
Despite the evident similarities, there are important differences in the details between the two countries (see Table 1.3).
The US spends roughly 18% of GDP on healthcare, with wide spending variations across geographic regions. Concerns over geographic variations in the US stem from parallel concerns with over-utilization and wasted resources. China spends only 5–6% of its GDP on healthcare. In China, geographic variations are framed as issues of societal inequities, especially between rural and urban populations, in resource allocation and access to healthcare.
In the US, the primary care movement argues for patient-centered medical homes (PCMH) that augment the solo physician’s office with information technology (e.g., an electronic medical record) and physician extenders (e.g., nurse practitioners). In China, by contrast, the concern is with both rural and urban populations bypassing lower acuity providers to seek outpatient care services at tertiary hospitals. Another issue is the low level and variable (and sometimes nonexistent) training of primary care practitioners outside of major cities.
In the US, consumerism is focused heavily on getting people to respond to financial incentives (e.g., through cost-sharing), to utilize information on provider costs and quality in their provider search and purchasing decisions, and to change their lifestyles. In China, by contrast, consumerism is much more basic: the government wants its population to be more active consumers of healthcare by increasing their domestic consumption and save less. The country also wants to address the lack of information among the population regarding the availability of healthcare services (as well as the effects of unhealthy behaviors like smoking).
The hospital and insurance sectors in the US have suffered stagnating growth for the past decade; in China, by contrast, these two sectors have been booming, due to heavy government investments as part of current healthcare reforms. China is witnessing an explosion in hospital capacity and insurance coverage, and is encouraging entry by the private sector into both.
Finally, hospitals and physicians in the US have been seeking to integrate over the past 20–25 years; in China, by contrast, most physicians are fully employed by public hospitals due to their common government ownership and sponsorship. In China, all hospitals also operate pharmacies for outpatient drug sales, drawing huge criticism as the central cause of the over-prescribing problems in China.
| System Dimension | China | United States |
|---|---|---|
| • Spend per capita on healthcare | Low | High |
| • Government spend as percent of NHE | Low | High |
| • Private health insurance | Low | High |
| • Depth and breadth of insurance coverage | Low | High |
| • Role of public sector hospitals | High | Low |
| • Preference for private providers | Low | High |
| • Centralized purchasers | Low | High |
| • Role of central government in healthcare | Low | High |
| • Governance mechanisms to monitor providers | Low | High |
| • Measures of utilization, appropriateness | Low | High |
| • System of outpatient care/primary care | Low | High |
| • Amount of money spent on pharmaceuticals | High | Low |
| • Integration of hospitals and pharmacies | High | Low |
| • Integration of physicians and hospitals | High | Low |
| • Role of hospitals in public health | High | Low |
| • Locus of conflict | Doctor–patient | Doctor–hospital |
| • Physician payment | Salary | FFS |
| • Standardized doctor training | Low | High |
| • Role of medical profession | Low | High |
| • Hospital length of stays | Long | Short |
| • Smoking viewed as major problem | No | Yes |
Beyond these differences in institutional details, there are several divergences dealing with financing, delivery, and regulation. In contrast to the United States: (a) China has spent relatively little per capita on healthcare; (b) its government accounts for a smaller share of national spending on healthcare, while out-of-pocket costs represent a greater proportion of total healthcare spending; (c) the government plays a strong role in healthcare provision (e.g., hospitals, physicians); (d) there are no powerful, centralized purchasers of healthcare services (outside of drugs) dealing with providers, such as large insurance companies; (e) there has been little private health insurance coverage; (f) there are only weakly developed governance mechanisms overseeing providers’ behavior, with resulting concerns dealing with overutilization; (g) there are few mechanisms and incentives in the system to promote outpatient care in non-hospital clinics; and (h) the population favors treatment by public sector providers over the private sector.
China, India, and Other Emerging Countries
A fourth approach to understanding the healthcare system in China is by comparison with other emerging countries. In many of these countries, government lacks the infrastructure to levy taxes on workers in the large informal sector of the economy. This limits the tax base (which is relatively low compared to GDP) and thus the public funds available for healthcare investments. Cultural issues, divisions within government, the lack of political will, competing political jurisdictions, and competing investment needs all prevent efforts to redistribute what is collected. To the degree that public funds are invested in healthcare, they tend to go toward large public hospitals in urban areas rather than smaller primary care–oriented clinics in rural areas. The latter are poorly capitalized, poorly staffed and equipped, and offer poor access with long waiting times. Patients often bypass local facilities to seek care in large cities. Most patients pay for healthcare out of pocket, and often pay providers “informal payments” for better treatment and greater access.
We can draw these analyses more sharply by comparing China and its neighbor, India. Both countries have historically had large rural populations, while China has experienced rapid urbanization. Both countries also have rapidly growing economies, dramatic declines in poverty, and rising demand for healthcare services.14 Until recently, both countries have lacked widespread insurance coverage: the Chinese central government has implemented broad coverage in the last two decades, while in India state governments and voluntary schemes have helped to increase insurance coverage to roughly one-quarter of the population. Both countries are concerned about access to affordable primary and specialty care, are increasingly concerned with the rising costs of healthcare, and are witnessing rising healthcare costs as a significant cause of impoverishment. Nevertheless, both countries spend a small percentage of their gross domestic product (GDP) on healthcare.
In addition, both countries are located on the upward sloping portion of the Millennium Preston curve, which depicts the association between GDP per capita and life expectancy (see Figure 1.3). Both China and India can be expected to move up this curve as their GDP grows; the United States is an outlier. China’s provinces can be arrayed along a similar curve: provinces with higher per capita incomes also exhibit higher life expectancy at birth.
The Millennium Preston curve
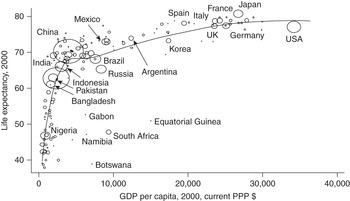
The logic behind the association depicted in the curve is straightforward. Increased societal wealth can be channeled to greater investments in education, literacy, and public health, as well as purchases of health insurance and healthcare services that improve health status and longevity. The curve suggests that further improvements in health status (i.e., reduced mortality) may be achieved in these developing countries by greater societal spending on healthcare as a percentage of GDP. Not all economists agree, however, that the relationship in the curve is causal (i.e., that increasing income leads to longer life expectancy).15 Indeed, improvements in health can come without any increase in societal wealth, and vice versa. In some developing countries like India and China, the dramatic improvements in health occurred prior to periods of great economic growth or during only small intervals of those growth periods. Moreover, it may be the case that to the degree there is any causality, it may be more that increasing health leads to increased societal wealth (an issue addressed empirically later on).
Not all spending is productive toward the end of greater longevity. Recent research suggests that greater spending on “home run” technologies and treatments – i.e., those that are cost-effective and useful for nearly all patients in the population, such as antibiotics for bacterial infections, aspirin and beta-blockers for heart attack patients, antiretroviral drugs for patients with HIV/AIDS, improved health behaviors – contributes the most to improved health outcomes and survival. Greater spending on potentially cost-effective technologies with heterogeneous benefits across patients (e.g., angioplasties with stents, imaging tests, antidepressants, Cesarean sections) can also improve productivity and health but with rapidly diminishing returns as more of the population uses these treatments. Finally, greater spending on technologies with modest or uncertain effectiveness (e.g., arthroscopic surgery for knee osteoarthritis, referrals to specialist physicians, vertebroplasty, intensity-modulated radiation therapy for prostate cancer) is likely to result in only marginal health improvements while substantially increasing costs.1
A related explanation for the flattening portion of the curve in Figure 1.3 is that much of the increased spending is devoted to treating the chronically ill population.2 Such spending does not cure chronic illness but only helps to manage their conditions. Research from the United States documents that 46 percent of the population with one or more chronic conditions account for 84 percent of all healthcare spending.3
A third perspective on the flattening curve is historical. Research suggests that declines in mortality (and thus increases in life expectancy) have traversed three phases: improved nutrition and economic growth (mid-1700s to mid-1800s), investments in public health (mid-1800s to early 1900s), and then investments in medical interventions such as antibiotics and vaccines and medical technology (1930s to the present).4 In the poorer countries of the world, recent improvements in life expectancy have occurred as a result of the rapid introduction of public health measures and basic medical interventions, as well as broader social factors such as rising incomes, literacy, and nutrition. Once these rapid gains have been achieved, further progress proves more difficult.
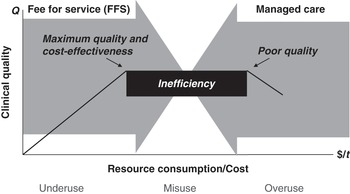
A final explanation for the flattening curve is that increased spending on healthcare is not always associated with increased quality or other health outcomes. Figure 1.4 depicts the likely association between cost and quality of healthcare. Some portion of the population does not receive the healthcare that is appropriate (underuse); here, improved cost results in improved quality. Another portion receives healthcare that is unnecessary but not necessarily harmful (misuse); here, improved cost has no effect on quality. Another portion receives healthcare that is both unnecessary and harmful (overuse); here, higher cost leads to lower quality.
Issues behind cost–quality relationship
1. Amitabh Chandra and Jonathan Skinner. 2011. “Technology Growth and Expenditure Growth in Health Care,” NBER Working Paper 16953 (Cambridge, MA: National Bureau of Economic Research).
2. Gordon Liu, Yao Yao, Nianyu Du et al. 2015. Health and Economic Prosperity (Beijing: Peking University National School of Development).
3. Hamilton Moses, David Matheson, Ray Dorsey et al. 2013. “The Anatomy of Health Care in the United States,” Journal of American Medical Association 310(18): 1947–1964.
4. Cutler et al. 2006. “The Determinants of Mortality.”
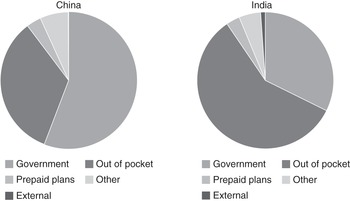
Following the chaos of the World War II era, both China and India defined healthcare as the responsibility of their provinces/states, which have many other duties and inadequate funds to perform them. Both countries have divided public responsibility for healthcare between the federal/central government (regulation and a relatively low level of financing) and state/provincial governments (financing and provision of care). Both governments assume a small share of total healthcare spending and require their populations to bear a large percentage of total healthcare costs by paying out of pocket for services (see Figure 1.5). The bulk of public funding goes for wages and salaries of employees in public facilities, in lieu of the financing of technologies or advanced services. There is thus little money available to actually target health conditions. Both countries also feature a three-tiered structure of healthcare delivery to a largely rural population (e.g., barefoot doctors in the villages, primary health centers at the local level, and community health centers and hospitals at the district and small city level). In both countries providers are paid primarily on the basis of fee for service, have incentives for over-utilization and problems of induced demand, receive informal payments from patients, and face issues of corruption in the management of public hospitals. And in both countries there is the “double disease burden” of communicable and non-communicable (i.e., chronic) diseases to tackle among the increasingly affluent urban population.
Healthcare financing structures in China and India in 2013
There are several important institutional differences between the two countries, however. China has placed greater emphasis on the public sector provision of healthcare services, as evidenced by the much higher percentage of beds found in public hospitals; by contrast, India has a more developed private sector of delivery and more private investment in public hospitals. China’s government has also pursued more public financing of healthcare and wider population coverage via public insurance schemes, has set prices that private sector providers can charge, and has a more developed regulatory apparatus (although with weak enforcement). In contrast to India, China has also increased its healthcare spending as a percentage of GDP at a faster rate since the middle of the 1990s. China’s system also features a more developed system of hospital care and a tiny private sector in the provision of services. China, unlike India, has also made a sustained commitment to disease eradication among the young and pursued policies backed by resources and social mobilization.16 Finally, China embarked on economic reforms a full decade earlier than India (1980s vs. 1990s), giving China a head start on economic growth and attraction of foreign direct investment. As a result of these investments, China has two-thirds more nurses and midwives per 1,000 population, and 160 percent more physicians per 1,000 population compared to India. By contrast, India has benefitted from greater involvement of international donors (e.g., World Bank, International Monetary Fund, Gates Foundation, Clinton Foundation) in the direct financing of services and in supporting healthcare reforms (e.g., encouragement of partnerships with the private sector).
All of these differences manifest themselves in divergences in the health statistics of the two countries, according to the World Bank. India’s infant mortality rate (41 per 1,000 live births; 2013 data) is more than three times the rate in China (11 per 1,000 live births). The mortality rate for children under five years of age (53 per 1,000 live births; 2013 data) in India is quadruple than in China (13 per 1,000 live births). Likewise, the percentage of births by skilled attendants in India (estimates ranging from 43 percent to 58 percent) is roughly half of the percentage achieved in China (97–100 percent).
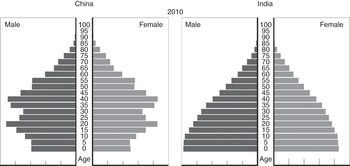
There are also important demographic differences between the two nations. Unlike China, India did not impose family planning restrictions on its population. China thus has an older population than India, whose young citizens represent a quickly increasing proportion of the population (see Figure 1.6): 28 percent of India’s population is 0–14 years old, while only 8.1 percent are 60+ years old (2011 data).17 For its part, China has a lower “dependency ratio” – defined as the percentage of non-working population to working population (42 percent vs. 60 percent in India).18 China has a more literate population (due to its focus on primary education vs. India’s focus on advanced education) that allows healthcare promotion to be more effective. These factors among others contribute to China’s lower mortality rates and higher life expectancy.
Age distributions in China and India
Frameworks for Analyzing Healthcare Systems
A fifth way to approach a new healthcare system is through analytical frameworks. There are multiple frameworks one can use to analyze a country’s healthcare system.19 An early framework is the “actors” framework which classifies four major actors in a health system: providers, payers, regulators, and the population served. Another is the “funds flow and payment” framework that identifies seven major subsystems of financing (out of pocket, private reimbursement, public reimbursement, etc.).20
National Health Accounts
One widely used framework is the analysis of a country’s “national health accounts” (NHA). These accounts rigorously classify the types and purposes of all expenditures made by/to all the actors in a healthcare system. Stated more simply, the accounts depict the sources and destinations of all healthcare spending in that country. Sources include government (both federal and provincial, and by public program) and non-government (employers, community insurance schemes, individual payments out of pocket); destinations include hospitals, physicians, dentists, retail pharmaceuticals and other products, public health, construction, etc. An NHA scheme allows for ongoing analysis of time trends in these money flows, which can serve as the basis for performance appraisal and stewardship. The Centers for Medicare and Medicaid Services (CMS) maintains these data for the United States over time. The Organisation for Economic Co-operation and Development (OECD) has developed an International Classification for Health Accounts to facilitate international comparisons.21 The Chinese government has historically tracked the sources of healthcare spending coming from the government, social insurance, and out-of-pocket payments (see Figure 1.2).
Health Systems Strengthening
The NHA scheme itemizes investments at the country level and typically focuses on the investments undertaken by that country. By contrast, developing countries often are also the recipient of investments and income transfers from outside organizations and donors to tackle specific problems. The “health systems strengthening” framework tracks the activities and investments undertaken by different donors/funders to strengthen specific system components.22 These investments are typically designed to make changes in the healthcare system and accomplish certain system goals. The components targeted include “health services” (staffing infrastructure, operational support systems), the “financing system” (e.g., health financing policies and legislation, resource generation, fund pooling, provider reimbursement system), “monitoring/evaluation and information system” (data analysis and reporting, disease surveillance), and “stewardship and governance” (e.g., planning, priority setting, management).
Functions, Objectives, and Priorities
Another method to analyze healthcare systems is to examine what they do: i.e., what functions they perform and what objectives they pursue. Functions include the creation of resources and inputs (investments, training), stewardship (oversight) of these resources, financing (pooling and purchasing), and the provision (delivery) of services. Objectives served include the production of health, fairness, and responsiveness to societal expectations.23 Thus, for example, one framework analyzes the interplay between four functions (regulation, financing, resource allocation, and service provision) and four key actors (government, providers, payers, and patients).24
A complementary approach is to categorize the country’s healthcare priorities (e.g., the various initiatives and interventions to reduce the disease burden in the population), the types of provider organizations and incentives given them to deliver the interventions, the other resource inputs required to achieve these initiatives (budgets, manpower, technology), and the specific financing mechanisms (e.g., revenue collection, pooling, purchasing).25
Building Blocks
The World Health Organization has described the framework of a healthcare system in terms of its basic building blocks. These include service delivery of effective, safe, quality personal and non-personal interventions; a health workforce that is adequate in numbers, competently trained, and fairly distributed; a health information system that produces, analyzes, and disseminates reliable and timely information; medical products and technologies that are safe, efficacious, cost-effective, and accessible; a financing system that raises adequate funds to ensure the population can use needed services and is protected from financial catastrophe; and governance and oversight of the above.26 All six building blocks are viewed as essential for improving health outcomes.
Control Knobs
Researchers at the World Bank and the WHO have developed another framework (“control knobs”) that analyzes the policy levers that can be used to impact the intermediate ends of cost, access, and quality (the vertices of the iron triangle) and hopefully the ultimate ends of improved health status, protection from the financial risks of illness, and consumer satisfaction.27 These policy levers – the financing, payment, organizational, regulatory, and behavioral initiatives – are themselves conditioned by the country’s economic, social, and cultural context (see Figure 1.7). Such a framework is helpful for understanding the broader societal and regulatory constraints within which a healthcare system operates.
“Control knobs” framework
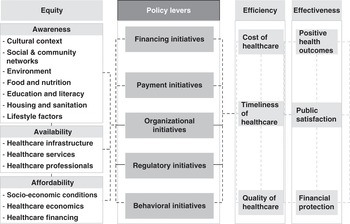
As an illustration, we can apply a portion of Figure 1.7 to explicate some of the issues facing China’s healthcare system. Looking at the left-hand column, the historical context that both directs and constrains policy initiatives includes the emphasis on public health; a dichotomous system that favors the urban population with access to more providers with higher technology over the (poorer) rural population; restricted access by China’s migrant population; and the “proletarianization” of the medical profession under Mao. The cultural context includes health as the responsibility of the individual, stemming from Confucianism. This has resulted in higher out-of-pocket payments and a lower depth of insurance coverage. The system is further shaped by environmental factors, such as the prevalence of infectious diseases which led governmental health policy following the revolution to orient around “vertical health programs” to deal with such diseases on an individual basis rather than develop a comprehensive public health approach, but also to tackle problems of unclean water and sanitation.
Looking at the next column in Figure 1.7, we see that China is also hampered in terms of the “policy levers” at its disposal to change the system. With regard to financing, China spends roughly 5–6 percent of its GDP on healthcare, or about $400 per capita (2014 data, current US dollars). A large percentage of healthcare expenditures (ranging from 35 percent to 60 percent over the last 15 years) are paid out of pocket by the population, whereas the government (all levels) accounts for only about 25–35 percent. While there is an emergent private insurance sector, there is little means to finance broader access to healthcare.
With regard to payment, as noted above, China has a fee-for-service system that is poorly regulated and monitored less closely than in the United States. Providers typically have strong incentive to over-prescribe medicine, especially expensive drugs and devices, in the absence of alternative payment models (e.g., capitation, diagnosis-related groups (DRGs)). Among physicians, there is price regulation and transparency but little quantity transparency, few medical audits, and meager standard setting. With regard to organization, most providers work in the public sector and are employed by hospitals. Despite a growing number of private hospitals and government efforts to promote more hospital competition, the majority of hospital beds are publicly provided. The public also distrusts the private sector due to perceived pecuniary motives.
With regard to regulation, there has been little effective regulatory oversight and even less enforcement. Regulatory structures are relatively underdeveloped and diffused across central and provincial governments. For example, there are few efforts at mandatory registration, accreditation, and credentialing of providers, little in the way of regular service evaluations, and substandard quality control. There is also wide variation among hospitals regarding availability of equipment, record keeping, and staffing. Finally, with regard to behaviors, there is little consumerism, little professional self-control and monitoring, and few effective educational campaigns targeted at the population.
Of course, the model depicted in Figure 1.7 suggests a one-way causation that is likely inaccurate. Not only are the intermediate and ultimate ends of a healthcare system impacted by macroeconomic conditions, they can also determine them. There is growing evidence that societal health shapes societal wealth, as well as vice versa. For example, poor health is positively associated with absence from work, job loss, higher out-of-pocket spending, debt levels, and loan defaults – all of which contribute to lower income. In addition, poor health among pregnant mothers and children is negatively associated with education and long-term cognitive development. There is also evidence that societal health shapes nation state security that, in turn, fosters economic growth.28 Economists argue that a country’s health status, incidence of illness, and likelihood of catastrophic illness heavily influence the country’s labor force participation rates, labor productivity, savings and poverty rates, and healthcare demand and consumption. These latter forces influence, in turn, inflation rates, wage rates, exchange rates, and the country’s fiscal health.29 A later section explicates these relationships.
Value Chain
Another complementary framework is the healthcare value chain outlined in the Preface. According to this framework, a healthcare system can be studied in terms of the buyers and suppliers of products and services that make up this chain, who engage in the important market exchanges that comprise this system, and whose activities add value to system outputs as they move along the chain. The value chain of the US healthcare system is presented in Figure 1.8.
The healthcare value chain
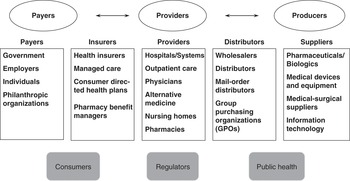
This framework highlights the upstream (supplier) and downstream (buyer) trading partners of any firm operating in a healthcare industry, the parties that may mediate these transactions, and the possible competitors and substitutes for the firm’s product/service.
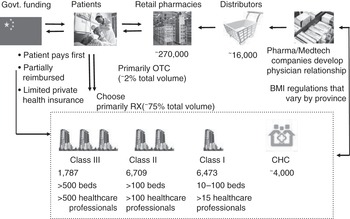
China has not yet developed all of the value-chain players depicted in Figure 1.8, but the nation’s trajectory suggests continued expansion and eventual development of these stages. One depiction of China’s healthcare system as a value chain is presented in Figure 1.9 covered in subsequent chapters.
Overview of China’s healthcare system
OECD Data on Outcomes
Another framework analyzes the dynamics of healthcare system development by examining trends in the iron triangle dimensions of cost, access, and quality/outcomes across nations.30 The analysis here examines health expenditures per capita, percent of GDP spent on healthcare, insurance coverage, hospital utilization and expenditures per capita, physician visits per capita, and such outcomes as life expectancy at birth, infant mortality, and disability days. Inferences in healthcare system development are derived from cross-national comparisons among these trends. One limitation of this framework for our purposes is that nearly all of the data (e.g., statistics assembled by the OECD) are drawn from western and fully developed nations, with little data from the developing countries in Asia.
The Healthcare Quadrilemma
A final framework shows the interplay of cost, access, and quality. The “healthcare quadrilemma” model suggests that efforts to address problems in access to healthcare by extending insurance coverage to previously uncovered segments of the population have multiple downstream effects (see Figure 1.10).31 These include financial incentives to manufacturers and producers to invest more in technological research and development (R&D) since the costs of innovation are more likely to be covered. The resultant innovation appeals to both providers and patients and thus leads to widespread adoption; the innovation carries a higher price tag as well, leading to simultaneously higher costs and higher quality. As costs rise and care improves, there is subsequent demand for greater insurance coverage. This cycle offers one plausible explanation for the iron triangle dilemma noted above.
The healthcare quadrilemma
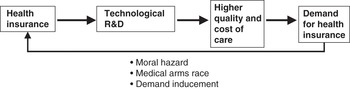
This model is quite germane to China today. Since the late 1990s, China has expanded insurance coverage to several segments of its population in a series of reform measures. An estimated over 95 percent of the population now has some level of (mostly inpatient) coverage. This rising coverage allows the population to access expensive hospital facilities and the technologies they offer; providers rely on the utilization of these services to cover their operating costs and generate their operating margins. Not surprisingly, medical suppliers and device companies are targeting these hospitals as customers for their expensive technologies and products. Expanded insurance coverage also serves as a spur to the formation of domestic suppliers of these products who increasingly will compete with multinational companies to serve the higher-end market. The result will be more innovation and product proliferation. These developments will inexorably lead to higher utilization of hospitals and their services, which in turn will lead to higher quality of healthcare offered in these settings and the higher cost of services. All of this will lead to higher costs of providing healthcare and the need for greater insurance coverage to finance it.
Application of Frameworks to Major Transitions Under Way in China
China’s healthcare system can thus be studied from the vantage point of each of the frameworks above. These frameworks are mostly static, however. We can also develop a dynamic model that draws on many of these frameworks to illustrate the dramatic changes under way in China’s socioeconomic and epidemiologic characteristics using the systems perspective presented in Figure 1.11. These changes have been recently chronicled by a research team at Peking University, led by one of the co-editors of this volume.32
Dynamic model of transitions
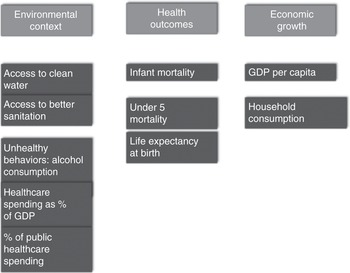
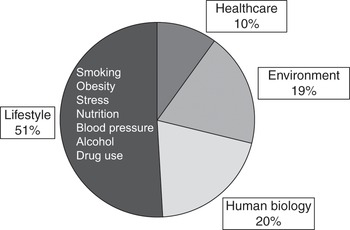
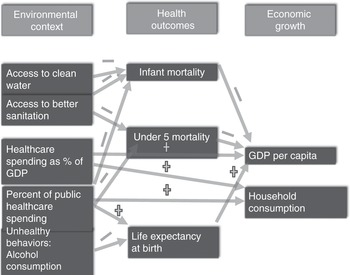
The logic of the left side of the figure is that changes in several pieces of a country’s environmental context – such as public health, healthy lifestyles, and government spending on healthcare – can impact the health outcomes of the population. The figure draws on research in the United States that suggests there are four major determinants of the health of a population: lifestyle, environmental conditions, genetics, and access to healthcare resources (see Figure 1.12). All but genetics are potentially mutable in the short term and thus amenable to policy interventions.
Health and healthcare
The logic of the right side of Figure 1.11 is that health outcomes promote economic growth.33 A healthier population translates into several societal benefits that promote growth, including higher educational attainment, improved worker productivity, increased size of the labor pool, higher income, higher consumption and savings patterns, and higher foreign direct investment.34 These trends and the hypothesized relationships between them are explored below.
Environmental Transitions
Environmental Hazards
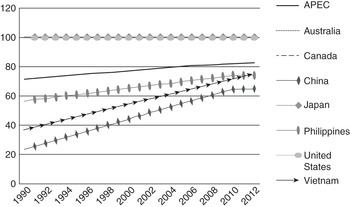
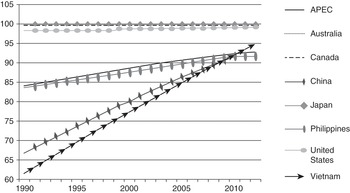
China is currently plagued by several environmental hazards, as outlined later in Chapter 3. As a result, the country ranks fairly low among its neighbors – the members of the Asia-Pacific Economic Cooperation (APEC) – on several of these measures. For example, in 2012, China ranked 15th out of 17 countries on the percentage of the population with access to improved sanitation; China also ranked 14th out of 18 countries in terms of the percent of its population with access to improved water. China has made enormous strides in the past two decades to clean up these particular elements in its environment. Between 2002 and 2012, China ranked second among APEC members in the percentage improvement in the population’s access to improved sanitation and access to improved water. Figures 1.13 and 1.14 show the improvements between 1990 and 2012 on both dimensions in China have been quite dramatic. Such improvements are important because they help to reduce the population’s exposure to pathogens and waterborne diseases (e.g., diarrhea).
Population with access to improved sanitation facilities, 1990–2012
Population with access to improved water sources, 1990–2012
Lifestyle Behaviors
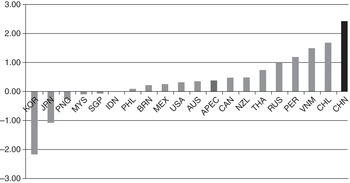
According to a report issued by the World Health Organization on global health risks, the three top drivers of disease burden are three behaviors. They are undernourishment (underweight children), unsafe sex, and alcoholism. Alcohol consumption has become an enormous public health problem in China over the past decade. Between 2000 and 2010, China exhibited the highest increase in per capita alcohol consumption among APEC members (see Figure 1.15). Much of this increase is attributed to the country’s rapid economic growth and rise in average per capita incomes.
Change in alcohol consumption per capita, 2000–2010
Healthcare Spending
Healthcare spending per capita in China has historically been among the lowest among APEC members and globally. In 2012, China spent only $322 per capita, ranking the country 14th out of 19 APEC members (with an average spend of $2,012). Between 2002 and 2012, healthcare spending per capita in China increased by only $268, compared to the APEC average of $1,146. Similarly, China’s level of healthcare spending as a percentage of GDP ranked the country only 11th out of 19 APEC members (5.4 percent vs. an average of 6.8 percent). Between 2002 and 2012, China’s spending as a percent of GDP rose by only 0.6 percent (compared to the APEC average of 1.0 percent).
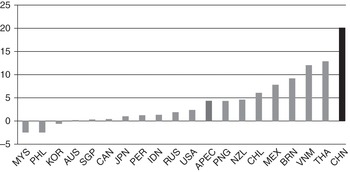
The story is slightly different, however, for the government’s share of this healthcare spending. In 2012, China ranked 10th out of 19 APEC members with 56 percent of national health expenditures contributed by government (compared to the APEC average of 60.1 percent). Between 2002 and 2012, China exhibited the highest increase in the government’s share of spending, rising 20 percent versus the APEC average of 4 percent (see Figure 1.16).
Percentage change in public health spending, 2002–2012
Health Outcome Transitions
Mortality Rates
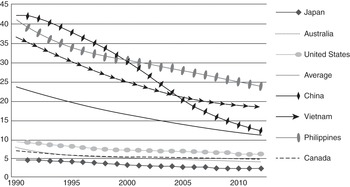
China has historically exhibited high rates of infant mortality per 1,000 live births and mortality for children under age 5. In 2012, the country ranked 13th out of 19 APEC members on both measures. China’s infant mortality rate was 12.1 and under-5 mortality rate was 14.0 (versus the APEC average of 11.9 and 14.6, respectively). However, China has made astonishing progress in reducing its mortality rates: between 2002 and 2012, the country ranked first among APEC members in the percentage improvement achieved on both measures. This progress is even more apparent over a longer time period from 1990 to 2012 (see Figure 1.17 for infant mortality).
Infant mortality rate, 1990–2012
What explains these improvements? Falling infant mortality has resulted from government efforts to reduce famine and poverty, as well as to improve the living conditions of its population and increase public access to healthcare facilities. Falling rates of under-5 mortality have been impacted by reduced malnutrition, improved access to primary care, and improved access to medical treatment and technologies by children.
Life Expectancy
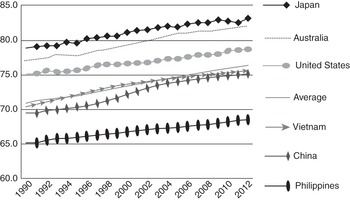
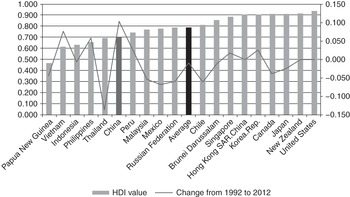
In 2012, life expectancy in China was 75.2 years, compared to the APEC average of 76.4. This put China 12th out of 19 APEC members. Between 2002 and 2012, the country saw only modest gains in life expectancy; China ranked 11th out of 19 APEC members in terms of this improvement. Over a longer time period (1990–2012), China witnessed the greatest increase in life expectancy around the turn of the century, only to see improvement level off thereafter (see Figure 1.18). The observed improvement in life expectancy has been attributed to government efforts to reduce poverty, increase access to health insurance coverage, and improve general socioeconomic conditions. Such improvement is reflected in the enormous gains China has made in terms of its “Human Development Index” (HDI), which encompasses education and income along with population longevity (see Figure 1.19).35
Life expectancy at birth, 1990–2012
Human Development Index, 2012, and change from 1992 to 2012
Economic Transitions
Despite the country’s economic growth following liberalization in the late 1970s, China still has a low level of GDP per capita. The country ranked 14th out of 19 APEC members in 2012, and 12th out of 19 members in terms of the increase in GDP per capita between 2002 and 2012. Similar figures describe the change over the longer time period from 1990 to 2012. However, China stands out from the others in terms of its GDP per capita growth rate (i.e., increase over the prior year). In 2012, China had the highest rate among APEC members (more than 7 percent); between 2002 and 2012, China also exhibited the highest average growth rate (more than 10 percent). Similar data are observed over the longer 1990–2012 period.
In addition to the increase in GDP per capita growth, China has also attempted to increase household consumption as an internal driver of economic growth and rely less on investment and trade. To date, the country has been less successful here. In 2012, China ranked 17th out of 18 APEC members in terms of household consumption as a percentage of GDP (34.7 percent vs. the average of 54.8 percent). Over the time interval from 2002 to 2012, the country again ranked 17th in terms of the increase/decrease in household consumption as a percent of GDP. Indeed, since 1990, the contribution of household spending to GDP has fallen in China.
Systemic Effects among Transitions
Researchers at Peking University recently examined panel data across APEC members and over time to assess the strength of the causal linkages between the environmental, health outcomes and economic trends discussed above and depicted in Figure 1.11. Their empirical findings are summarized in Figure 1.20. The results show that environmental factors such as access to clean water and sanitation reduce mortality rates, which in turn leads to increases in GDP per capita. Conversely, unhealthy behaviors such as alcohol use reduce life expectancy that in turn reduces GDP per capita. Increased national spending on healthcare (as a percentage of GDP) leads to higher GDP per capita and higher household consumption. Finally, an increase in government’s share of this spending reduces mortality rates, improves life expectancy, and increases household consumption.
Empirical relationships between transitions
Supplemental analyses (not depicted in the figure) further show that greater investments in infrastructure such as construction of hospital beds per 1,000 population lead to falling maternal mortality rates. The latter, in turn, are associated with higher GDP per capita growth rates at the provincial level. This further suggests that public sector interventions to improve capacity can foster economic growth.
The Peking University study also shows there is a positive relationship between GDP per capita and healthcare spending per capita, replicating evidence found in other countries that healthcare is a luxury good: national spending on healthcare increases as a country increases in wealth. The relationship is reciprocal: higher spending on healthcare promotes economic growth. This latter relationship is quadratic, however: after reaching a certain point, rising spending on healthcare can negatively impact the economy. The study also finds a positive relationship between increased household consumption and both economic and employment growth. The study authors surmise that (a) higher consumption leads to higher demand for products, which stimulates the economy, and (b) the spread of health insurance coverage spurs consumption and reduced savings.
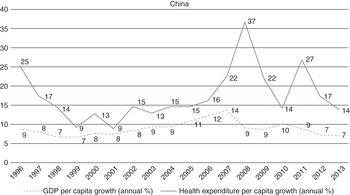
Finally, the study shows that growth in China’s per capita healthcare spending has consistently outstripped growth in the country’s per capita GDP since 1996 (see Figure 1.21). The gap between the two lines means that healthcare spending accounts for an increasing share of the country’s economic growth. Moreover, the growth in healthcare spending has continued to accelerate even as China’s economic growth cools off. This means that healthcare will account for an even greater share of GDP going forward. Lessons from the United States show that such growth raises the visibility of healthcare spending and increases calls for healthcare cost containment measures to deal with it.
Annual per capita growth of GDP and total health expenditures (THE)
Implications for China’s Healthcare System
Several of these transitions will increase demand for healthcare services and insurance coverage to pay for them. In particular, unhealthy behaviors will foster more disability and chronic illness; increased government spending will foster more investment in expensive healthcare infrastructure (facilities and manpower) that will increase access and utilization. Government investment has now extended to healthcare technology sectors (e.g., biotechnology, medical devices) that will spur more innovation and innovative products that will, in turn, increase costs and utilization.
These transitions are reinforced by a series of parallel transitions enabling this demand to be realized, such as the growth of the Chinese economy, the enormous decline in China’s poverty rate, the rise of private sector employment, rising urbanization, and rising income levels. Over the past three decades, China’s economy grew at an average annual rate of 9–10 percent, largely due to the high rate of investment (35–45 percent) as a percentage of GDP. Another historical factor promoting growth has been the shift of the workforce from primary (e.g., agriculture) to secondary (e.g., manufacturing, construction) and tertiary (e.g., service) sectors: the share of these three sectors changed dramatically between 1975 (77 percent vs. 14 percent vs. 9 percent) and 2005 (45 percent vs. 24 percent vs. 31 percent). Additional historical factors include the shift from agricultural communes to private control over farmland, the rise in agricultural prices and productivity, the formation of township and village enterprises (TVEs), the huge migration of rural populations to the larger cities, and the subsequent increase in the urbanization rate from 18 percent to 45 percent between 1978 and 2007. All of these factors have contributed to a decline in the number of people living in poverty ($1.25/day) by 678 million between 1981 and 2010. Officially, only 4 percent of China’s population now lives in poverty. The growth of industry and the country’s cities has led to rising non-agricultural and formal corporate employment – often in jobs that offer higher wages and health insurance – and growing income disparity between urban and rural dwellers.
This growth has led to the co-presence of “Two Chinas”: an urban and increasingly middle and upper-middle class which accesses allopathic medicine from modern tertiary facilities, and a large poor and rural population who face both greater physical and financial barriers to access care in the urban centers. The two Chinas have very different income levels, life expectancies (75.2 years vs. 69.6 year in 2005), and infant mortality rates (10.7 vs. 25.7 per 1,000 live births).36
Summary and Overview of the Volume
This chapter has described a variety of lenses and frameworks through which one can begin to analyze China’s developing healthcare system. None are inherently superior or inferior. Instead, they alternatively highlight goals and tensions, structures, functions, corporate and individual actors, flows and exchanges, and dynamic transitions. One might wisely employ multiple approaches to develop a comprehensive understanding of China or any other healthcare system in an emerging economy.
In analyses of the US healthcare system, we typically rely on a value-chain framework that focuses on the major actors and the economic exchanges (as buyers and sellers) between them. We loosely adopt that framework (see Figures 1.8 and 1.9) in this volume to focus on several of the key actors in China’s healthcare system: hospitals, physicians, public and private insurers, pharmaceutical firms, biotechnology firms, and medical device firms. Consistent with the “control knobs” approach depicted in Figure 1.7, we also spend considerable time describing the wider societal context underpinning China’s healthcare system and the policy levers used in the past to achieve its desired intermediate and ultimate ends.
There are two additional introductory chapters in this first section of the book. Chapter 2, by Lawton Robert Burns and Yanzhong Huang, expands upon some of the issues dealt with in this chapter. The chapter describes the history of China’s healthcare system and succession of reforms undertaken since the Maoist era. It also discusses some of the key historical events in the evolution of China’s healthcare system and the wider Chinese economy. Chapter 3, by Xiaofeng Liang and Lawton Robert Burns, provides an in-depth overview of China’s public health system and the manifold challenges it faces in dealing with non-communicable diseases (NCDs).
The second section of the book describes the healthcare reforms under way in China and the challenges such reforms face. Chapter 4, by Gordon G. Liu and Sam Krumholz, describes the prior impact of healthcare reform on China’s epidemiological transition. Chapter 5, by Claudia Suessmuth-Dyckerhoff and Florian Then, examines the current state of reform efforts. Chapter 6, by Tsung-Mei Cheng, assesses the challenge facing reform efforts going forward to deal with China’s chronic disease burden.
The third section of the book focuses on healthcare provision. Chapters 7 and 8 provide an introduction to the two main providers in China’s healthcare system: physicians and hospitals. Chapter 7, by Lawton Robert Burns, describes the different systems of medicine in China and focuses on the training and organization of allopathic physicians. Chapter 8, by Gerard La Forgia and Winnie Yip, focuses on China’s public hospital system and efforts to reform it. Chapter 9, by Vanessa Folkerts and Roberta Lipson, presents a case study of one of the most prominent examples of a private hospital chain: United Family Hospitals. Chapter 10, by John Whitman and Lawton Robert Burns, describes the market for eldercare and long-term care services in China.
The fourth section of the book focuses on healthcare finance issues. Chapter 11, by Ambar La Forgia and Lawton Robert Burns, describes China’s healthcare insurance sector, stemming from its roots in the public sphere and its nascent expansion into the private sphere over the past decade. Chapter 12, by Karen Eggleston, Kate Bundorf, and colleagues, describes experiments under way in rural China to provide insurance coverage that tackle chronic disease. Chapter 13, by Gordon G. Liu, Nan Luo, and Zhongyun Zhao, discusses the technology assessment and reimbursement policies in China and Southeast Asia.
The final section of the book focuses on three sectors of producers in China’s healthcare system: pharmaceutical manufacturers (Chapter 14 by Rachel Lee and Lawton Robert Burns), medical device manufacturers (Chapter 15 by James Deng and Lawton Robert Burns), and life sciences investment and biotechnology (Chapter 16 by Stephen M. Sammut and Lawton Robert Burns). Due to their historical prominence, multinational corporations are a major topic of discussion when considering these sectors; we endeavor to counterbalance that discussion with a description of the domestic players developing within each of these sectors.


