

INTRODUCTION
Biological N fixation (BNF) by legume/rhizobium symbioses is a key biogeochemical process that adds fixed atmospheric N2 to nutrient cycles. BNF often responds positively to phosphorus (P) availability in mechanistic research as well as managed and natural ecosystems (Chaudhary et al., Reference Chaudhary, Adu-Gyamfi, Saneoka, Nguyen Tran, Suwa, Kanai, El-Shemy, Lightfoot and Fujita2008; Marschner, Reference Marschner1995). Increases in BNF from P additions have been considered a key option to sustain soil productivity and livelihoods of smallholder farmers around the world (Franke et al. Reference Franke, van den Brand and Giller2014; Mafongoya et al., Reference Mafongoya, Bationo, Kihara and Waswa2006; Vanlauwe et al., Reference Vanlauwe, Diels, Sanginga, Carsky, Deckers and Merckx2000), especially in cases where the reliance on BNF has declined (Snapp et al., Reference Snapp, Mafongoya and Waddington1998). Soluble P inputs have been proposed for this use, while rock phosphate (RP) and other sparingly soluble P sources have been proposed as alternative P sources to enhance legume BNF in agriculture. RPs, particularly more plant-available sedimentary types, may be accessed by legumes through mechanisms such as rhizosphere acidification due to BNF (Perez et al., Reference Perez, Smyth and Israel2007), organic acid exudation (Hocking and Jeffery, Reference Hocking and Jeffery2004), and mycorrhizal (AM) symbioses (Barea et al., Reference Barea, Toro, Orozco, Campos and Azcon2002). Less processing is required for RP than other P fertilizers, reducing the use of fossil energy and cost to farmers. RP may also avoid irreversible P sorption in soil, since primary P minerals in RP are weathered in place, leading to more positive residual impacts for added RP than for soluble P (Doll et al., Reference Doll, Miller and Freeman1960; Drinkwater et al., Reference Drinkwater, Schipanski, Snapp, Jackson, Snapp and Pound2008). However, RP availability varies not only with the type of RP but with soil context, so that RP has been inconsistent in boosting crop yields. Previous tests of RP within Bolivian contexts where our research was conducted revealed few improvements in potato and maize productivity (Villaroel, Reference Villaroel1988). Nevertheless the use of RP as an option to enhance legume BNF has been studied only in single soil or farming system contexts (e.g. Somado et al., Reference Somado, Sahrawat and Kuehne2006) rather than in multiple contexts.
Multi-environment trials within an options by context (OxC) framework are an important way that research can support the use of soluble and sparingly soluble P to enhance BNF in smallholder farming systems. These trials can test how P enhances BNF across gradients of climate, soil type and farmer management regimes that define these smallholder contexts, an interaction that has been summarized in the idea of a socio-ecological niche (Ojiem et al., Reference Ojiem, De Ridder, Vanlauwe and Giller2006). Management induced gradients are important in defining such niches, since management by smallholder farmers often enhances gradients in fertility between intensively managed fields near to dwellings and those less fertile and more distant fields where inputs and other management are more sporadic (Giller et al., Reference Giller, Rowe, de Ridder and van Keulen2006; Vanek and Drinkwater, Reference Vanek and Drinkwater2013)
Because local soil management and soil taxonomic knowledge are integral parts of the context within such OxC research, combining exogenous, generalized scientific knowledge and local farmer knowledge of soils in the interpretation and communication of these research results is an important step (e.g. Winklerprins and Barrera-Bassols, Reference WinklerPrins and Barrera-Bassols2004, Barrios and Trejo, Reference Barrios and Trejo2003). Combining these two knowledge systems increases understanding of the effects of management gradients on technology options and indicates how context dependence can best be communicated to farmers and made more relevant to local characterization schemes.
In response to these research needs, our study assessed how legume BNF could enhance nutrient cycling in response to P sources of varying solubility across a range of soil and management contexts. Within Andean smallholder cropping systems at varying elevations we sought to (1) understand the impact of RP and soluble P on legume BNF across a gradient of soil type and soil fertility contexts; (2) better understand the associated legume attributes based on BNF (e.g. residue quality for nutrient release, AM colonization) respond to farmer management contexts; and (3) link the response across contexts to farmer categorization of high (H) and low (L) fertility fields in the trial and other salient aspects of farmer soil knowledge. We hypothesized that differences in soil P fertility would most strongly predict legumes’ response to P addition, with legumes in more P-fertile sites showing diminished P response according to resource-limitation principles such as Von Liebig's law of the minimum. We also contemplated that other soil factors could impact the availability of P additions (e.g. soil pH affecting RP dissolution, clay content determining the chemisorption of soluble P on oxide clays). We further predicted that farmers’ appraisals of fertility differences would be linked to differences in P fertility, rather than other soil properties such as texture, pH or soil organic matter (SOM) content. Farmer-appraised soil fertility would thus also predict the responsiveness of sites to P addition.
Our research focused not only on BNF, but also in other aspects of legume performance important for smallholders such as soil cover, shoot and root stocks and biomass ratios that predict food and forage vs. residue impacts, relations to AM symbioses and residue stoichiometry that affects nutrient release such as carbon:N and carbon:P ratios (C:N, C:P). We predicted that soil cover and biomass would be tightly linked to legume BNF and would thus also respond to a greater degree in low-P sites. We also predicted that, in contexts where P addition was effective, its effects on C:N and C:P residue quality would be smaller than the effect of added P on biomass stocks of C, N and P, based on the microeconomic paradigm of plant functional equilibrium (MEP; Bloom et al., Reference Bloom, Chapin and Mooney1985). The MEP argues that alleviating a nutrient constraint allows plants to reinvest additional fixed C to address limitations from other nutrients. Addition of P would thus resolve P-limitation for N-fixing legumes, which would in turn remove N constraints on biomass. Biomass C therefore expands in a proportional way to both P uptake and fixed N, leading us to predict that residue C:N and C:P would change less under P addition than overall biomass. Both biomass and residue quality impacts of P addition can alter nutrient cycling in soils (Abarchi et al., Reference Abarchi, Zhang, Vanlauwe, Guo, Wang, Ong'Or and Timbely2009), so that distinguishing these two effects as part of OxC research is important. We also predicted based on the MEP that RP additions would not change AM colonization of roots while TSP would reduce it, since RP carries additional C costs for investment in AM compared to direct soluble P uptake. Decreases in AM colonization with soluble P could eventually decrease reliance on AM services and make legumes more dependent on soluble P inputs. Plant functional equilibrium also led us to predict increases in shoot:root biomass ratios from P addition. Because harvest of most aboveground biomass for food and forage is customary among smallholders, this could mean reduced residues in root biomass and belowground N and P stocks if plants reallocate biomass above ground where it can be harvested. However, if root and shoot biomass both increase with added P, absolute residue impacts and benefits from both roots (residues for soils) and shoots (harvested for food, sale or forage) would be favoured regardless of the ratio between them. Shoot:root relations are little-studied in smallholder contexts, and information on these relations can clarify trade-offs between harvest and incorporation of legumes as green manures.
MATERIALS AND METHODS
Hypotheses were tested in experiments over 2 years (2005–2006 and 2006–2007 planting seasons) at elevations ranging from 2800 to 4000 meters in Potosí department, Bolivia (latitude/longitude: −65.95° /−17.95° to −66.30°/−18.30°). Average rainfall is 650 mm, occurring from October to March. Mean temperatures during cropping ranged from 9.5 °C to 18.0 °C. Soils are dominantly eutric leptosols with some eutric and dystric cambisols in fields with deeper soils, derived from shale and sandstone parent material. To incorporate local soil knowledge, potential farmer-collaborators identified sites they categorized as either low (L) or high (H) fertility. Other local texture, organic matter and colour descriptors were also gathered for the fields, though we focused on soil fertility categorization that was hypothesized to align with soil P status. In 2005–2006, the experiment was planted in one L and two H sites at three different elevations beginning 16 October 2005 (Figure 1). In 2006–2007, the number of communities was expanded to seven (using different sites), each with one L and H field site beginning 5 November 2006 (Figure 1).
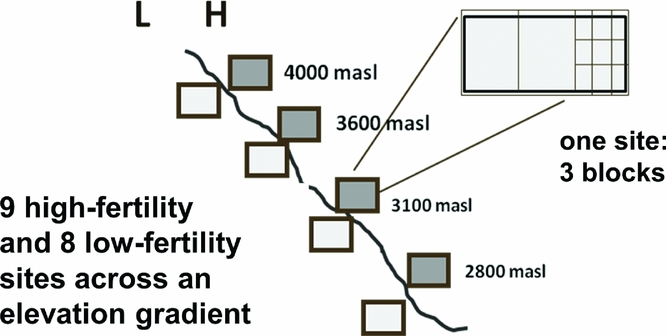
Figure 1. Arrangement of experimental sites and blocks along an elevation gradient between 2700 and 3950 m elevation, and with respect to farmer-designated high (H) and low (L) soil fertility. Experiments took place in the 2005–2006 and 2006–2007 growing seasons (November to April) in the Bolivian Andes. Each experimental site consists of a three replicates of a trial with eight treatments reflecting a P addition (no P addition, rock phosphate, triple superphosphate) by legume species (vetch, tarwi) factorial with six treatments, plus endemic weed and oat (Avena sativa) control treatments.
Andean hillside cropping systems have evolved and adapted over millennia as farmers domesticated species such as potatoes (Solanum andigena, other Solanum spp.) and quinoa (Chenopodium quinoa) and then incorporated new crops like faba beans (Vicia faba) and Mediterranean cereals. We installed our experiments on fields that were finishing the typical local crop rotation: potato, then faba bean, maize (Zea mays) or small grains, then cereals. Wheat, oats or barley preceding the experiment at all sites. All fields had mineral soils although two sites (8L and 8H, see Table 3) known as yana jallp'as (black earths) in the local Quechua language, contained high organic matter (SOM) from peat accumulation at high elevation (Figure 2a).

Figure 2a–d. Site means and standard errors of selected field soil characteristics used in the discriminant and PCA analysis. Dark bars are high fertility fields (H) as classified by farmers, light bars are low fertility fields (L); 8L and 8H are fields with high-organic matter soils categorized by farmers as less and more productive, respectively. Sites marked (05) are from the 2005–2006 season; the remainder were used in 2006–2007.
SOIL AND SITE CHARACTERIZATION
The experiment comprised eight low and nine high-fertility sites (17 sites total), with three blocks at each site excepting one (8H, Table 3) which only had two blocks, for a total of 50 completely randomized blocks (see treatment details below). To assess soil properties and their relation to P response and farmer-appraised fertility, 12 soil parameters were used to characterize experimental blocks: mean air temperature for the growing season (Hobo loggers, Onset, Bourne, MA, USA); soil pH (1:2.5 soil:water) total C and N (by combustion, LECO, St Joseph, MI, USA), percent sand, silt and clay, and five P fractions of differing availability. Phosphorus fractions were measured using a sequential pool extraction modified from Tiessen and Moir (Reference Tiessen, Moir and Carter1993): bicarbonate inorganic (Olsen-Pi), bicarbonate organic (Bicarb-Porg), 0.5 M NaOH-inorganic and organic pools (OH-Pinorg and OH-Porg) and 1M-HCl extractable inorganic P (DHCl-Pi). Site temperature was tightly correlated to elevation (R2 = 0.98) and was used as a proxy for elevation in statistical analyses. Field slope and distance from farmer dwellings to sites measured by GPS receivers were used in some analyses.
EXPERIMENTAL DESIGN
To test the impacts of RP and soluble P on legume BNF, residue amount and quality and AM symbioses, the locally adapted legumes Lupinus mutabilis Sweet (Andean lupin, tarwi) and Vicia villosa Roth subsp. varia (Host) Corb (lana vetch) were seeded in randomized complete blocks at the 17 sites over 2 years. Tarwi is a native crop that is consumed and sold locally as a food source and has potential as a green manure crop. Lana vetch is an introduced forage crop that is planted with forage oats to enrich animal fodder, and also has promise as a green manure. Lana vetch is mycorrhizal and allowed us to measure AM colonization across a soil fertility gradient in response to added P. Tarwi is non-mycorrhizal and exudes organic acids for P acquisition, also forming proteoid roots under P starvation (Hocking and Jeffery, Reference Hocking and Jeffery2004). Experimental treatments combined these species in a factorial with three P levels: an unfertilized control (0P) and 40 kg ha−1 P as either RP or triple superphosphate (TSP). A weed-only and forage oat control, with legume weeds removed, were added to each block for use as reference plants in the 15N natural abundance method (below). Crops were sown in 2 x 2 m plots at 60 kg ha−1 for tarwi and 90 kg ha−1 for vetch. Vetch was broadcast in 2005–2006, and sown in rows at 15 cm spacing to facilitate weeding and root sampling in 2006–2007; tarwi was sown in rows with 50 cm between rows and 15 cm spacing in-row in both years. Capinota RP (Universidad San Simon, Cochabamba, Bolivia) and TSP were incorporated into soil prior to seeding. Plots were weeded twice to make root sampling specific to each species.
PLANT BIOMASS FRACTIONS
Aboveground fresh biomass was cut and weighed at crop flowering from interior rows in 2006–2007 or 1 x 1 m quadrats for broadcast plots in 2005–2006. These harvests occurred in March and April of the years 2006 and 2007, at between 135 and 160 days of crop growth. Dry matter content (%DM) was found by weighing a subsample (~300 g) in the field followed by drying between 45 and 60 °C to constant weight before weighing for %DM. Taproot, crown and nodule biomass was measured to 25 cm depth by excavating two randomly chosen rectangles of length x width 15 x 25 cm for vetch and 50 x 50 cm for tarwi on the interior of each plot, centred on rows where present. Plant stand was measured to estimate total taproot biomass from the dry weight of excavated taproots (between 5 and 15 taproots depending on planting density and stand). Taproots, crowns, nodules and roots were refrigerated until they could be separated for dry weight, nutrient analysis and AM staining. For nutrient analysis of roots, a flat mat of roots containing a large number of root diameters from ~0.2 to 2 mm was gathered from excavated roots and washed in tap water. To prevent rot and aid drying, this root sample was rinsed in 90% ethanol before drying in filter paper. A 15-degree sector comprised of a large number of root fragments was cut out of the mat of roots before drying and placed in root fixative (35% ethanol, 3% acetic acid) for root staining and scoring of AM colonization (see below).
Root biomass was estimated by bulking 16 soil sample cores in each experimental plot for wet sieving and recovery of roots (below). Eight cores were taken between plants and eight cores were from near to (~3 cm) plant crowns. Of these, between 8 and 10 undisturbed, intact cores were weighed to estimate moist bulk density. Root biomass soil samples were refrigerated and processed within two weeks for estimates of fine root C. Root biomass C was estimated using wet sieving and separation of roots from particulate organic matter (POM): 300 g of moist soil was soaked in tap water for 10 minutes and then decanted through 2 mm and 0.5 mm stacked sieves. POM and roots from the 2-mm sieve fraction, which contained roots down to 0.2 mm diameter, were then hand separated using forceps while suspended in water. Roots were dried and weighed on a microbalance, and then analysed for C and nutrients (below). Analyses of C:N and C:P in the larger root sample from plot excavations were used to calculate N and P stocks associated with C in the cored root samples. The 0.5 mm sieve root fraction was not separated from POM or used to calculate root biomass. Inspection of the 0.5 mm sieve fractions on scanned images of unsorted roots and POM in trays showed that roughly 25% of the sample was small root fragments, which means that roots recovered on the 2 mm sieve represented a lower bound on root biomass. The >2 mm sieved root samples did, however, represent a wide range of root diameters and were adequate to assess P treatment and species differences in root biomass.
STAINING OF ROOTS AND SCORING OF AM COLONIZATION
To assess impacts of P inputs on AM functional importance for legumes, AM in roots were stained using trypan blue (Koske and Gemma, Reference Koske and Gemma1989). Small subsamples from roots stored in vials were cleared in 10% KOH solution at 90 °C for 15 minutes. Roots were acidified in 1% HCl (6 h), stained with trypan blue, and then de-stained in acidic glycerol (>2 days) before mounting on slides. On each slide 25 to 30 root segments were mounted for microscope scoring at 400x magnification. Roots crossing the microscope field were scored positive for AM colonization if fungal hyphae connected to diagnostic AM structures (arbuscules, coils) occurred along a perpendicular line traversing the root. Fifty root intersections per slide were scored and percent colonization was the fraction that scored positive.
NUTRIENT ANALYSES
After grinding to size <0.6 mm, total C and N was measured by combustion in shoots taproots, nodules and roots harvested from coring and excavation (LECO C and N analyser, St. Joseph, MI, USA). Total P in the biomass fractions was determined using a nitric acid digestion of ground plant tissue with H2O2 addition to oxidize organic carbon in the final digestion steps. Digested residue was dissolved in 4% HCl and analysed for orthophosphate using the molybdate blue method on a Seal AQ2 discrete auto-analyser (SEAL Analytical, Mequon, WI, USA). C, N and P stocks in above- and below-ground fractions were calculated by multiplying the biomass of each fraction (kg ha−1) by its nutrient content (g kg−1).
MEASUREMENT OF LEGUME BNF WITH N-15 NATURAL ABUNDANCE
Proportion N fixed via BNF (%Ndfa) and amount fixed (Ndfa) was calculated using the natural abundance method (Shearer and Kohl, Reference Shearer and Kohl1986) with the equation
 $$\begin{equation*}
\% {\rm{ Ndfa}} = 100*\left[ {\left( {{\delta ^{15}}{\rm{N}}\,{\rm{reference}}\, - \,{\delta ^{15}}{\rm{N}}\,{\rm{legume}}} \right)\,/\,\left( {{\delta ^{15}}{\rm{N}}\,{\rm{reference}}\,-\,{{\rm{B}}_{{\rm{legume}}}}} \right)} \right]\!.
\end{equation*}$$
$$\begin{equation*}
\% {\rm{ Ndfa}} = 100*\left[ {\left( {{\delta ^{15}}{\rm{N}}\,{\rm{reference}}\, - \,{\delta ^{15}}{\rm{N}}\,{\rm{legume}}} \right)\,/\,\left( {{\delta ^{15}}{\rm{N}}\,{\rm{reference}}\,-\,{{\rm{B}}_{{\rm{legume}}}}} \right)} \right]\!.
\end{equation*}$$
Briefly, the 15N signature (δ15N or deviation from atmospheric 15N:14N) of a field-grown legume (δ15N legume) results from mixing between the signature of soil N uptake measured by non-fixing reference plants (δ15N reference), and δ15N for the legume when grown using only atmospheric N (the legume's B-value, Blegume). The proportion N fixed (%Ndfa) was multiplied by N uptake in each biomass fraction to give the amount of Ndfa in different biomass fractions. δ15N was assessed on plant samples powdered by roller-grinding in glass jars with stainless-steel rollers. Approximately 4 mg ground plant matter was weighed into tin capsules for analysis at the University of California-Davis stable isotope facility (Davis, CA, USA). We used endemic non-legume weeds with tap-rooted root systems in the weedy control plots as reference plants. B-values for vetch and tarwi were assessed with plants grown in sterile zero-N media (Turface proleague, Profile LLC, Buffalo Grove, IL, USA) under greenhouse conditions with four pots of each species. Four plants of vetch and two of tarwi were grown per pot and inoculated with the same inoculants used in the experiment. At flowering, shoot biomass from each pot was dried and ground for 15N analysis. The mean of δ15N for the pots was taken as the species’ Blegume.
STATISTICAL ANALYSES
To summarize variability in site soil parameters in statistical modelling, principal components (PCs) analysis (PCA; JMP, SAS institute, Cary NC USA) was employed with soil variables given above. Orthogonal rotated factors were extracted using a varimax rotation from PCs with eigenvalues >= 0.85. We relaxed the condition on eigenvalues slightly (from >= 1, a typical practice) to create more interpretable factors. Rotated PC factors were interpreted using loadings of the 11 site variables on each PC, and were used as covariates indicating site and block-level variation, and interactions with species and P addition. Effects of P fertilization on legumes were evaluated using a random effects model with site and site x block random effects and species and P fertilization as fixed effects. Site variables at a block level, and rotated factors corresponding to each block were used as covariates to test species and P fertilization by context interactions. To understand the correspondence of local knowledge to soil analyses, we conducted canonical discriminant analysis (JMP, SAS institute, Cary NC, USA) to query which soil variables discriminated most strongly between farmer-categorized high (H) and low (L) fertility fields. Forward and backward stepwise variable selection identified variables that were statistically significant or at least potentially relevant (i.e. with P values <= 0.60). These variables were then used in a final analysis.
RESULTS
Experimental context: variation in soil properties and farmer fertility designations
High (H) fertility fields as classified by farmers had higher Olsen-Pi (Figure 2a, t-test, P = 0.003) and OH-Pinorg (Table 1) than did low-fertility (L) fields. Bicarb-Porg, OH-Porg, and soil organic carbon (SOC) contents were also higher in H than L fields when two high-organic matter fields (8H, 8L) were excluded (Figure 2b, Table 1, t-test, P < 0.05). Field slope and household-to-field distance were higher for L than for H fields (Table 1), suggesting infield/outfield differences in soil fertility management and higher erosion rates in L fields. Meanwhile, soil texture and soil pH varied among fields but did not differ between H and L fields (Figure 2c, Table 1). Soil dilute HCl-Pi content was generally higher in H fields at middle to high elevation, while two L fields at low elevation reversed this trend with high dilute HCl-Pi content (Figure 2d). A discriminant analysis excluding fields with high SOC (8L, 8H) separated H and L fields with available soil P (Olsen-Pi) and SOC as key discriminant variables (Figure 3a, Wilks-lambda P < 0.001).
Table 1. Field soil properties. Means are shown for low (L) or high (H) fertility fields as designated by farmers. Significance of t-test comparing groups of L vs H given at bottom (*P < 0.05; **P < 0.01; ns, no significant difference). Fields are numbered in order from low to high elevation.

♣H vs. L differences are significant at P < 0.05 when two high organic matter sites (8L and 8H) are ignored in the comparison.

Figure 3a–b. 3a. Score plot from discriminant analysis of fields ranked as high fertility (filled symbols) or low fertility (open symbols) by farmers. Table inset shows F ratio and significance of seven soil variables in the corresponding discriminant analysis using farmer-selection of fields as high or low fertility as a category. 3b. Biplot of PC2 vs. PC1 from the principle components analysis showing differences among sites relevant to farmer selection as high (dark symbols) or low (open symbols) fertility fields. Diamond symbols are sites from 2005–2006 while circles are sites from 2006–2007.
A PCA analysis of soil properties showed that soil P fertility demonstrated the largest degree of variation among other soil characteristics. A varimax rotation extracted four PCs with loadings of 11 soil variables accounting for 87% of site-level variation (Table 2). PC1 summarized the sequentially extracted P pools with the exception of dilute HCl-Pi (Table 2) and was also correlated to P uptake by the forage oat reference crop planted in each block (R = 0.59, P < 0.001). Soil pH was inversely related to these P pools within PC1, reflecting soil acidity in more P-fertile middle and high elevation sites with more positive hydric balances and greater leaching potential, as well as acidic buffering from higher organic matter (seen in the positive loading of SOC on PC1). Scores of high and low fertility fields along PC1 differed significantly (t-test, P = 0.015), contributing to separation of H and L fields within the PC1 by PC2 biplot (Figure 3b).
Table 2. Loadings of site soil variables on orthogonal rotated factors using a varimax rotation of first four principal components (PCs) from 50 experimental blocks accounting for 87% of the variation among measured site variables. Transformations of variables to correct non-normality are shown. For clarity, loadings <0.25 have been left blank, and those >0.50 have been placed in bold text.

PC2 summarized SOC content, soil N content and soil bicarb-Porg as measures of SOM (Table 2). Because of high SOC and soil bicarb-Porg concentrations, the 8L and 8H sites separated from other sites along PC2 (Figure 3b). The uptake of N by oat reference plots was also correlated to PC2, linking it to soil N fertility (R = 0.40, P = 0.02). Unlike PC1, H and L fields did not segregate along PC2 (Figure 4). Farmer soil fertility distinctions were thus more related to available P than to soil C or N content. PC3 reflected soil texture as a parameter distinct from SOC, P fertility, and farmer soil fertility categorization (Table 2). Meanwhile, PC4 was dominated by the dilute HCl-Pi (DHCl-Pi) pool linked to soil calcium phosphates, followed by site elevation represented by temperature. Soil pH loaded weakly and positively on PC4, consistent with higher soil pH at lower elevations and accumulation of DHCl-Pi in soil of pH 7 or above (e.g. sites 1L, 1H, 4L; Figure 2d).

Figure 4a–b. Fixed N and N taken up from soil for different P addition treatments along the soil gradient for soil texture (a, PC3) and dilute HCl-Pi/site temperature (b, PC4). Dark bars indicate N from soil (Ndfs) and light bars represent fixed N (Ndfa) within total legume biomass for shoots, roots and nodules. Means were evaluated at the −1 and +1 value of the standardized PC3 and PC4. Different letters denote significantly different means for the N uptake fraction (P < 0.05).
P addition by context interactive effects for BNF, biomass and N and P uptake
The impact of P addition on legume N uptake and BNF was positive on average but varied among sites (Tables 3 and 4). Mean legume shoot N uptake (Ntot) increased 28% with RP addition and a 43% with TSP addition when averaged across sites and ignoring significant soil covariate interaction effects presented below (P < 0.05). P effects did not differ with species, although species main effects and interactions were included in statistical models (Tables 3–6). Results only partially confirmed the hypothesis that RP and TSP had maximum impact at low P fertility defined by farmers. Seven of nine P-responsive sites were L fields, suggesting that P limitation played a role (Table 3). However legumes in half of L fields did not respond to RP addition, indicating a weak link for RP addition between farmer-identified low P fertility and P addition impacts. Also, TSP increased legume Ntot at four H sites, suggesting P-limitation even at these sites. In a mixed model for Ntot, farmer classification of sites did not interact significantly with P addition and was thus a weak predictor of legume P response (P = 0.25; analysis not shown but similar to statistical interactions in Table 4).
Table 3. Site-level results for total N uptake in roots and shoots, BNF plus soil-N, for vetch and tarwi. Percent increase in N uptake and statistical significance of increase with RP and TSP addition is shown at right (significance of contrast comparing RP or TSP to the 0P control: *= P < 0.05 level; **= P <0.01 level). L and H show sites classified as low and high fertility by farmers.

1Mean N uptake aboveground was <5 kg ha−1 and root biomass was not assessed due to poor drainage and root rot.
Table 4. Mixed-Model ANOVA results for Shoot N, amount N derived from atmosphere (Ndfa), amount N derived from soil (Ndfs), proportion N fixed (%Ndfa), and total P uptake in roots and shoots. P addition by PCA rotated factor (PC) interactive effects indicate differing effectiveness of P addition on legume responses with site differences in characteristics represented by each factor. Species by PC interactions are not shown but were included in statistical models when significant.

Table 5. %Ndfa, Shoot:root biomass C ratio, and C:N of shoot and fine root biomass. These legume attributes did not interact significantly with rotated factors describing site parameters (PC1 through PC4).
*Main effect of PC2 on root C:N ratio, significant at P < 0.01, with −1.14 decline in root C:N ratio per unit decrease in PC2.
Table 6. Legume responses to RP and TSP addition in different contexts of soil inorganic P fertility, soil texture, and elevation/calcium phosphate pools. Means for left side and right sides of the table are evaluated at low and high levels respectively for lower and higher inorganic P fertility (panel a), soil clay content (panel b) and Ca-P fraction/site temperature (panel c). Different letters denote significant differences within each PC level (−1, +1) at P < 0.05.
*Main effect of PC1 significant, P = 0.01.
†Sum of taproot, fine root and nodule biomass.
Because soil P fertility of sites did not completely explain significant differences in the impact of added P, we used statistical interactions between P addition and the PCA factors PC1 through PC4 summarizing soil characteristics to more fully account for P addition by site interactions (Table 4). These analyses showed that P uptake as well as total N uptake and legume BNF all increased to a greater extent in soils with light textures (low PC3) and low DHCl-Pi/site temperature (low PC4). In low-clay soils, Ndfa increased by 65% with RP and over 100% with TSP, while increases in Ndfa occurred only with TSP addition in high-clay soils (Figure 4a). Increases in Ndfa and N from soil (Ndfs) in light-textured soils occurred with increases in total P uptake that were 70% higher for RP addition and almost three times higher for TSP addition (Table 6). Clay content as a covariate separate from PCA factors interacted significantly with P fertilization treatments on Ndfa in the same way that PC3 did (P < 0.05; see additional results, online supplement).
The greater impact of P addition on Ndfa, Ndfs and P uptake in fields with lower soil DHCl-Pi and site temperature (Figure 4b) could have resulted from soil calcium phosphates measured by the dilute HCl-Pi fraction, or from drought stress that hampered productivity and P uptake at warmer, lower sites. When tested separately in the statistical model for Ndfa, DHCl-Pi was highly significant (P = 0.007) in interaction with P addition, while temperature was only marginally so (P = 0.06), which indicates that calcium phosphates likely modulated legume BNF response to P addition. In addition, soil pH by itself did not determine the P-responsiveness of sites (P = 0.82 for the interaction pH x P addition).
Results confirmed our hypothesis that biomass amount responded more to P addition than the N or P concentration in biomass. For example, total Ndfa was highly correlated to total biomass C (R = 0.93, P < 0.0001) as well as to P uptake (R = 0.90, P < 0.0001). By contrast, changes in residue quality of legumes were relatively small (Table 5) with the exception of root C:P (see below). Added P therefore, expanded total biomass and associated nutrient stocks through increases in Ndfa where soil context allowed. Phosphorus stocks in nodules, roots and shoots had greater increases at sites with lower soil dilute HCl-Pi/elevation (Table 6, panel c). Relative to root P pools, increases were however larger in the case of shoot and nodule P pools (260% and 180% increase in shoot and nodule P from 0P to TSP vs. 90% for total belowground biomass). This suggested preferential allocation of added P to both shoots and BNF in nodules over root biomass, which is consistent with legumes allocating added P to address C and N fixation needs according to plant functional equilibrium. Finally, in contrast to the muted importance of soil P fertility (PC1) in determining P-responsiveness of sites to other parameters, nodule P was exceptionally responsive to soil P status, albeit small in absolute terms. It increased almost three-fold across the soil P gradient represented by PC1 (Table 6, panel a). This gradient also determined legumes’ allocation of added P to nodules: nodule P increased to a greater extend with P addition at sites with low P fertility (low PC1; Table 6, panel a).
Context-dependent effects on residue quality
Most residue quality measures showed only small responses to RP and TSP addition across a range of soil contexts (Table 5). Nevertheless, C:P ratios for shoot and root residues were narrowed by P fertilization at low soil P fertility (PC1) and showed no change at high soil P fertility (Table 6, panel a). Moreover, narrower root C:P ratios were accompanied by higher root biomass with TSP addition (Table 6, panels a and c). Addition of P thus increased both root biomass and root residue quality at sites with low soil P fertility.
Soil cover, shoot:root ratio and proportion N fixed
For a number of legume responses to P addition, there were no significant interactions between soil properties and P addition. Percent soil cover by legumes at midseason was significantly increased by both RP and TSP addition (P < 0.001) without regard to soil contexts (Figure 5). Cover increased almost 10% absolute in the case of RP addition and by almost 20% with TSP addition. Added P of either type would thus shorten the period that soil is unprotected after crop seeding. P additions also increased shoot:root ratio of legumes (Table 5), with no differential impacts based on soil properties. Increased shoot:root ratios were accompanied by increases in both shoots and root biomass under P addition (Figure 4, Table 6) so that above- and below-ground residues for potential subsequent soil impacts were increased. Added TSP increased the proportion N fixed (%Ndfa) compared to the control, from 59 to 64% (Table 5). This small %Ndfa increase was dwarfed by large increases in productivity, P uptake, and total N fixed with added P.

Figure 5. Visually estimated percent cover of soil by legumes 75 days after seeding. Interactions of P addition with PCA-derived factors (PC1 through 4) were not significant. Bars with different letters are significantly different at P < 0.05.
Mycorrhizal colonization
Tarwi roots were not colonized by AM, consistent with Lupinus species being non-mycorrhizal. For lana vetch there was a negative effect of site P fertility (PC1) on AM colonization across P fertilization levels (Table 7). Addition of RP did not reduce AM colonization. With application of TSP, AM colonization was reduced at sites with low SOM content (PC2), but not at sites with high SOM content.
Table 7. Mixed-effect ANOVA results for mycorrhizal colonization of vetch using PC covariates. Percent mycorrhizal colonization of vetch roots under different P addition treatments for 8 sites spanning gradients in soil texture, inorganic P and total soil C and N.

DISCUSSION
Interaction of context with P additions in affecting legume BNF
Our study assessed the response of a number of important functional characteristics of legumes to P addition across a range of smallholder contexts in the Bolivian Andes. Further, we aimed to understand legume P responses to farmer-generated soil fertility distinctions and soil data gathered on these contexts. The large range of P fertility in these fields as well as other soil parameters created a suitable OxC setting for testing legume response to P fertility in different contexts. Soil P fertility linked to farmer H/L designations of fields explained some aspects of the variation in legume growth and P responsiveness among experiment sites, albeit incompletely. We address first the aspects of legume response that were linked to soil P fertility before discussing other soil factors that were central to OxC interactions in the experiment. Phosphorus fertility of sites (PC1) did have an important effect in modulating stocks of C (i.e. total biomass) and P in both roots and shoots of legumes, which bears a conspicuous (and obvious) relation to what farmers mean by high and low soil fertility. In addition, increased soil P fertility was associated with lower C:P ratios of legume residues and the interactive response of residue P quality to P fertilization. These residue quality impacts of soil P fertility would be less conspicuous to farmers but could be important in their impacts on nutrient cycling. For example, Abarchi et al. (Reference Abarchi, Zhang, Vanlauwe, Guo, Wang, Ong'Or and Timbely2009) showed that for a range of C:P ratios similar to those here (C:P ratios in their data between 150 and 300), more P was mineralized at lower C:P ratios under incubation. Higher root biomass of improved quality for P release under decomposition at low-P sites could generate positive feedback effects on P-fertility, increasing P release with decomposition to successive crops even when some or all of shoot biomass was harvested, an important consideration for smallholder farmers who often prefer to utilize shoot biomass as forage rather than incorporating it as a green manure. Conclusions regarding P release from root residues of forage crops might not extend to grain legumes like tarwi, since P from roots might be reduced by remobilization to seeds before harvest, although remobilization from roots may be small compared to that from shoots (Snapp and Lynch, Reference Snapp and Lynch1996). Root residue biomass and quality may thus be relevant to soil nutrient impacts of P addition for smallholders, suggesting additional need for multi-environment research.
Notwithstanding these interactions between P addition and of soil P fertility among sites, other soil properties accounted better for the BNF responses of legumes to added P than farmer H/L categories or soil P fertility by itself. Soil calcium phosphate content (DHCl-Pi) and soil texture (PC3) were better predictors than overall P fertility of legume response to RP addition, in agreement with Khawsaneh and Doll's (Reference Khasawneh and Doll1978) findings that Ca-P status, texture and pH all regulate dissolution of RP. Our results are consistent with their findings that high Ca-P impedes dissolution of RP by rhizosphere acidification and organic acid exudation by legumes. The effect of soil texture in limiting the impact of P fertilization aligns with previous research, since silicate and metal oxide clays, including silicate clays likely present in these Andean soils, can act as sorption sinks for applied P (Demolon et al., Reference Demolon, Boischot and Lajon1953, Herlihy and McGrath, Reference Herlihy and McGrath2007, Mamo and Wortmann, Reference Mamo and Wortmann2009). Sorption by clays can hasten dissolution of RP by acting as a sink of dissolution products from apatite (Smyth and Sanchez, Reference Smyth and Sanchez1982), but clay sorption also obstructs the uptake of solubilized P, which may have been the dominant impact in our experiment suggested by the low response of BNF (strongly correlated with P uptake) to TSP and RP in clayey soils. This conclusion is summarized by the low recovery of TSP in high-clay soils: only 3.5 kg or roughly 9% of the 40 kg ha−1 TSP applied was recovered in legume biomass in heavy-textured soils, compared to 14% for light-textured soils (Table 6).
Soil pH is also known to affect the dissolution of RP and the availability of added P in general (Charanworapan et al., Reference Charanworapan, Suddhiprakarn, Kheoruenromne, Wiriyakitnateekul and Gilkes2014; Devau et al., Reference Devau, Le Cadre, Hinsinger, Jaillard and Gerard2009). Our experiment may not have detected it as a constraint because only two sites had truly alkaline pH. Four of five responsive sites to RP had a pH of 6 or greater (but low clay content and Ca-P status), suggesting that RP impacts can occur even under mildly acidic soil conditions when P sorption by clays and Ca-P concentrations are low enough to allow dissolution of RP by soil pH and/or rhizosphere acidification by legumes. These soil pH conclusions agree with Perez et al.’s (Reference Perez, Smyth and Israel2007) tests of RP efficacy, where response occurred at both pH 4.9 and 5.8. Our research thus suggests that soil contexts defined by low soil P status, low Ca-P status, light-textured soils and soil pH below 7 are necessary for RP to increase legume BNF and associated impacts on soil nutrient cycling, provided that sufficient legume residues are returned to the soil to foster these impacts.
Follow-on effects of P addition on legume nutrient cycling properties
Where allowed by soil contexts, impacts of applied P on legumes were substantial especially on biomass-related legume parameters that follow from increased BNF and directly enhance soil nutrient cycling. In accordance with Bloom et al.’s (Reference Bloom, Chapin and Mooney1985) microeconomic paradigm of nutrient limitation, additional P assimilated was used by legumes in a coordinated way that increased BNF and C fixation, soil cover, shoot: root ratio and root biomass. These parallel increases in C, N and P stocks confirm the large potential synergies between P addition and expanded BNF in smallholder systems to support food, forage and soil improvement in appropriate contexts (Figure 6). Sites in our experiment responded to a greater degree than those in research by Zingore et al. (Reference Zingore, Murwira, Delve and Giller2008) in Africa, where low availability of other nutrients negated soybean's response to added P. This contrast between regions in outcomes suggests that a full range of soil properties across wider geographic areas may be important in fully understanding experimental contexts.

Figure 6. Qualitative matrix incorporating exogenous and local soils knowledge, showing the impact of rock phosphate (RP) and soluble phosphorus fertilizer (TSP) over soil contexts in the experiment. Larger circles represent greater impacts. Soil P fertility (horizontal axis) and soil texture (vertical axis) are two dimensions of variation in which local soil designations (H/L and local terminology for soil texture) and soil-science based designations are aligned in a conspicuous way. Less conspicuous in local typologies is the soil content of calcium phosphates (Ca-P), which affect the impact of RP on legumes (hatched circles). Selected local terms for sandy (thiu) and clayey (turu) soils are included, as well as a local term for a light-textured soil with abundant rock fragments (challa jallp'a) that may contain Ca-P in the process of weathering.
Soil cover and positive feedbacks on soil P via erosion prevention
Increased soil cover resulting from P addition in our experiment across all sites suggests that fertilized legumes may allow soil P retention by reducing erosion, an outcome described for bean genotypes by Henry et al. (Reference Henry, Chaves, Kleinman and Lynch2010). Large proportional increases in soil cover with P addition, and absolute values of cover greater than 30% are encouraging, since 30% is a threshold above which soil erosion is reduced (Duran and Rodriguez Pleguezuelo, Reference Duran Zuazo and Rodriguez Pleguezuelo2008). Increased soil cover by legumes with added RP or TSP at midseason occurred across the gradients in soil type and P fertility contexts mapped by our PCA analysis (PCs 1–4), in contrast to OxC interactions for legume productivity when biomass was sampled a few months later. These differences over time suggest that site constraints to P addition occurred incrementally as the season went on, while more applied RP or TSP was initially available to legumes.
Local soil knowledge within options by context findings
It is useful to relate local farmer soil knowledge and soil management to the set of local soil contexts and their interaction with P fertilization, which is summarized in Figure 6. Differences in P fertility between sloped, C- and P-impoverished outfields and high fertility infields along PC1 were consistent with field nutrient balances in these systems as well as infield-outfield differences documented in African smallholder contexts (Giller et al., Reference Giller, Rowe, de Ridder and van Keulen2006; Vanek and Drinkwater, Reference Vanek and Drinkwater2013). Meanwhile PC2 (soil C, N, organic P) reflected SOM accumulation typical of high elevation Andean environments (Egashira et al., Reference Egashira, Uchida and Nakashima1997), recognized by the local term yana jallp'a or black earth in common use by farmers. Site variation along PC2 may also reflect long-term management, either maintenance of SOM via nutrient inputs or loss of SOM soil horizons via tillage and erosion. Soil OM seemed to also negate the effect of TSP in reducing AM colonization rates. This effect may not be conspicuous or important to farmers in the short run, but could indicate that even if P inputs (either RP or TSP) are used to sustain residue return to soils and SOM in soils, AM will continue to be important in these systems.
Soil texture was represented by PC3 in a manner orthogonal to other soil characteristics and unrelated to H/L categories, showing that farmers’ textural classes are crossed with their notions of H and L fertility (Figure 6; Winklerprins and Barrera-Bassols, Reference WinklerPrins and Barrera-Bassols2004). Meanwhile PC4 (Dilute HCl-Pi, temperature) combining site elevation with calcium phosphate (Ca-P) pools was more tenuously linked to local soil knowledge in spite of the fact that Ca-Ps mediated the impact of RP on legume BNF and productivity (Figure 6). In high-elevation fields, Ca-Ps may have resulted from fertility additions (Lehmann et al., Reference Lehmann, Lan, Hyland, Sato, Solomon and Ketterings2005), while high Ca-P at low elevation may indicate Ca-P accumulation in drier, more alkaline soils, similar to those found in aridisols (Herlihy and McGrath, Reference Herlihy and McGrath2007; Lajtha and Schlesinger, Reference Lajtha and Schlesinger1988). Calcium-P pools may also reflect primary P in soil parent material. The experiment was located within 50 km of known Bolivian RP deposits (e.g. Capinota, Bolivia), and the 4L and 1L sites with high Ca-P had eroded soil surface horizons including bedrock parent material. Of interest here, given the role of the DHCl-Pi in defining the P response of legumes, is that Ca-P from divergent sources (management, hydric balance and pH, parent material) may have had the same interactive effects in diminishing RP impacts.
Management and policy implications for OxC approaches
Impacts of P addition reported here agree with research showing P-limitation of BNF in smallholder agriculture and the potential for rapid impact of both soluble P and RP (Somado et al., Reference Somado, Sahrawat and Kuehne2006). The strength of our work and other OxC research is in defining appropriate contexts for impacts for a range of site properties, rather than only at the mechanistic or single site level (Figure 6). In these suitable soil contexts RP and soluble P can substantially increase legume impacts for production and soil regeneration in smallholder agroecosystems. Augmented Ndfa, soil coverage and nutrient stocks with narrower C:P ratios at P-infertile sites were all mechanisms by which legumes could increase labile N and P stocks and improve release of biomass N and P in subsequent cropping, whether they were incorporated as green manures, harvested as forage to be recycled to soils as manure, or consumed as food while leaving shoot and root residues.
Across the experiment, soluble P was most effective in improving legume BNF and contributions to nutrient cycling (Figure 6) and would show promise in quickly boosting the productive role of legumes for food, forage and soil enrichment. Nevertheless, the lower impact of RP in the short term might be balanced by other advantages: promotion of AM's role in P uptake, lower cost to farmers, and residual effects of RP placed in the soil, which we did not assess in our study. Nevertheless, Villaroel (Reference Villaroel1988) found some small residual effects of Capinota RP in high-fertility Andean soils. Measuring longer-term effects of RP, soluble P and P-enhanced residues is essential in future research.
In addition, our OxC approach combining farmer categorization of soil fertility with soil characterizations drawn from soil science demonstrates a productive way to engage with smallholder management contexts. Farmer fertility categorization of sites was important, though not conclusive, in understanding P responsiveness of sites. Light textured soils where our experiment predicts benefits from P fertilization are designated locally in Quechua as thiu jallp'as (sandy soils) or challa jallp'as (shaly soils with abundant rock fragments) and farmers consider these soils to be well suited for legumes. Soil science-based measurement could thus be aligned with farmer categorization to identify sites alongside farmers with the best potential for P addition (e.g. by asking farmers for textural descriptions of candidate soils). Sites with relatively low pH, low soil inorganic P and site factors (pH, soil parent material, texture) partially linked to local terminology and predictive of low Ca-P in soils are the best candidates for RP impact (Figure 6).
More generally, OxC efforts are likely to benefit from considering the ethno-ecological corpus (repertory of knowledge) and praxis (practical or operational knowledge) of both farmer practitioners and social, crop, ecosystem and soil scientists (Toledo, Reference Toledo, Stepp, Wyndham and Zarger2002). This paper shows how OxC research can utilize both farmer soil taxonomies and tacit knowledge (what gets seeded in which soils, management and livelihood strategies, other farmer observations) and scientific theoretical frameworks (e.g. models of plant nutrient limitation, AM and rhizobial symbiotic response, soil-nutrient interactions) and scientific praxis (soil characterization of pH, SOM, statistical methods; Figure 7). Drawing on a range of epistemologies will allow better communication between scientific researchers and farmer practitioners regarding promising strategies that involve both conspicuous (e.g. plant growth) and unseen (e.g. soil P fractions, residue quality, mycorrhizae) features of technological options and field contexts.

Figure 7. Schematic diagram of proposed integration between farmer and scientific knowledge in OxC research and multi-environment trials. The socioecological niche is the concept developed by Ojiem et al. (Reference Ojiem, De Ridder, Vanlauwe and Giller2006).
Acknowledgements
This research project was supported by Fulbright and Fulbright-Hays doctoral dissertation enhancements grants, as well as by generous support by the McKnight Collaborative Crop research program. We thank Ann Piombino, the staff of World Neighbors Bolivia, and graduate student colleagues in the departments of Horticulture and Soil and Crop Science at Cornell University, for generous assistance in conducting the research and useful insights about local soils knowledge systems. We also thank several anonymous reviewers for contributing important corrections and new insights to the final version of the paper.
SUPPLEMENTARY MATERIALS
To view supplementary material for this article, please visit http://dx.doi.org/10.1017/S0014479716000478.


 Open access