


Introduction
Solar radiation drives hydrological and biological systems. Visible light occupies a narrow waveband within short-wave radiation (SWR) between 400 and 700 nm, and it is referred to as photosynthetically active radiation (PAR) because photoautotrophs harness this energy for primary production (McCree Reference McCree, Lange, Nobel, Osmond and Ziegler1981). The total amount of PAR that reaches the Earth's surface is modulated by complex interactions with the atmosphere, which absorbs or scatters this energy. Understanding the spatial variability of incoming radiation that is available for photosynthesis is critical to developing accurate models for net primary productivity (NPP), surface hydrology and climatology (Mizoguchi et al. Reference Mizoguchi, Yasuda, Ohtani, Watanabe, Kominami and Yamanoi2013).
Polar regions receive 24 h of sunlight during the summer and experience complete darkness during the winter, and annually receive significantly less solar energy than the equator. It is, however, equally important to note that on daily timescales, the greatest amount of solar radiation is received at the poles during the summer solstice. Less annual solar energy allows for cold temperatures (more freezing degree-days) and some lakes to maintain an ice cover through much of the summer. The McMurdo Dry Valleys (MDVs) of Antarctica are of particular interest because year-round liquid water in perennially ice-covered lakes provides an oasis for life in one of the harshest environments on the planet (Fountain et al. Reference Fountain, Lyons, Burkins, Dana, Doran and Lewis1999). Current sampling of lake biology is restricted to a few locations per season due to lake ice cover and the availability of time and resources in the field. Present interpretations of these samples assume spatial homogeneity of biological processes across each lake (Hawes et al. Reference Hawes, Giles and Doran2014, Obryk et al. Reference Obryk, Doran and Priscu2014).
The McMurdo Long-Term Ecological Research (MCM LTER) project maintains an array of automated weather stations (AWSs) distributed across various landscape units such as glacier surfaces, lakeshores and soil-sampling locations. Automated weather station-measured climate variables (soil and air temperatures, downwelling and upwelling radiation and wind speed, among others) span several decades (Doran et al. Reference Doran, McKay, Clow, Dana, Fountain and Nylen2002).
Few studies have focused on implementing topographical spatial analysis in the MDVs in order to understand their broad environmental conditions. Dana et al. (Reference Dana, Wharton and Fountain1996) used SWR data, collected across Taylor, Wright and Victoria valleys, to develop a topographical radiation model (TRM) that mapped solar flux in the MDVs on monthly timescales. The TRM calculated global total radiation as the sum of direct, diffuse and reflected irradiance (Dubayah & Rich Reference Dubayah and Rich1995). Total surface SWR on the horizontal lake surfaces of the valley bottom was dependent on sky view factor (SVF; the percentage of the celestial dome that is unobstructed by local topography) (Dana et al. Reference Dana, Wharton and Dubayah1998). Modelled results show a north-to-south gradient of downwelling SWR. We improve upon the results presented in Dana et al. (Reference Dana, Wharton and Dubayah1998) by increasing the spatial resolution and converting from SWR to PAR in order to improve estimates of NPP. This also allows for the incorporation of cloud cover (CC) for the extrapolation of measured radiation. This study utilizes a higher-resolution digital elevation model (DEM; 30 m). The TRM used a 50 km × 50 km DEM and digitized 30 m contour lines.
The Topographic Solar Photosynthetically Active Radiation (T-sPAR) toolbox is modified from existing ArcMap solar radiation toolboxes that were originally developed from Dubayah & Rich (Reference Dubayah and Rich1995). It is a geographical information system (GIS)-based application of a physically based geometric solar radiation model (ESRI 2015). At each point, it accounts for upward-looking viewshed, aspect, elevation and atmospheric conditions (Fu & Rich Reference Fu and Rich2000). The T-sPAR toolbox improves upon current toolboxes by outputting PAR rather than SWR, which allows for better estimates of primary productivity. In addition, the toolbox allows for CC correction. The existing toolbox has been used in order to model radiation in the Quartermain Mountains of the MDVs (Lacelle et al. Reference Lacelle, Lapalme, Davila, Pollard, Marinova and Heldmann2016). Lacelle et al. (Reference Lacelle, Lapalme, Davila, Pollard, Marinova and Heldmann2016) found that the toolbox systematically underestimated SWR, but correlated well with observations. We suggest that improvements could be made by increasing the input transmittivity from 0.6 to 0.7, which we find is more appropriate for the MDVs.
Study area: the MDVs
Located on the western shore of the Ross Sea, the MDVs have an ice free area of ~4500 km2, making them the single largest area that is free of ice and snow in Antarctica (Fig. 1) (Levy Reference Levy2013). Local topography is typical of glacially carved valleys. Elevation ranges from a few metres above sea level along the valley floors to over 3000 m for the peaks. The summer months of December, January and February receive continuous sunlight equivalent to levels received along the equator (Dhaulakhandi et al. Reference Dhaulakhandi, Joshi and Joshi1993). Valley bottom mean annual air temperatures range from -22°C to -18°C (Doran et al. Reference Doran, McKay, Clow, Dana, Fountain and Nylen2002). The lower albedo of the rocky surface causes warmer summer temperatures in the MDVs compared to nearby areas covered in ice (Chinn Reference Chinn1993). Surface soil temperatures have been observed to reach ~10°C along the valley floor throughout the MDVs (Doran et al. Reference Doran, McKay, Fountain, Nylen, McKnight and Jaros2008). Annual totals for snowfall range between 3 and 50 mm of water equivalent (Fountain et al. Reference Fountain, Nylen, Monaghan, Besagic and Bromwich2010) and are less than the evaporation potential in the area, making it a cold desert (Bromley Reference Bromley1986).
Location of the MDVs and the area of study.

Methods
The T-sPAR model was developed using three primary data sources: 1) long-term meteorological data, 2) field surveys of surface PAR and 3) a 30 m DEM. Long-term AWS data are used to derive the conversion factor from SWR to PAR. Statistical analysis of AWS radiation measurements was used in order to estimate maximum potential PAR at each location. Maximum potential PAR was compared with recorded PAR in order to develop a model for estimating CC. Point ground-truth measurements taken during the 2014–15 and 2015–16 field seasons were used to quantify the contribution of the skylight fraction to the global total and to evaluate the model sensitivity to rapid topographical shading. The 30 m DEM was the primary T-sPAR input for estimating maximum potential surface PAR under ‘cloudless’ conditions. Outputs were then validated against measured PAR, correcting for CC using inverse distance weighting (IDW) (Csatho et al. Reference Csatho, Schenk, Krabill, Wilson, Lyons and McKenzie2005).
Meteorological record
The PAR data were collected between 1996 and 2015, sampled every 30 s and recorded as 15 min averages from four weather stations in Taylor Valley: Lake Bonney (BOYM), Explorer's Cove (EXEM, records span 1997–2015), Lake Fryxell (FRLM) and Lake Hoare (HOEM). The stations record PAR as instantaneous values given in μmol photon m-2 s-1. The PAR was measured using LI-COR model LI-190 Quantum Sensors. The stations simultaneously measure SWR using either Eppley PSP or LI-COR LI-200 pyranometers. Data are recorded and stored by Campbell Scientific CR10x data loggers and are accessible from the MCM LTER website (http://mcm.lternet.edu).
Anomalous data are removed by comparing values from the same calendar day and separated into years defined from 22 June to 21 June of the following year, coincident with the winter solstice. First light is observed in the valley on 9 August based on PAR flux ≥ 1 μmol photon m-2 s-1 for a minimum of 1 h over 24 h. Last light is observed on 4 May by the same criterion. Values between last and first light were set to zero. Daily flux is derived from integrating 15 min averages of flux rate.
We derive a locally estimated scatterplot smoothing (LOESS) curve for each station from daily observed minimum, mean and maximum fluxes at each station. The fit at x is made from nearby points as a function of the distance from x (Cleveland & Devlin Reference Cleveland and Devlin1988). A smoothing parameter α controls the number of data points included in the estimate (α > 1 produces smoother fits while α < 1 conforms more closely to the data) (Cleveland & Devlin Reference Cleveland and Devlin1988). The LOESS curves represent the smoothed average of the daily observations over the whole record. They are interpreted as the potential maximum daily PAR under ‘cloudless’ conditions and are used in order to validate T-sPAR estimates.
Daily changes in CC are approximated by the change in atmospheric transmittivity over time. High transmittivity is positively correlated with PAR and SWR and negatively correlated with CC. The LOESS best fit curve for maximum total daily PAR is assumed to be equal to 0% CC. Deviation below the maximum total daily PAR is attributed to increased CC. Daily CC was calculated as a percentage using Eq. (1):
 $$\eqalign{& {\rm CC\;} = {\rm \;}\left[{1-\left({\displaystyle{{Measured{\rm \;}total{\rm \;}daily{\rm \;}PAR} \over {Estimated{\rm \;}total{\rm \;}daily{\rm \;}PAR}}} \right)} \right]{\rm \;} \times k \cr &{\rm CC} \gt 1 = 1 \,\,{\rm and}\,\, {\rm CC} \lt 0 = 0} $$
where k is a constant fit to the data and used to constrain CC values between 0 and 1. A value of 1 equates to overcast conditions persisting for all or most of the day, while a value of 0 indicates sustained clear conditions. Intermediate values indicate scattered CC throughout the day or high CC during peak radiation hours transitioning to clear conditions during off-peak hours. Estimation of daily CC relies on the sum of daily measured PAR. Only records with all daily observations were included in this analysis. Records with fewer daily observations would be biased towards lower sums and inaccurately identified as days of high CC. Values outside of the CC limits of 0–1 are possible, as the optical thickness of cloud coverage can still vary within completely overcast days. Conversely, diffuse radiation concentration under scattered cloud conditions can result in measured values that exceed the estimated total daily value (Orgill & Hollands Reference Orgill and Hollands1977). For this analysis, values < 0 were set to 0, and values > 1 were set to 1.
Seven overcast days were examined in order to identify the effect of heavy CC on total daily PAR and to establish a k value. These dates had confirmed snow events or overcast conditions over a 24 h period. Incoming and outgoing SWR values were cross-referenced in order to confirm that the decrease in daily values was not caused by snow obstructing the sensor. The k value is derived from Eq. (1) based on observed 100% CC and the fraction of measured PAR out of the LOESS-derived maximum potential PAR.
Field surveys
We utilize diurnal topographical shading in order to measure the skylight contribution to global total radiation so as to evaluate T-sPAR parameters as well as to assess the spatial and temporal accuracy of the toolbox over small spatial and time scales. The skylight contribution was measured at HOEM and FRLM. The PAR flux at HOEM is typically less than at FRLM due to the reduced sky view. We scale the PAR flux recorded at the stations to match between 30 December 2013 and 6 January 2014 in order to approximate the background radiation with no topographical shading.
Ground-truth measurements of surface PAR in Taylor Valley were recorded between October and December of the 2015–16 field season using Onset HOBO pendant light sensors and LI-190 Quantum Sensors. HOBO light sensors are not cosine-corrected, so first we tested their accuracy in order to determine whether they could be used in other field surveys. Toolbox accuracy was determined from a field survey at Lake Hoare (LH), which experiences the most extreme topographical shading.
The period between 30 December 2013 and 6 January 2014 was examined in order to evaluate the contribution of diffuse and reflected radiation to global radiation. These dates were chosen based on cloudless conditions and equivalent daily maximum PAR at both HOEM and FRLM. During this time of year, local topography shadows HOEM between 16h00 and 16h30, while FRLM remains in direct sunlight. Measured values at FRLM represent global total surface radiation, while HOEM lacks the incident fraction due to topographical obstruction.
The experiment to evaluate HOBO sensor accuracy was set up at Lake Bonney (LB). The goal was to verify that under equal conditions all sensors measured flux in a reliable and predictable way. All sensors were set up with the same aspect, next to each other on a north-facing slope. A LI-COR LI-190 Quantum Sensor was placed in the centre, with five HOBO sensors on each side, and they were set to record for a period of 1 week. The magnitude recorded by the HOBO sensors was inaccurate, but the HOBO sensors reliably provided a qualitative measure of increasing or decreasing radiation. Long et al. (Reference Long, Rheuban, Berg and Zieman2012) simultaneously collected 15 min data from both HOBO pendants and LI-COR Quantum Sensors in both laboratory and field settings. They found no lag in the timing of the sensor response and only minor disagreement in the magnitude at ~27°N and 42°N. We therefore used the HOBO sensors in order to assess the toolbox's accuracy in predicting the timing of topographical shading at various locations.
Ten Onset HOBO pendant light sensors were deployed across Taylor Valley's three major lakes for a period of 1 week. Data were also simultaneously collected with the Quantum Sensor and LI-1400 data logger. The Quantum Sensor and a HOBO sensor were set beside the local AWS for the duration of the sample period as reference controls. HOBO sensors measured every 15 min, while the LI-1400 data logger sampled every 5 min and logged the mean every 15 min (this routine was tested and found to be in close agreement with meteorological data). Sample locations for the HOBO sensors were chosen in order to maximize the network's spatial distribution. Measurements were taken on the lake's surface and lakeshore at points with unique topographical characteristics such as diurnal topographical shading, free of shade when other locations are shaded or of uncommon surface ablation. EXEM was included as a reference station due to its isolation from any major ice-covered lakes or glaciers in order to minimize the effect of highly reflective surfaces. Located ~5 km east–north-east of Lake Fryxell (LF) and ~3 km west of McMurdo Sound, EXEM occupies one of the widest points in Taylor Valley and receives the least amount of topographical shading.
An additional topographical shading experiment was conducted on 11 December 2014 on a clear sunny day along a transect that transitioned from full sunlight into shade on the north-east shore of LH. At this time of year, the basin becomes shaded between 18h50 and 20h00 by the Asgard Range to the north-west. Flux measurements were taken using the Quantum Sensor, beginning under full incident radiation and transitioning to shade. Measurements were taken perpendicular to the umbral horizon (boundary of the topographical shadow) in order to evaluate the accuracy of T-sPAR over smaller spatial and time scales. Measurements were also taken in the shade of large boulders under incident and shaded conditions in order to evaluate the effect of limited sky view area.
T-sPAR toolbox development
Area and Point T-sPAR toolboxes were developed from pre-existing ArcMap Solar Radiation toolboxes and optimized for Taylor Valley. Atmospheric transmittivity and diffusivity have been modified to reflect the increased atmospheric transmittivity in Antarctica. The DEM is built into the toolbox. The only information that needs to be supplied by the user is a time configuration, CC values and, in the case of Point T-sPAR, the location where PAR is to be calculated.
The 30 m DEM in this study uses the Projected Coordinate System WGS 1984 Lambert Conformal Conic and has an elevation range of 0–3199 m and a total area of 10 017 km2 (Csatho et al. Reference Csatho, Schenk, Krabill, Wilson, Lyons and McKenzie2005). The DEM and shapefiles for AWS locations and lake outlines are available from the MCM LTER data repository (http://mcm.lternet.edu/power-search/data-set). Files were processed using ArcGIS v10.3.0.4322 with Spatial Analyst. An area of interest of 673 km2 was created from the DEM using the basin limits model (http://mcm.lternet.edu/power-search/data-set). Lake surface area was updated using a Landsat 8 image taken on 19 December 2014 (https://libra.developmentseed.org, LC80561162014353LGN00, accessed 1 January 2015). Updated shapefiles had a new surface area of 6.820 km2 for LF, 2.270 km2 for LH (which now includes Lake Chad) and 4.533 km2 for LB.
First, T-sPAR outputs were calculated using ArcMap's Point Solar Radiation tool (Point T-sPAR) and the Area Solar Radiation tool (Area T-sPAR). Estimates were limited between 20 August and 23 April due to the software's limitations in modelling surface radiation correctly at angles < 10° above the horizon (ESRI 2015). Low solar angles cause diffuse radiation to contribute a greater fraction of global radiation at the expense of decreased transmittivity. We minimized differences in input computational parameters when comparing Point T-sPAR and Area T-sPAR estimates (Table I). A ‘sky size/resolution’ of 4000 was necessary for Point T-sPAR to resolve overlapping sun maps for periods with a high temporal resolution (< 24 h), and solstices were computed using the ‘special day’ time configuration (ESRI 2015).
T-sPAR computation parameters used to estimate surface PAR by point and area for the Taylor Valley basin.

AOI = area of interest, JD = Julian day, TV = Taylor Valley.
Atmospheric transmittivity and diffuse components were optimized for Taylor Valley by comparing LOESS curves with T-sPAR outputs in order to identify the Point T-sPAR parameters that predicted actual observations with the greatest fidelity. The diffuse component (D) was varied between 0.2 and 0.4 based on the measured diffuse fraction (1.0 = 100% of global radiation). Transmittivity (T) was varied between 0.5 and 0.9. Adjustments of atmospheric values change surface estimates by orders of magnitude. Outputs are converted from SWR to PAR using a conversion factor of 0.383 W m-2 per 1 μmol photon m-2 s-1 based on the average PAR fraction recorded across all stations from October through March of the entire record. The root mean square deviance (RMSD) between LOESS values and Point T-sPAR outputs was calculated for each iteration. The parameters that generated the smallest RMSD values were used to calculate Area T-sPAR over 2 week periods.
Results
Estimating cloud-free surface PAR
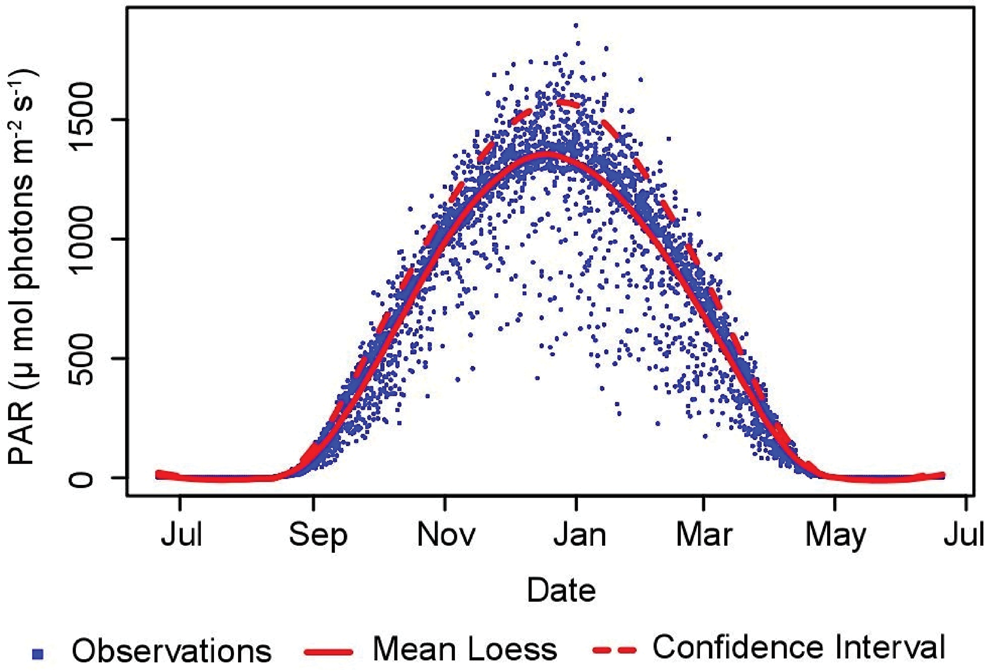
A LOESS curve with a value of μ + 1σ for maximum daily flux observations was chosen to represent the absolute potential maximum daily flux. This value includes 84% of daily maximum observations over the entire record (Fig. 2). A value of α = 0.25 generated curves that best described the maximum daily flux for all calendar days. The optimized parameters accurately predict PAR flux values of > ~1600 μmol photons m-2 s-1 during the summer solstice of the 2014–15 field season; however, these values are up to ~250 μmol photons m-2 s-1 higher than best-fit mean LOESS curve values for all years included in this study. Larger LOESS σ and α values overestimated daily maximums at the beginning and end the season, but better predicted PAR flux near (± 14 days) the summer solstice.
Mean LOESS best-fit curve for daily maximums observed at EXEM. One standard deviation above the best-fit curve includes 84% of all observations. This confidence interval curve was chosen in order to represent the absolute maximum potential surface PAR for that station.
Surface PAR flux is comparable for all stations during the peak of the summer (Table II). BOYM has the largest range in expected daily values (1262 μmol photons m-2 s-1) and receives the lowest total daily PAR (65.34 mol photons m2), although only 7.39 mol photons m2 less than EXEM, which receives the highest total daily PAR. The envelopes for FRLM and EXEM are most similar to each other (1194 and 1157 μmol photons m-2 s-1), and both receive intermediate amounts of surface PAR over the course of the season compared to other stations. HOEM absolute maximum, mean maximum and mean average surface PAR values are the lowest with respect to all other AWS included in this study (Table II), which is consistent with heavy daily topographical shading in the narrow valley. Daily maximum surface PAR flux values of 500 μmol photons m-2 s-1 are recorded at all stations by October, and they double to 1000 μmol photons m-2 s-1 by November. Values > 1500 μmol photons m-2 s-1 are observed from late November through mid-January. Daily values drop to < 1000 μmol photons m-2 s-1 by late February and to < 500 μmol photons m-2 s-1 by mid-March.
Expected total daily and total seasonal PAR flux for the summer solstice calculated from data averages recorded between 1996 and 2015 by meteorological location.

Modelled CC in the MDVs
The PAR flux vales recorded by the AWS were compared to the expected daily values based on the LOESS curve (Table III). Observed overcast days suggest that a 50% decrease in daily PAR flux equals 100% CC. One exception highlights the inefficiency of this method in capturing brief cloudy periods during low background radiation. On 23 October 2015, it began to snow in the evening after peak radiation hours. Close examination of the FRLM record shows little difference compared to a cloud-free day. The only signal that is appreciable in the record is lower than expected values during the ‘night-time’ hours, when solar angles are lowest and PAR values are inherently low. This event highlights the difficulty in identifying cloud coverage when solar elevation is low.
Measured total daily PAR (mol photons m-2) versus expected total daily PAR for days with heavy CC and snow.

Cloud cover values were used to bin overcast conditions into four categories: clear (0 to < 0.2), scattered (0.2 to < 0.5), broken (0.5 to < 0.8) and overcast (0.8 to < 1.0). Frequency statistics were calculated for each year along with a seasonal total by meteorological station (Table IV). Monthly totals show that cloudiness is typically greatest at EXEM meteorological station, at the eastern end of Taylor Valley. This location has the highest incidence of both overcast and broken cloud conditions, accounting for up to 32% of all observations during a season. Clear conditions, on the other hand, are most common at the western end of Taylor Valley near BOYM meteorological station.
Summary statistics for seasonal cloud coverage near meteorological station based on PAR data.

The frequency of modelled observations was aggregated by month in order to determine whether atmospheric patterns concentrate at specific times during the summer (Fig. 3). The results show that cloud-free, clear days predominate across Taylor Valley for most of the summer, with a slight decrease in frequency as the summer progresses. The change in frequency appears well correlated between observations at BOYM, EXEM and FRLM meteorological stations, with all three stations reaching a peak during the month of February. HOEM is the only station that shows a distinct increase in overcast conditions around the summer solstice.
Frequency of daily CC by meteorological station. Total observations are aggregated by month and displayed as a percentage of the monthly total. Only ‘clear’ (dashed lines) and ‘overcast’ (solid lines) conditions are shown in order to improve readability.

Measured diffusivity
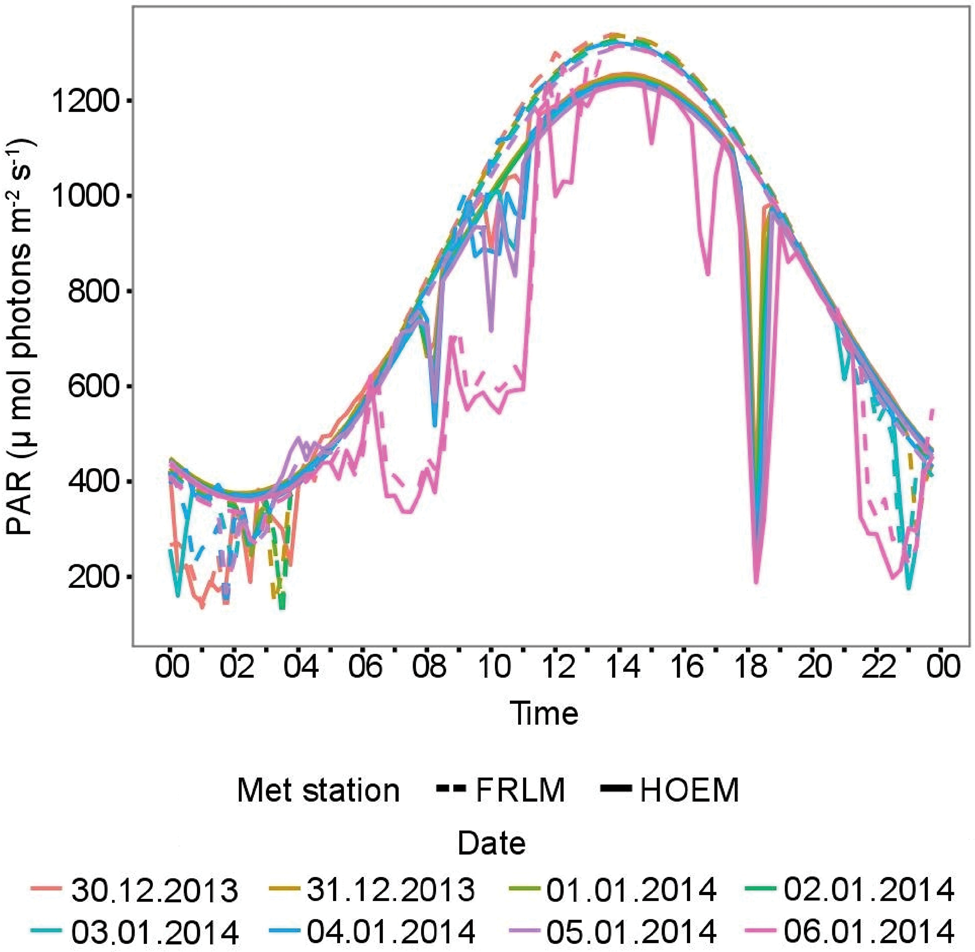
The PAR flux measured at FRLM and HOEM between 30 December 2013 and 6 January 2014 was analysed in order to estimate the contribution of skylight radiation at HOEM (Fig. 4). Scaling FRLM for this interval to match HOEM yields a predicted mean PAR flux at FRLM of ~941 μmol photons m-2 s-1, while the average flux in full topographical shade is ~247 μmol photons m-2 s-1. The PAR flux under shade conditions relative to full sun conditions represents an incident fraction of 74% and a skylight fraction of 26% for FRLM. The fraction of incident light at FRLM is greater than at HOEM. At HOEM, the mean unshaded value was ~946 μmol photons m-2 s-1 versus the mean shaded value of ~144 μmol photons m-2 s-1, which represents an incident contribution of 85% and a skylight contribution of 15% to the total global value.
PAR measured at FRLM and HOEM between 30 December 2013 and 6 January 2014. At this time of year, HOEM is shaded daily at approximately 18h00 by local topography. The plot shows that the diffuse component of PAR measured at HOEM at 18h15 is ~26% of the value measured at FRLM.
T-sPAR toolbox development
First, Point T-sPAR parameters of diffusivity (D) and transmittivity (T) were tested in order to optimize the fit to LOESS curves for all four AWS. Optimal diffusivity and transmittivity were chosen based on lowest RMSD. Higher transmittivity and diffusivity inherently increase PAR estimates. ArcMap default parameters of D = 0.3 and T = 0.5 predict total annual surface PAR to be highest at BOYM. Across all stations in Taylor Valley, D = 0.3 and T = 0.7 yielded the minimal average daily error of 0.5 mol photons m-2 or ~2.5% of the average daily PAR at any one station (Fig. 5). During the solstice, these parameters predict higher PAR at BOYM than FRLM by ~4 mol photons m-2 day-1, but increasing the transmittivity reduces the error surrounding the solstice by ~15 mol photons m-2 day-1. Transmittivity values of > 0.7 for 0.2 < D < 0.4 result in the toolbox overestimating incident radiation by 16–55 mol photons m-2 day-1 during peak radiation. Transmittivity values of < 0.7 under the same diffusivity conditions result in an underestimation of incident radiation by 5–27 mol photons m-2 day-1. Transmittivity varies on larger spatial scales than diffusivity, and this is evident in the optimum parameter for each AWS. While T = 0.7 produces the least error for all stations, the optimum diffusivity varies at the basin scale.
Daily T-sPAR error estimated from LOESS best-fit curves for each station at various diffusivity and transmittivity values, indicated in the top and right margins.

For T = 0.7, a value of D = 0.3 minimizes the mean error at both FRLM and EXEM (0.2 and 0.7 mol photons m-2 day-1, respectively), which, due to their proximity and location in the same basin, have a similar, larger SVF than HOEM and BOYM, which are in the narrower portion of Taylor Valley. During the spring and autumn, T-sPAR under-predicts PAR by ~2 mol photons m-2 day-1 on average. From November through February, the error gradually ramps up from 0 to only 4 mol photons m-2 day-1. During this time, PAR is over-predicted at HOEM by 12 mol photons m-2 day-1. It is under-predicted at BOYM by 7.5 mol photons m-2 day-1 on average (~25% cumulative error). FRLM and EXEM are only under-predicted by 2.5 mol photons m-2 day-1 (6.8% cumulative error). At BOYM, we see a variability in the toolbox accuracy with sun elevation, although the magnitude of the error is approximately double that of HOEM and FRLM. A value of 0.2 < D < 0.3 would probably reduce the error at BOYM. Reducing the diffuse component from 0.3 to 0.2 reduces the toolbox error at HOEM from 3.8 to 0.6 mol photons m-2 day-1. Lower diffusivity values are also in closer agreement with field observations.
We attribute the error in September and April to the toolbox inaccuracy at predicting radiation when solar angles are low due to the increased sensitivity to small fluctuations in atmospheric conditions owing to the increased ray path. There is also a larger PAR fraction of SWR, and the conversion factor from SWR to PAR is probably higher both before October and after March.
Testing T-sPAR outputs
The toolbox predicts the highest annual surface PAR at EXEM (8490 mol photons m-2) and lowest annual surface PAR at HOEM (7375 mol photons m-2). A period of three consecutive days with clear atmospheric conditions was chosen from each basin sample run in order to compare daily AWS, Quantum Sensor and HOBO pendant measurements, corresponding to 25–27 October 2015 for the LF, 9–11 November 2015 for the LH and 27–29 November 2015 for LB. Daily AWS and Quantum Sensor measurements for these intervals had similar diurnal envelopes of ~18 h depending on location and consistent daily maximums and minimums. Modelled results plotted against observed values match closely (± 50 μmol photons m-2 s-1), predicting large topographical shading events as evidenced by data collected in the LH basin (Fig. 6).
Surface PAR measured with HOBO sensors plotted against Point T-sPAR estimates.
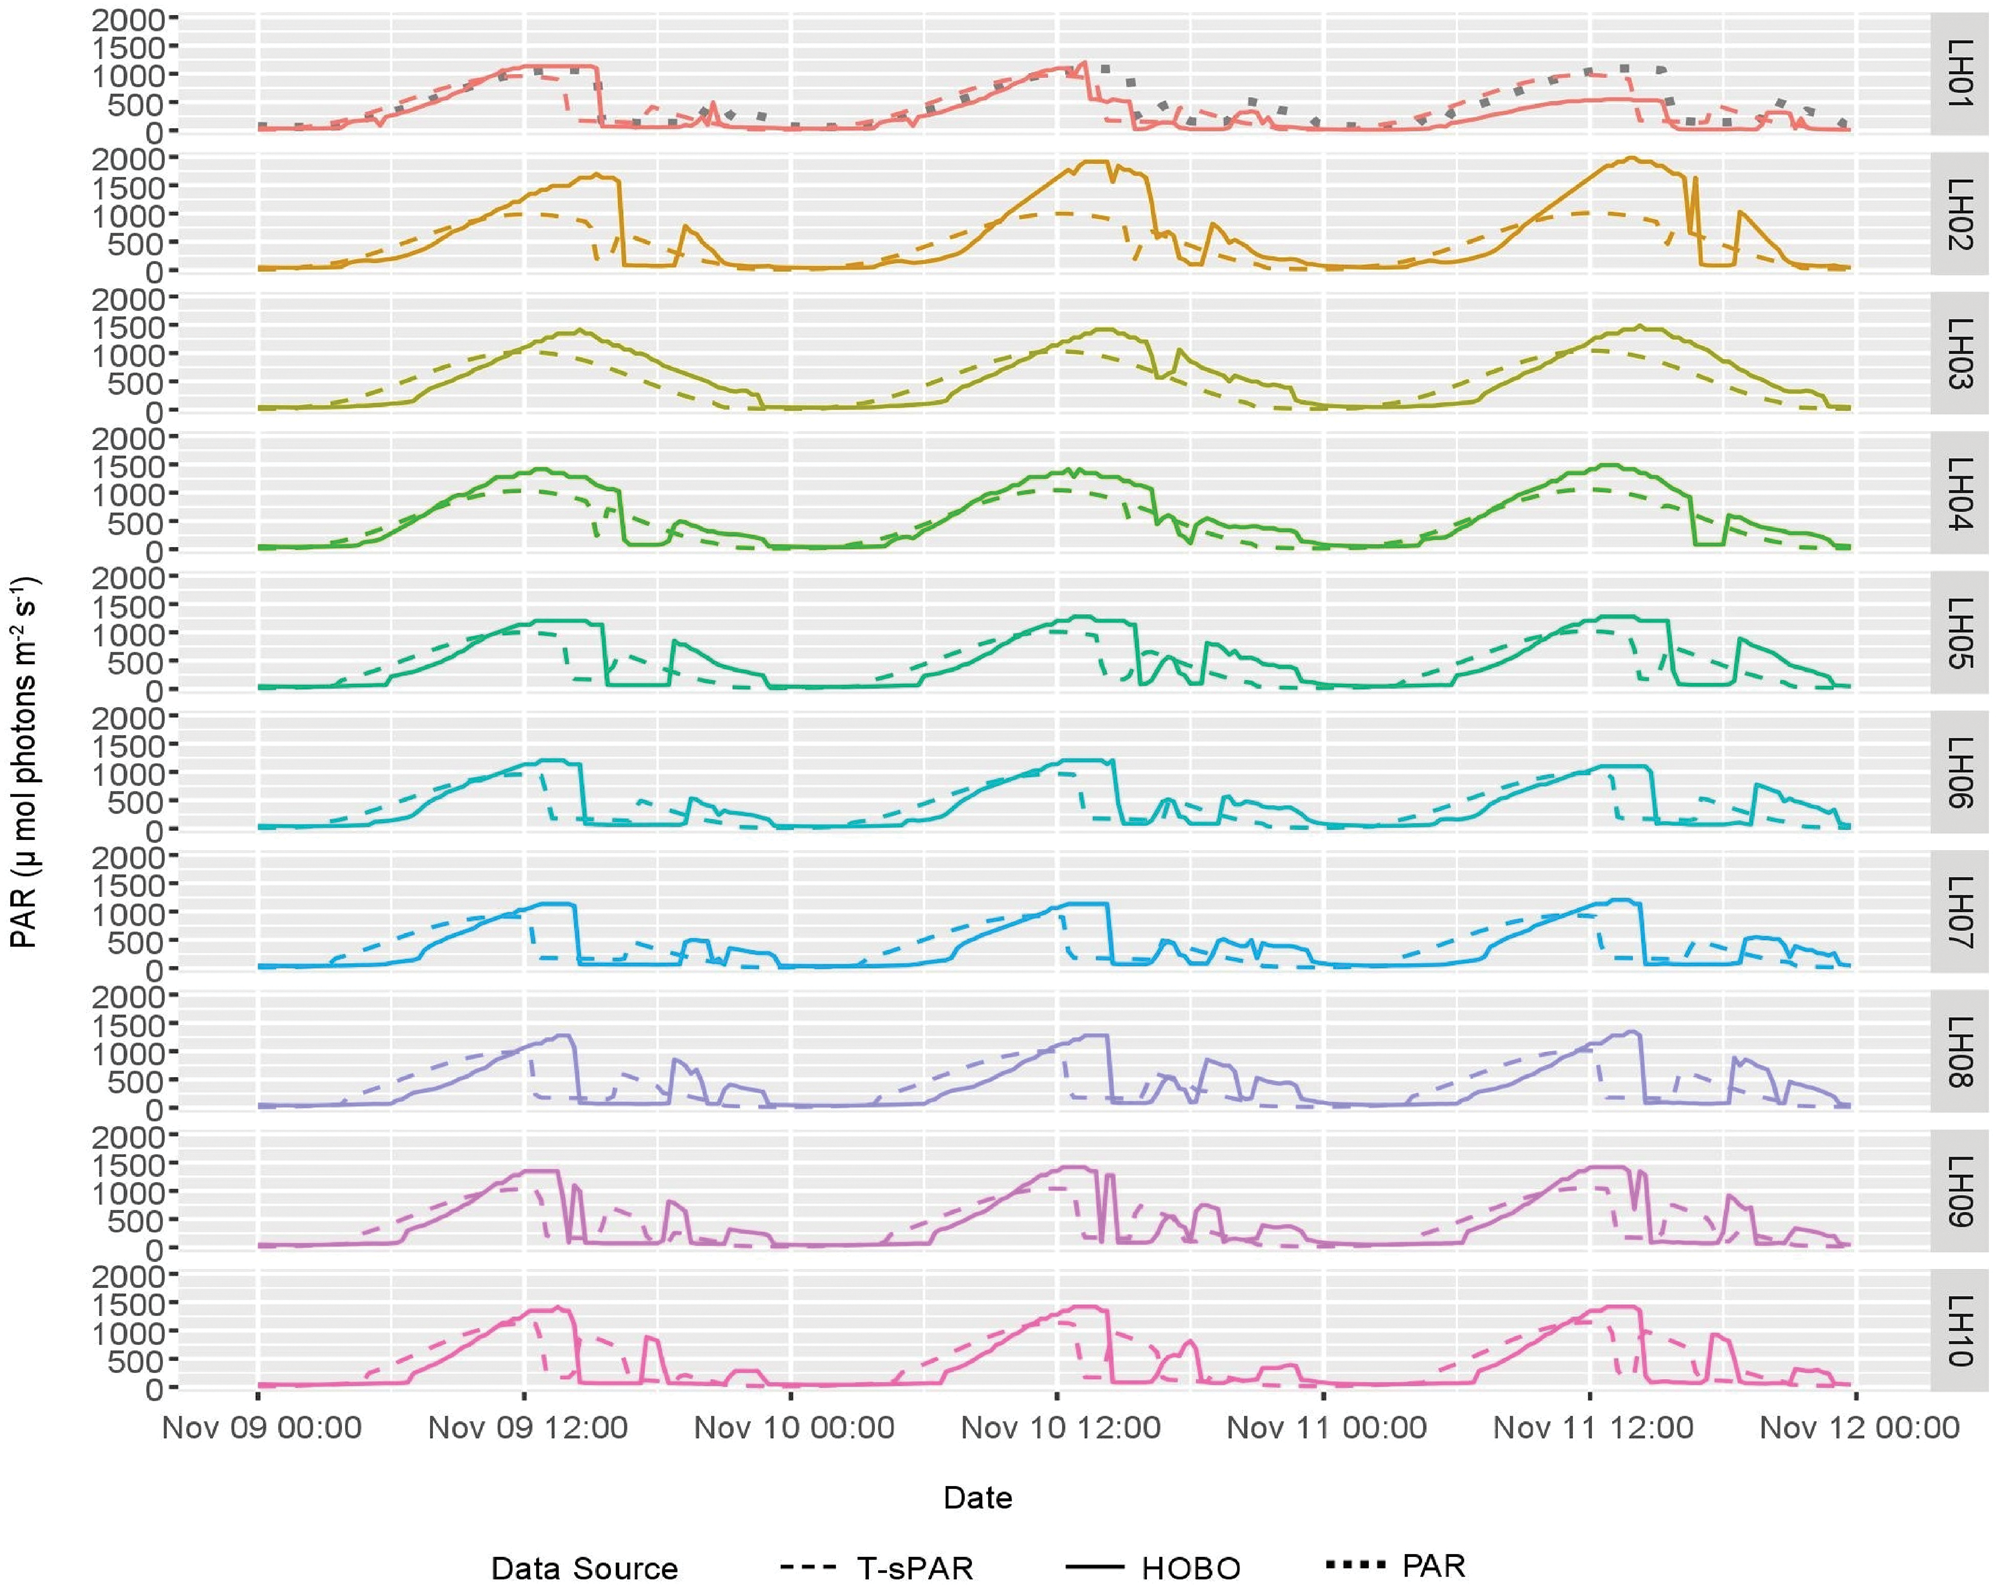
During the HOBO sensor calibration field experiment, sensors accurately responded to increasing or decreasing surface PAR, but the magnitude of their response was unpredictable. T-sPAR mostly under-predicted PAR, sometimes by as much as 750 μmol photons m-2 s-1. T-sPAR predictions rarely exceeded AWS measurements by ~100 μmol photons m-2 s-1 on average. A comparison of T-sPAR modelled sensor locations versus recorded observations shows a shallowing of the trough created by topographical shading by ~10 μmol photons m-2 s-1 over 2 days as the solar elevation increases from day to day (Fig. 6). The cause of the difference between estimated and observed values is their temporal synchronization. The model responds to shadowing before the actual observation by ~3 h. This is an artefact of the spatial resolution of the DEM combined with the sky view resolution and ArcMap's sun position algorithm. At a resolution of 30 m, shadows will be estimated to be present over areas both before and after they are physically present. A small error in the sun position algorithm will predict a location that is off by a few degrees, which will have an impact on modelled ray tracing within the DEM. A coarse resolution for the sky view will affect the sun position and subsequent ray tracing.
Although the magnitude of T-sPAR outputs cannot be validated from the HOBO surveys, HOBO measurements helped evaluate T-sPAR's ability to predict the timing of shading accurate to within a few hours (Fig. 6). When the magnitudes of hourly T-sPAR outputs are compared to hourly AWS data at HOEM (Fig. 6a), this reveals the accuracy in the magnitude of PAR flux at HOEM under extreme topographical shading.
Spatial and temporal variability in surface PAR
Once model parameters were validated, surface PAR for Taylor Valley for the summer was estimated from Area T-sPAR (Fig. 7). Areas of high elevation and north-facing slopes receive the greatest amounts of surface PAR, while south-facing slopes received the least total radiation. Annual values of > 10 000 mol photons m-2 are only found at the highest points along the ridgeline, where a high SVF allows for unobstructed incident radiation throughout the entire day and at the lowest solar angles. The south-facing slopes of the Asgard Range receive annual values of between 4000 and 6000 mol photons m-2. The western end of the LB and LH basins receive the most PAR. The north-facing slopes of the Kukri Hills generally receive annual values of 8000–10 000 mol photons m-2, and values increase from east to west. The annual PAR values on the valley floor range between 6000 and 8000 mol photons m-2, with the lowest parts of the valley receiving less PAR than higher ground.
Total annual surface PAR for the Taylor Valley basin estimated using the Area T-sPAR.

Total daily surface radiation appears to decline from east to west, suggesting a correlation with total width of the valley floor and height of the surrounding ridgeline. The largest daily totals were observed at EXEM at the height of summer, followed closely by FRLM, with comparable total daily values and only slightly higher totals for the entire season (Table II). Estimates for BOYM data show higher total seasonal values compared to HOEM. The PAR values at HOEM exceed BOYM by 2 mol photons m-2 day-1 for a few weeks prior to and following the summer solstice. During this period, daily solar elevation is great enough for the sun to remain above the Kukri Hills to the south of the LH basin. This contributes incident radiation to the area during the ‘evening’ hours at HOEM, while BOYM remains topographically shaded.
Additional surface PAR distribution maps were developed on bimonthly intervals for Taylor Valley using the Area T-sPAR model (Fig. 8). The model aggregates total daily surface PAR over the specified time interval and reports the daily average by dividing over the number of days in the interval (14 days for all maps, except for the summer solstice map, which includes 15 days). The complete set of maps for the summer is included as Supplementary Material. Maps were generated using two different scales. The seasonal scale illustrates the progression of surface PAR across Taylor Valley, providing context for the change observed over the summer. The interval scale distinguishes the small difference in the range of surface PAR that drives biological processes on the valley floor and within lake waters. These maps can be used by field parties to identify future sampling sites. The shorter timescales of these surface PAR estimates can also be correlated with indices of primary productivity and measurements of underwater PAR.
Bimonthly surface PAR distribution maps covering a 6 week period between 6 October and 16 November. Values are for the timespan's daily average, ending at 23h59.59 on the listed date. Maps use the same distance scale. The surface PAR scale is set to the range of values observed over the entire summer.

Application to NPP in Taylor Valley lakes
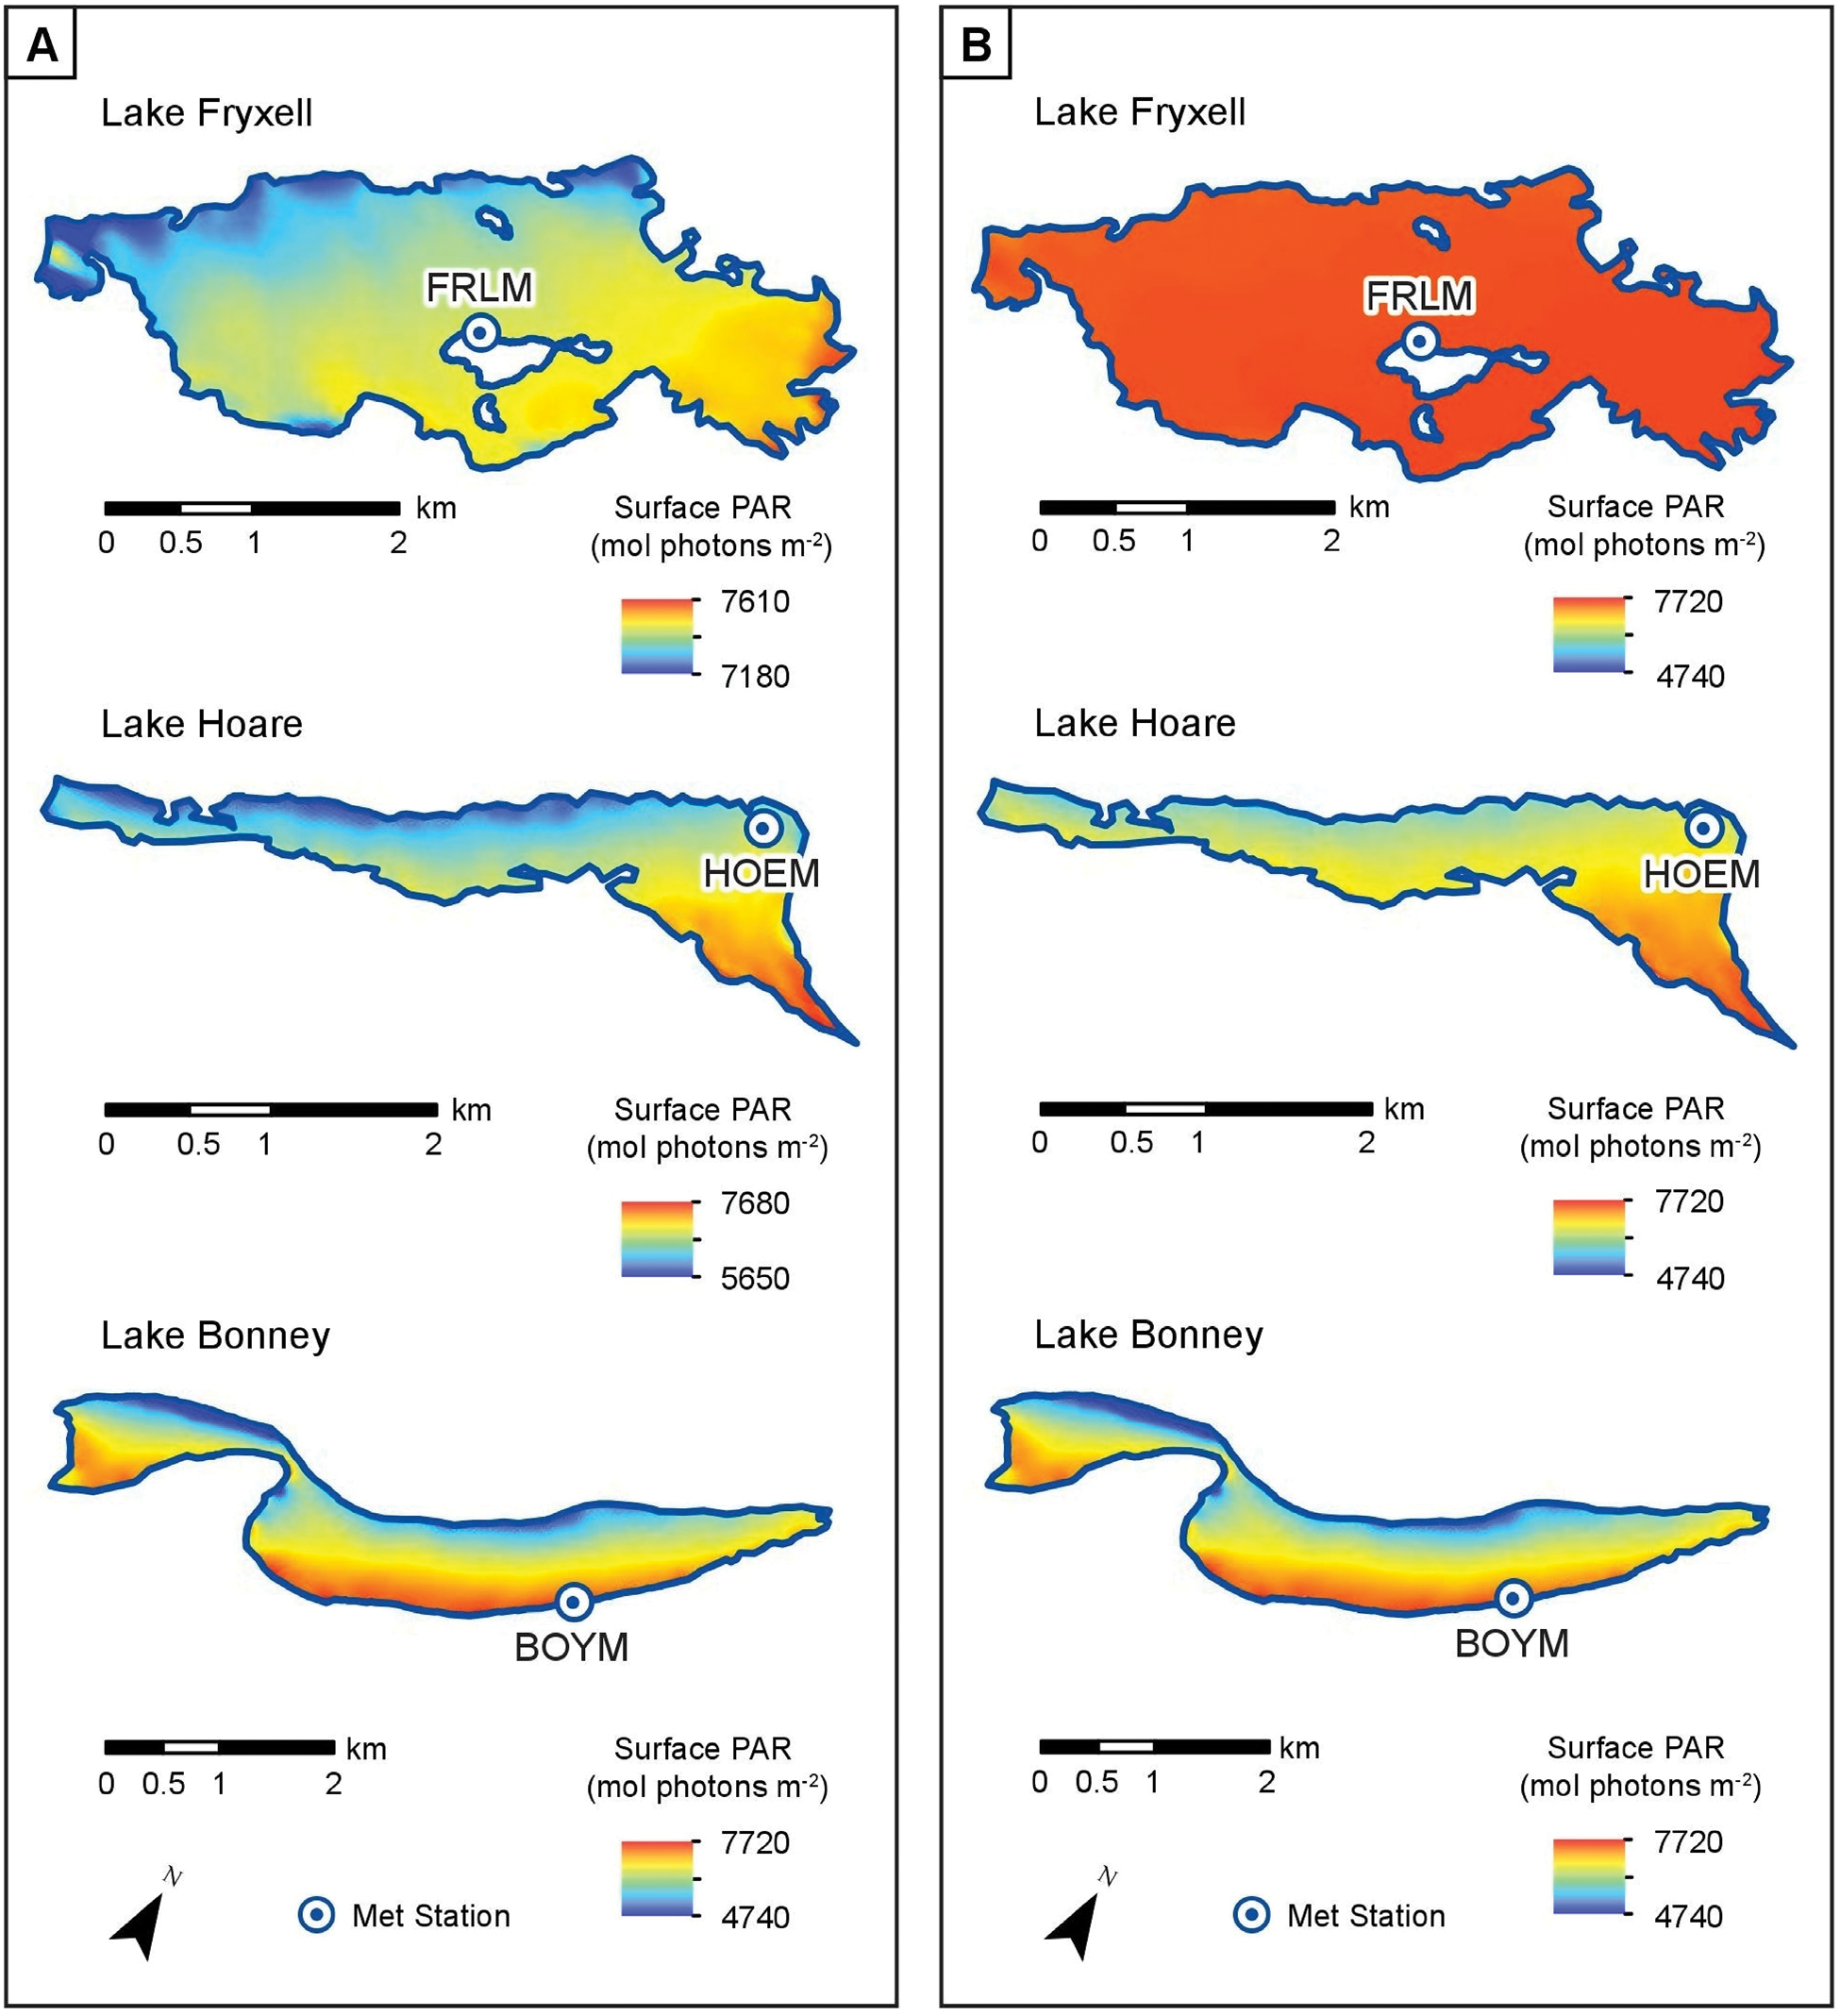
One potential use of the T-sPAR toolbox is to improve estimates of NPP in Taylor Valley. Area T-sPAR was used in order to calculate total incident PAR for Taylor Valley's lake surfaces and normalized by surface area to allow for comparison (Table V). The effects of annual topographical shading on each lake are evident in Taylor Valley's individual lake maps (Fig. 9). Lake Fryxell, which occupies the widest basin and is surrounded by the lowest ridgeline compared to the other lakes, is the only lake to receive annual values of between 7000 and 8000 mol photons m-2 across its entire surface, and overall annual surface PAR generally increases from west to east.
Total annual surface PAR by lake surface estimated using the Area T-sPAR. Lakeshore boundaries are set to 19 December 2014. Lake maps use various distance scales. a. Surface PAR scale set to range by lake surface. b. Surface PAR scale set to the shared range of all lake surfaces.
Summary statistics for total annual surface PAR estimated by Area T-sPAR.

Lakes Bonney and Hoare both about the southern slopes of the Asgard Range. As a result, topographical shading bisects the distribution of surface PAR for these two lakes between their northern and southern shores. Annual surface PAR on LB is approximately evenly split, with the northern edge of the lake receiving annual values of between 6000 and 7000 mol photons m-2, while the southern edge receives annual values of between 7000 and 8000 mol photons m-2. Most of LH's surface receives annual values of between 6000 and 7000 mol photons m-2 due to topographical shading from the west. Only the lake's easternmost edge receives annual values of between 7000 and 8000 mol photons m-2 (Fig. 9).
Discussion
Meteorological record
A best-fit LOESS curve was derived from the daily PAR flux for each meteorological station and used to calculate the limits of the upper 1 SD confidence interval. The estimated potential maximum daily flux under cloudless conditions was set above the maximum mean value because consistent cloudless conditions during solar noon are a statistical anomaly. Any degree of reduction in transmittivity at this time would result in values that are lower than the absolute maximum potential. The choice of μ + 1σ was based on apparent best fit for all stations without over-predicting observations. The outlying top 16% of observed maximum values are possible in unique circumstances where high albedo can concentrate diffuse radiation as described by Orgill & Hollands (Reference Orgill and Hollands1977).
The observed lower frequency of cloud-free days at the more coastal AWS when compared to more inland stations agrees with previous reports of the positive correlation between cloud coverage and proximity to the ocean (Doran et al. Reference Doran, McKay, Clow, Dana, Fountain and Nylen2002). As the CC model relies on the difference between measured and expected PAR, it is difficult to determine conclusively the accuracy of frequency estimates at the beginning and end of the summer (Fig. 3). The low availability of radiation during the fringe months makes the difference between overcast and clear days too small for sensors to discern. In addition, at such low solar angles, the sun may remain unobstructed by cloud coverage or illuminate clouds from beneath. Under these conditions, cloud coverage would contribute to an increase in surface radiation by reflecting incident radiation downwards. Given these considerations, it is recommended to limit conclusions only to estimates between October and March.
Toolbox parameters
The relative proximity of HOEM and FRLM (~6.6 km) ensures that cloudless conditions persisted at both locations, while each station was affected differently by topographical shading for the calculation of the diffuse component for each station. The optimal diffusivity parameter derived from T-sPAR was 0.3, which is higher than the measured values at both HOEM (0.15) and FRLM (0.26). The skylight fraction has an inverse relationship with wavelength (McKay et al. Reference McKay, Clow, Andersen and Wharton1994) and therefore an increase in the PAR fraction of total SWR would result in an increase in diffuse contribution as radiation is shifted to lower wavelengths.
The transmittivity parameter that yields the lowest error for Taylor Valley is 0.7. Average transmittivity for all stations was derived as the ratio of SWR exceeding 300 W m-2 measured at each AWS (representing bright sun conditions) and solar flux at the top of the atmosphere for the entire data set (Andersen et al. Reference Andersen, McKay and Lagun2015). The transmittivity derived from observations is 0.74, which is greater than that used in the T-sPAR toolbox. We suggest that this difference is due to differences in the calculation of observed transmittivity versus incident SWR derived from a model. The observed transmittivity represents both diffuse and direct radiation as a fraction of the solar flux at the top of the atmosphere. In the ArcMap toolbox, transmittivity is only applied to the direct component, which is then augmented by the diffuse component in order to derive total incident SWR.
The PAR fraction of SWR used in the toolbox (0.383 W m-2 per 1 μmol photons m-2 s-1) is lower than that observed by Clow et al. (Reference Clow, McKay, Simmons and Wharton1988) at LH (0.505 W m-2 per 1 μmol photons m-2 s-1) and by Stefan et al. (Reference Stefan, Cardoni, Schiebe and Cooper1983) in Minnesota (0.488 W m-2 per 1 μmol photons m-2 s-1). The fraction of PAR relative to SWR varies by location and time of year. The toolbox uses the average conversion from W m-2 to mol photons m-2 day-1 between October and March for all stations so that it is optimized during the field season and across the entire valley. During the transition to and from winter, we observe a higher fraction of PAR. Annual-scale variability in the conversion factor is probably attributable to the increased ray path and spectral transmission of the atmosphere. For FRLM, EXEM and BOYM, the lowest PAR fraction occurs near the solstice. HOEM, however, exhibits more asymmetry. It experiences a few brief increases in the conversion factor from approximately March through May and one occurring during the solstice. Daily variability in the conversion factor at HOEM explains the variability in the error.
Spatial variability in the conversion factor explains the magnitude of error. BOYM has the highest conversion factor and HOEM has the lowest. EXEM and FRLM both fall in the middle. Because the conversion factor used in the toolbox is the average for all stations, EXEM and FRLM are closest to the average and have the lowest error. Because HOEM has the lowest conversion factor of all stations, when the fraction of PAR increases to a value closer to the one used in the toolbox, the error decreases.
Topographical sensitivity
The trend in error at HOEM stands out from other stations, probably owing to its position nearer to extreme topography. Topography influences both the diffuse fraction as well as the conversion factor. The toolbox overestimates PAR during October and February, when the sun elevation is the same as the elevation of the surrounding topography for the majority of the day. Under optimum diffuse conditions for HOEM (Fig. 5), once the sun is above the surrounding peaks for the majority of the day, the error decreases again to almost zero. BOYM is also affected by sun elevations equal to the surrounding topography, but the sign is the opposite to that of LH. At BOYM, the toolbox actually underestimates PAR. We suggest that the difference between BOYM and HOEM is due to the position of HOEM being nearer to the steep north wall of Taylor Valley, resulting in a lower diffuse fraction. BOYM is located on the south side of the lake in a comparatively wider portion of Taylor Valley, which could allow for a higher fraction of diffuse light.
The T-sPAR toolbox
The T-sPAR toolbox automates the process of creating point and area PAR estimates. The toolbox uses the parameters described in this study as defaults in order to calculate surface PAR in Taylor Valley's basin and applies necessary scaling coefficients via Raster Math in order to generate daily totals of surface PAR. User-defined input is limited to the date or timeframe of interest. Cloud cover is factor calculated from the CC model and scales results based on meteorological observations.
The Point T-sPAR toolbox model requires latitude/longitude coordinates for point(s) of interest in decimal degrees. Values are input using a simple template table in order to project the points onto the DEM. The model provides estimates for clear conditions by default, but can incorporate CC as needed. When results are constrained by atmospheric conditions, multipoint calculations should ideally be limited to locations within the same lake basin. Point T-sPAR only accepts a single value for the CC factor and applies it uniformly to all points in the table. Coordinates in various lake basins should be calculated separately using the CC factor for the nearest station. The model interprets each point's spatial relationship and calculates surface PAR for its coordinates, outputting a table of results that can be further manipulated outside of ArcMap.
The Area T-sPAR toolbox generates PAR raster maps for all of Taylor Valley and each of the major lakes. This model requires the input of CC factors for all four meteorological stations. The spatial relationship of CC factors is interpolated across the entire valley using IDW to create a CC mask (Fig. 10a). The IDW interpolation creates a sphere of influence around each of the four sample points that decreases with distance when other sample points are present within the sphere. The result is a smooth gradient transition from point to point.
Surface PAR map with an interpolated CC correction for a hypothetical 19 December created with the Area T-sPAR toolbox. a. Cloud cover raster mask shows interpolated atmospheric conditions based on input values for each meteorological station. Overcast conditions dominate on the eastern end of the valley, while clear conditions prevail in the west. b. Estimated surface PAR without CC correction. Values range between 39 and 86 mol photons m-2 day-1. c. Estimated surface PAR corrected with CC mask. The new raster shows the impact of CC on the eastern side of the valley with only a slight reduction on the western end. Values range between 27 and 80 mol photons m-2 day-1.

Surface PAR is then estimated based on ‘cloudless’ conditions (Fig. 10b) and merged with the CC mask using raster multiplication in order to create a CC-corrected map (Fig. 10c). Final PAR values are scaled down based on the magnitude of the CC values to a maximum of 50% of the pixel's ‘cloudless’ potential. Corrected maps are clipped using 19 December 2014 lakeshore boundaries in order to produce surface PAR maps by lake, and solargraphic contour lines with intervals of 1 mol photon m-2 are drawn in order to help distinguish surface values.
Conclusions
The best-fit LOESS curve of maximum daily PAR flux is representative of the nearly 20 year daily average; however, interannual variability of incident radiation due to changing atmospheric and solar conditions could lead to over- or under-estimates of the mean daily PAR flux near the solstice. EXEM has the highest frequency of overcast days, while BOYM has the lowest, which suggests a positive correlation between proximity to the coast and total days with high CC. The BOYM, EXEM and FRLM meteorological stations observe increasingly overcast conditions towards the end of the summer, peaking during the month of February. HOEM, on the other hand, records the highest frequency of overcast conditions during the month of December. Incorporating a temporal component improves estimates of CC in Taylor Valley.
Diffuse and reflected radiation accounts for 15–26% of global radiation, consistent with fractions reported at other latitudes. ArcMap's Point Solar Radiation and Area Solar Radiation tools are efficient methods for predicting surface PAR in the MDVs where spatial and temporal constraints limit extensive empirical measurements. Values of D = 0.3 and T = 0.7 had the lowest root mean standard deviation (between 1.6 and 3.6 daily mol photons m-2) of all models tested. Using these parameters, Point T-sPAR predicts EXEM to have the highest total daily PAR around the summer solstice, which is in agreement with meteorological observations; however, it fails to predict FRLM as the location with the second highest amount of total daily PAR, favouring BOYM instead. ArcMap characteristically under-predicts the radiation envelope during the weeks leading up to and following the summer solstice. Further research into using TRMs at high latitudes and low solar angles would greatly improve this model. In addition, incorporation of a conversion factor model dependent on the geometry of topography and sun position would also improve the model.
Presently, T-sPAR is sufficient at predicting surface radiation with enough accuracy to improve models for NPP in Taylor Valley. Bimonthly surface PAR maps identify total aggregate values on timescales that inform the choice of future sampling sites in the field and constrain the NPP of Taylor Valley's ice-covered lakes. Minimal user input and a simple graphical interface facilitate estimating surface PAR for any day of the Antarctic summer. The T-sPAR toolboxes allows users to calculate single-point approximations and correct estimated ‘cloudless’ surface values with modelled CC observations.
T-sPAR uses a higher-resolution DEM than previous radiation models in Taylor Valley and highlights the heterogeneous nature of incident PAR within the valley. Biological sampling is limited to a few locations each year due to logistical constraints. T-sPAR outputs show that on lake surfaces annual radiation varies by as much as 1500 mol photons m-2 within only a few hundred metres along the steepest PAR gradient. Increased resolution of incident radiation informs biological sampling locations that are better representative of the whole, especially where ecosystems are so sensitive to small perturbations in light availability. The T-sPAR toolboxes help constrain the NPP within Taylor Valley's ice-covered lakes, as well as improve the understanding of PAR in one of the Earth's more extreme ecosystems.
Acknowledgements
The authors thank Andrew Dombard, Max Berkelhammer and Chris McKay for their suggested edits.
Author contributions
DA is responsible for the development of the GIS toolbox and cloud cover model. He is also responsible for the field surveys and for maintaining the long-term automated weather stations. He contributed to the concept and design of the project. PTD contributed to the concept and design of the project, provided field assistance and edited the manuscript prior to submission. MM provided supported for the development of the toolbox, tested toolbox accuracy and edited the manuscript for submission.
Financial support
DA received generous support from Mexico's Consejo Nacional de Ciencia y Tecnología (CONACYT), the University of Illinois at Chicago's Department of Earth and Environmental Science and Louisiana State University's Department of Geology and Geophysics. This work was funded by the National Science Foundation LTER grant 1637708.
Supplemental material
Thirty-four supplemental maps will be found at https://doi.org/10.1017/S0954102020000218.


