



The prevalence of overweight in adolescence is increasing in many countries, including Brazil. According to Brazilian National Survey conducted in 2009–2010, 20 % of the population was overweight and obese( 1 ), with a faster rate of increase in middle-income regions and among lower-income groups( 2 ).
In the USA, the prevalence of obesity appears to have reached a plateau, albeit with a gradient among socio-economic levels, with a decreasing rate among higher socio-economic groups and an increasing rate among lower socio-economic groups( Reference Frederick, Snellman and Putnam 3 ). In Brazil, overweight and obesity continues to rise in all socio-economic groups, but the highest prevalence is still observed in higher socio-economic groups( 1 ).
Identification and characterisation of weight changes over time in adolescents and the factors related to these changes are fundamental( Reference Fitzmaurice, Laird and Ware 4 ). However, such research is rarely performed in middle- and low-income countries, as conducting longitudinal studies necessary to do so is complex and costly.
Moreover, few longitudinal studies on adolescents conducted in Brazil( Reference Victora, Sibbritt and Horta 5 – Reference Goncalves-Silva, Sichieri and Ferreira 7 ) ever investigated the trajectory of BMI, which is a valuable indicator in detecting acute changes in weight and thus an important tool to guide immediate interventions to prevent overweight and obesity. The aim of this study was to fill this gap by examining BMI trajectory and excessive weight gain according to demographic and socio-economic factors in adolescents attending public and private schools in the metropolitan region of Rio de Janeiro, Brazil.
Methods
The objective of the Adolescent Nutritional Assessment Longitudinal Study (ELANA) was to access changes in anthropometric measures and associated factors. High school students from four private and two public schools, located in the metropolitan region of Rio de Janeiro, Brazil, were followed up for 3 consecutive years: 2010 (baseline), 1st year of high school (age range 13·5–19·5 years; girls n 557; 53·6 %); 2011 (age range 14·4–19·7 years; girls n 431; 54·6 %); and 2012 (age range 15·3–20·9 years; girls n 325; 55·6 %). Anthropometrics were measured at school at baseline and at the two follow-up occasions. A self-report questionnaire was applied at baseline for investigation of variables that are possibly related to weight gain such as socio-economic, demographic, lifestyle and psychosocial variables. In the present study, we analysed the association of BMI trajectory and excessive weight gain with socio-economic and demographic variables.
The ELANA was approved by the Ethics Committee in Research of the Institute of Social Medicine of the State University of Rio de Janeiro (certificate number 0020.0.259.000-09). The parents of adolescents provided written informed consent for the participation of their children.
All adolescents attending the 1st year of high school in 2010 were invited to participate in the study. Among 1134 adolescents invited to participate in the study, 1131 met the eligibility criteria of not having a physical or mental condition preventing filling out the questionnaire, and not being pregnant or lactating at the time. The effective study sample comprised 1039 students in 2010, 789 in 2011 and 585 in 2012. Reasons for follow-up losses are presented in the flowchart (Fig. 1).
Flowchart of Adolescent Nutritional Assessment Longitudinal Study subject selection and measurement.

Data collection
Questionnaires and anthropometric measures were performed by trained research assistants. The anthropometric data were collected according to Lohman protocols( Reference TG, A and Martorell 8 ) and standardised by Habicht techniques( Reference Habicht 9 ) in 2010 and Norton and Olds in 2011 and 2012( Reference Pederson and Gore 10 ).
Anthropometric data
Body weight was measured using an electronic and portable scale (Kratos®) with a capacity of up to 150 kg. Height was measured using a portable stadiometer (Alturexata ® ) with a range of 0–213 cm and a variation of 0·1 cm. Measurements were performed following removal of shoes and in light clothing, while standing fully upright, holding feet together, head in the Frankfurt plane, shoulders relaxed and arms hanging freely. Height was measured twice and repeated when the variation exceeded 0·5 cm between the two measurements. The mean of the measurements was used for analysis.
Demographic and socio-economic data
Data on age, sex, skin colour (according to Brazilian Institute of Geography and Statistics classification)( 11 ), type of school attended (public or private) and current household assets were obtained by administration of a self-report questionnaire to the adolescents. Data on maternal and head of household schooling were obtained through a self-administered questionnaire mailed directly to the adolescents’ legal guardians or by calling them at home.
The socio-economic status (SES) was obtained according to Brazilian Socioeconomic Classification Criteria( 12 ), which takes into account the purchasing power of urban households based on a score obtained by the sum of the household assets, the presence of domestic workers in the household and the schooling level of the head of household, resulting in eight classes (A1 higher, A2, B1, B2, C1, C2, D and E lower).
Data analysis
Age of adolescents was calculated as the difference between the evaluation date and the date of birth. To the SES classification, the original classes were grouped to form the classes A (A1 and A2), B (B1 and B2) and C/D (C1, C2 and D). None of the subjects had been classified into class E.
Maternal schooling was classified as either up to 8 years or >8 years of schooling. Skin colour was categorised as either white or non-white, the latter comprising those reporting themselves as blacks, brown coloured, yellow (Asian origin) and indigenous.
BMI (kg/m2) was classified into four groups according to WHO’s recommended age- and sex-standardised z-scores( Reference de Onis, Onyango and Borghi 13 ), with underweight (<−2), normal weight (≥−2 to ≤+1), overweight (>+1 to ≤+2) and obese (>+2).
Multiple imputation (MI) was performed by using the multiple imputation procedure (Proc MI) command of the SAS version 9.3 software (SAS Institute) to deal with missing data on skin colour, socio-economic classification and maternal schooling. The imputation model included the variables such as sex, type of school and some household goods that better discriminate the SES level (number of cars, washing machine and paid maid). Assuming a missing-at-random pattern( Reference Fitzmaurice, Laird and Ware 14 ), the MI procedure creates k sets of imputed data by using the Markov chain Monte Carlo estimation method. In all, ten data sets were generated in the present study. The statistical analysis considered the variable ‘imputation’ generated by Proc MI, allowing the use of imputed data from all ten data sets. Information was next combined using SAS Proc MIANALYZE command to yield summary point estimates and respective standard errors.
Baseline data of subjects with one BMI measure were compared with those with two or more BMI measures. Mean differences were compared using Student’s t tests or linear regression models for imputed variables, and for categorical variables χ 2 tests and logistic regression models were used for comparison.
The evaluation of the BMI trajectories was performed using a linear mixed effects model that allows accommodating correlations between repeated measurements( Reference Fitzmaurice, Laird and Ware 4 ). This model also allows for incomplete follow-up data on the outcome variable, and by taking into account the appropriate variance and covariance structures it directly estimates the common effects of subjects in the same group – fixed effects – and specific effects of each subject – random effects( Reference Spyrides, Struchiner and Barbosa 15 ).
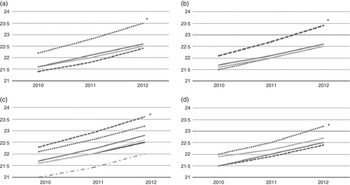
To test whether the BMI increase differed over time according to demographic and socio-economic groups, several interaction terms involving age (as a continuous time scale variable), sex and the other variables (age×sex×x p ) were fitted. Thus, models for each variable were tested. These analyses assumed an unstructured variance–covariance pattern( Reference Fitzmaurice, Laird and Ware 4 ). Table 3 and Fig. 2 show the results of these analyses with values plotted by time point (years 2010, 2011 and 2012) to allow better visualisation of the growth during the study.
Predicted mean of BMI from 2010 to 2012, by socio-economic variables using the linear mixed effects model. (a) Type of school attended (P=0·01); (b) skin colour (P=0·04); (c) socio-economic status (P=0·08); (d) maternal education level (P=0·02). (a):  , Boys – public school;
  , boys – private school;
  , girls – public school;
  , girls – private school; (b): , boys – white; , boys – non-white; , girls – white; , girls – non-white; (c): , boys – A; , boys – B;
  , boys – C and D; , girls – A;
  , girls – B; , girls – C and D; (d): , boys (until 8 years); , boys (>8 years); , girls (until 8 years); , girls (>8 years).
The analysis of excessive weight gain used the method proposed by Adair et al.( Reference Adair, Fall and Osmond 16 ). Accordingly, the conditional relative weight gain based on the residual values is obtained by subtracting from the BMI values observed in 2012 the predicted values estimated through a linear regression model that takes into account BMI at 2010, age at 2010 and at 2012, and sex. On the basis of the distribution of residuals in the z-scores, adolescents with values >1 z-score were classified as having experienced excessive weight gain. A logistic regression analysis was used to investigate the association between excessive weight gain and demographic and socio-economic characteristics, stratified by sex. This analysis was restricted to individuals whose BMI values were obtained in 2010 and 2012 (n 575; 55·3 %).
Results
The longitudinal analysis included all 1026 adolescents who had at least one measure of BMI. The number of adolescents measured during follow-up is shown in the flowchart (Fig. 1).
With regard to boys, the mean baseline BMI was higher among those classified as white (P=0·02), those who attended private schools (P=0·06) and those of higher SES (P=0·04). For girls, no differences were observed in mean baseline BMI (Table 1).
BMI (kg/m2) by demographic and socio-economic characteristics of adolescents at baseline, classified according to sex (Mean values and standard deviations)
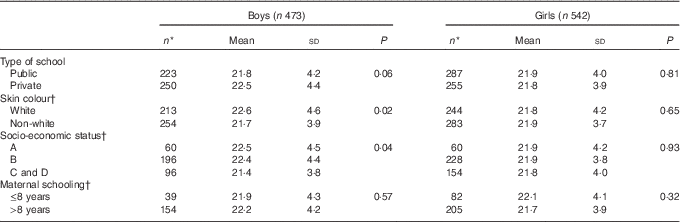
* n without imputation.
† Analysis based on imputed data.
Table 2 contrasts the baseline characteristics of adolescents with two or more BMI measurements and those with only one BMI measurement. Attrition was greater among those attending public schools. A pattern that is observed in Brazilian public schools with students leaving school after the 1st year.
Comparing the characteristics of adolescents with only one BMI measurement with those with, at least, two BMI measurementsFootnote * (Percentages; mean values and standard deviations)
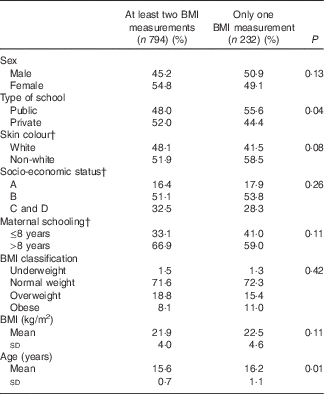
* The total number of subjects in each category was not specified owing to the use of multiple imputations.
† Based on imputed data.
The results of the gain in BMI units (kg/m2) after 3 years according to demographic and socio-economic variables are shown in Table 3 and Fig. 2. The significant interactions with sex (time variable×sex×socio-economic and demographic variables) indicate that the effect of socio-economic variables on the BMI trajectories is different in boys and girls. The highest increase of BMI occurred among white boys (P=0·04), boys attending private schools (P=0·01) and boys whose mothers had >8 years of schooling (P=0·02). The effect of the type of school in BMI trajectory was maintained even after model adjustment for other socio-economic and demographic variables (all P values<0·005, data not shown).
BMI increase over a 3-year period according to type of school, skin colour and socio-economic variables, by sex (β Coefficients and standard errors)

Ref., referent value.
* Calculated by using linear mixed effects model.
The results of the excessive weight gain indicated the greatest increase in boys attending private schools (P=0·03). Among girls, excessive weight gain was not significantly associated with any demographic or socio-economic characteristic (Table 4).
Excessive weight gain according to demographic and socio-economic variablesFootnote * (Odds ratios and 95 % confidence intervals)
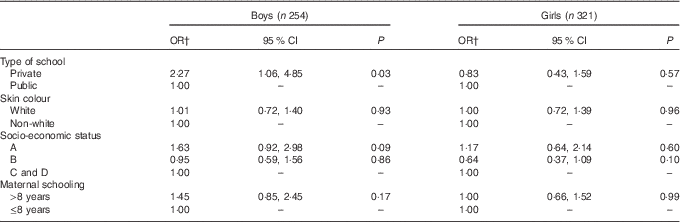
* Excessive weight gain: ≥1 sd of BMI. The weight predicted values were estimated through a linear regression model that takes into account BMI at baseline, age at 2010 and at 2012, and sex.
† OR for excessive weight gain from baseline to final follow-up.
Discussion
The main results of this study are that boys attending private schools, with white skin colour and those whose mothers studied >8 years experience a greater increase in BMI than boys and girls in other groups. The risk of excessive weight gain was also higher among boys attending private school than among boys attending public school.
Few studies have investigated the relationship between BMI trajectory and socio-economic and demographic factors during adolescence( Reference Lane, Bluestone and Burke 17 – Reference Ventura, Loken and Birch 20 ). The few studies that have been conducted were carried out in high-income countries and found that the highest BMI increase occurred in adolescents coming from families with lower SES( Reference Lane, Bluestone and Burke 17 ), low income( Reference Lane, Bluestone and Burke 17 – Reference Shin and Miller 19 ) and lower levels of maternal schooling( Reference Nonnemaker, Morgan-Lopez and Pais 18 – Reference Ventura, Loken and Birch 20 ). These results are in contrast to those of the present study, in which higher BMI gain was observed among boys attending private schools (those in Brazil probably experienced better socio-economic conditions than those attending public schools), among boys with higher maternal schooling levels and additionally among boys with white skin colour who in Brazil have better income and more years of study( 21 ).
The prevalence of overweight and obesity in Brazil increased 6-fold in male adolescents and 2·5-fold in female adolescents between 1975 and 2009( 1 ). Although this increase occurred in all income groups, differences in growth rates were consistently higher among boys. Whereas the prevalence of overweight in 2009 ranged from 12·7 % in male adolescents in the first income quintile to 31·6 % in the top quintile, this range was quite narrower in girls (only 15·5–21·6 %, respectively)( 1 ). These results provide support for the more pronounced trend in excessive weight gain in Brazilian boys of better social characteristics.
These longitudinal results showed the similar trend observed in cross-sectional studies, which found that boys in better socio-economic conditions, indicated by type of school, white skin colour and higher mother schooling, presented greater BMI gain. Although the SES variable was used in Brazilian studies( Reference Rodrigues, Pereira and Cunha 22 – Reference Moreira, Muraro and Brito Fdos 25 ), the items included in this classification criterion (mainly household goods) were considered with low discriminatory power and unstable to dynamic changes in population’s consumption habits( Reference Mattar 26 ). Therefore, despite the SES classification facility, the evaluation of the consumption habits not necessarily reflects the social health, medical access and wellness( Reference Antunes 27 ). These probably can explain the fact that SES classification variable itself did not present associations in the longitudinal analysis.
The results also indicate that the type of school attended (public or private) appears to be a good indicator of the socio-economic level associated with overweight in Brazil. The finding of a higher prevalence of overweight among boys attending private schools compared with public schools is also in accordance with the findings of the Brazilian National Survey of School Health, which examined more than 60 000 Brazilian students in the 9th year of elementary school( Reference Araujo, Toral and Silva 28 ), and of other studies performed in Brazil( Reference Brasil, Fisberg and Maranhão 29 – Reference Campos, Leite and Almeida 31 ). On the other hand, in a representative sample of the US population, O’Malley et al.( Reference O’Malley, Johnston and Delva 32 ) found that the school environment exerted an influence on adolescent weight status; however, excessive weight was greater in American adolescents attending public schools compared with those attending private schools. As these findings indicate, the type of school seems to be an important marker of socio-economic conditions in studies of overweight in adolescents, with attendance to private schools showing an inverse association with weight gain in high-income countries( Reference O’Malley, Johnston and Delva 32 – Reference Li and Hooker 34 ), whereas a direct relation with weight gain in middle- and low-income countries( Reference Blake-Scarlettl, Younger and McKenzie 35 , Reference Bovet, Chiolero and Madeleine 36 ).
In addition, differences by type of school have been shown in a large Brazilian survey. Data of the National Survey of School Health indicate that students from private schools had more access to snack bars at school (94·8 against 39·4 % in public schools), are less physically active (29·1 against 34·7 % in public schools)( 37 ) and are exposed to less time in physical education classes (40·1 v. 52·5 % in public schools)( Reference Malta, de Andreazzi and Oliveira-Campos 38 ). These behaviours are the possible explanations for greater weight gain in adolescents from private schools.
The study also indicates that results from BMI trajectory are quite similar to those based on analysis of excessive weight gain. This consistency is important, as it suggests that a longitudinal analysis may incorporate and correct for losses to follow-up and better discriminate among factors associated with BMI gain.
However, it should be noted that several factors in low- and middle-income countries, for instance Brazil, such as improvements in economic conditions, urbanisation, changing dietary patterns with increasing access to industrialised products and integration of global markets, might be contributing to a reversal of this relationship. The continued influence of these factors may lead to an increase in overweight even in the lower socio-economic classes such that the relationship between overweight and socio-economic class approaches that observed in high-income countries( Reference Dinsa, Goryakin and Fumagalli 39 , Reference Monteiro, Moura and Conde 40 ).
A limitation of this study was a loss to follow-up of 44·7 % between 2010 and 2012, which only allowed analysis of excessive weight gain in a little more than a half of the sample (55 %). Nevertheless, analysing the BMI trajectory through a mixed effects model accounted for missing data and differences between the numbers of measurements per subjects, and provided strong evidence of a growing trend of BMI increase in boys attending private schools, boys with white skin colour and that mothers studied more, thereby confirming that these adolescents have a higher risk of becoming overweight. Another limitation was that the exposure variables were assessed only at the baseline of the study, making it impossible to evaluate the changes over time. This was because of difficulty in addressing students at 2nd and 3rd years of high school when studies become more intense. However, specifically, the socio-economic variables analysed in this study are more stable and should not have changed over the short follow-up period.
This was a pioneering study, the first in Brazil to assess changes over a brief observation period of the trajectory of BMI among adolescents. According to Popkin et al.( Reference Popkin, Adair and Ng 41 ), this should be the focus when assessing dynamic changes of overweight in middle- and low-income countries.
Acknowledgements
The Adolescent Nutritional Assessment Longitudinal Study (ELANA) was funded by the National Council for Scientific and Technological Development (grant 47667/2011-9), the Research Support Foundation of the State of Rio de Janeiro (grants E26/110·847/2009, E26/110·626/2011 and E-26/110.774/2013) and Coordination for the Improvement of Higher Education Personnel (grant 23038.007702/2011-5).
N. F. M. wrote the first draft of the manuscript and was not given any honorarium, grant or other form of payment to anyone to produce the manuscript. R. S., M. E. R. and G. V. d. V. conceived and designed the ELANA Project. Specific longitudinal analyses were performed by the authors N. F. M. and R. S. The conception, design and interpretation of this paper data were realised by N. F. M., R. S., M. E. R., A. S. D. d. O. and G. V. V.
The authors have no conflicts of interest to disclose.



