


Lectures have been given annually since 2000 in honour of George Brown, and they relate to the very diverse topics that clay mineralogy addresses. Reflecting current interests in major issues that relate to the United Nation's Sustainable Development Goals (SDGs; https://sdgs.un.org), this paper focuses on weathering and how the weathering of silicate minerals (a driving force in the formation of clay minerals) in soils can contribute particularly to mitigation of hunger (SDG 2: End hunger, achieve food security and improved nutrition and promote sustainable agriculture) and to greenhouse gas removal in the context of SDG 13: Take urgent action to combat climate change and its impacts.
Clay mineralogists refer back to the foundational work of George Brown, much of which was carried out in what is now Rothamsted Research, a research station that dates from 1843. Here, the importance of clay mineralogy as a component of soil science was recognized in the late 1940s when the Department of Pedology was formed (Wood, Reference Wood1996). The father of geochemistry, V.M. Goldschmidt, was influential in the decision to form this department, and it is worth recalling that Goldschmidt's work between the two world wars addressed SDG 2 through his experiments with nepheline-bearing rocks as sources of crop nutrients (Goldschmidt, Reference Goldschmidt1922; Goldschmidt & Johnsson, Reference Goldschmidt and Johnsson1922). Rothamsted's early recognition of the importance of mineral weathering in soils was timely and highly productive, although in recent years other priorities have dominated. Given the need to address major global issues, it is now appropriate to emphasize the dynamic nature and behaviour of minerals in soils at timescales that relate to crop growth, as well as to consider how soil processes that involve mineral transformations in the presence of plant roots (Gregory, Reference Gregory2022) have a vital role to play in food security and climate mitigation.
This paper provides an overview of current knowledge concerning mineral reactions in soils and draws on published information to generate new insight into reaction rates in the context of the nutritional requirements of plants. It has four major sections:
(1) Mineral weathering
(2) Novel sources of crop nutrients
(3) Removing carbon from the biosphere
(4) Demonstrating that these processes take place
Mineral weathering
Wilson (Reference Wilson2004) delivered the fourth George Brown Lecture and the associated paper is a substantial review of silicate mineral weathering, addressing biological weathering of primary rock-forming silicates and soil-hosted clay minerals. Wilson's publication should be read before progressing further with this paper, which applies and augments much of the previous paper's content.
It is important to reiterate that the silicate minerals that have formed at high temperatures and pressures – the majority of the ‘rock-forming minerals’ (Deer et al., Reference Deer, Howie and Zussman2013) – are inherently unstable under Earth-surface conditions. Recognized empirically in the Goldich Stability Series, this can be demonstrated thermodynamically (Fig. 1) using an internally consistent approach to compare free-energy values for weathering reactions suggested by Curtis (Reference Curtis1976).
Gibbs free energies of reaction of representatives of the major rock-forming mineral families in the Goldich Stability Series (Goldich, Reference Goldich1938) based on reactions written in a form in which quartz is the product, as explained by Curtis (Reference Curtis1976).
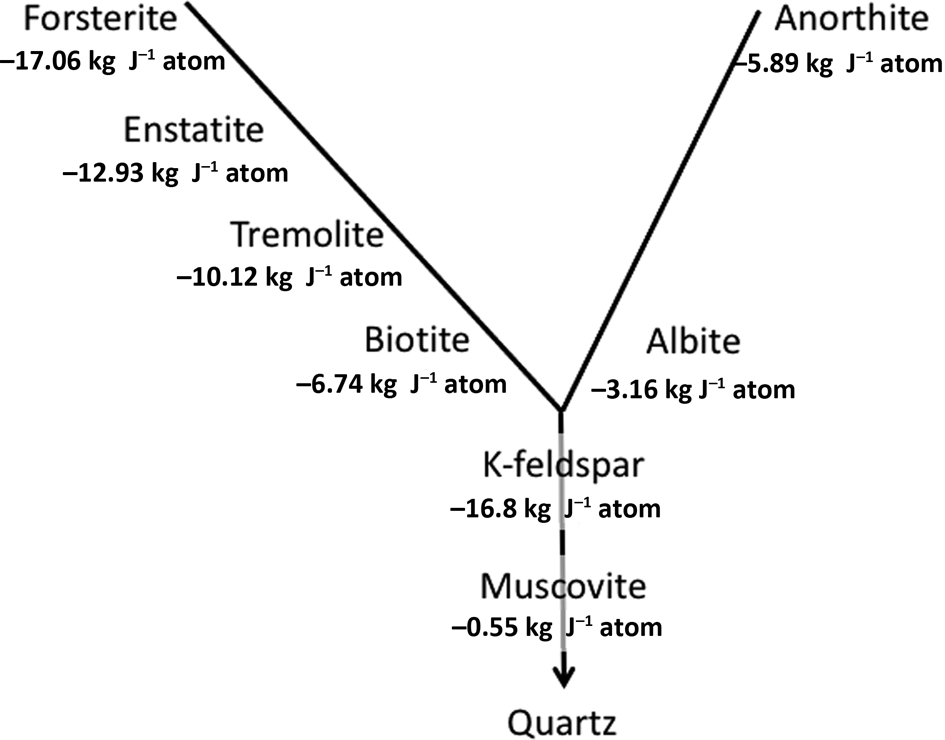
In explaining long-established empirical observations, Fig. 1 is necessarily a simplification of a number of different weathering mechanisms. For K in particular, these involve both mineral dissolution with Gibbs free energies of reaction as in Fig. 1 and cation-exchange reactions. These give rise to the concept of K ‘pools’ with differing stabilities and availabilities to plants within soils, as thoroughly explored by Bell et al. (Reference Bell, Ransom, Thompson, Hinsinger, Florence, Moody, Guppy, Murrell, Mikkelsen, Sulewski, Norton and Thompson2021), who recognize six different K pools. These are: (1) structural K in feldspars and feldspathoids; (2) K in neoformed secondary minerals; (3) interlayer K in micas and partially weathered micas; (4) interlayer K in secondary-layer silicates; (5) surface-adsorbed K; and (6) the soil solution. Bell et al. (Reference Bell, Ransom, Thompson, Hinsinger, Florence, Moody, Guppy, Murrell, Mikkelsen, Sulewski, Norton and Thompson2021) discuss in detail the mechanisms of weathering of the micas in soil environments.
The weathering reactions summarized in Fig. 1 are written in Table 1 in a format that reports silica as a soluble product, silicic acid (H4SiO4), and kaolinite is the mineral product that hosts Al. This is appropriate for mineral reactions in soils, as the kinetics of precipitation of quartz have long been recognized to be prohibitively slow at 25°C and atmospheric pressure (Rimstidt & Barnes, Reference Rimstidt and Barnes1980; Knauss & Wolery, Reference Knauss and Wolery1988). Additionally, the formation of kaolinite as the Al-bearing product is appropriate for many mineral soils given that Al solubility is at a minimum at near-neutral pH.
Weathering reactions for representative rock-forming minerals, written to have kaolinite and dissolved species as products.

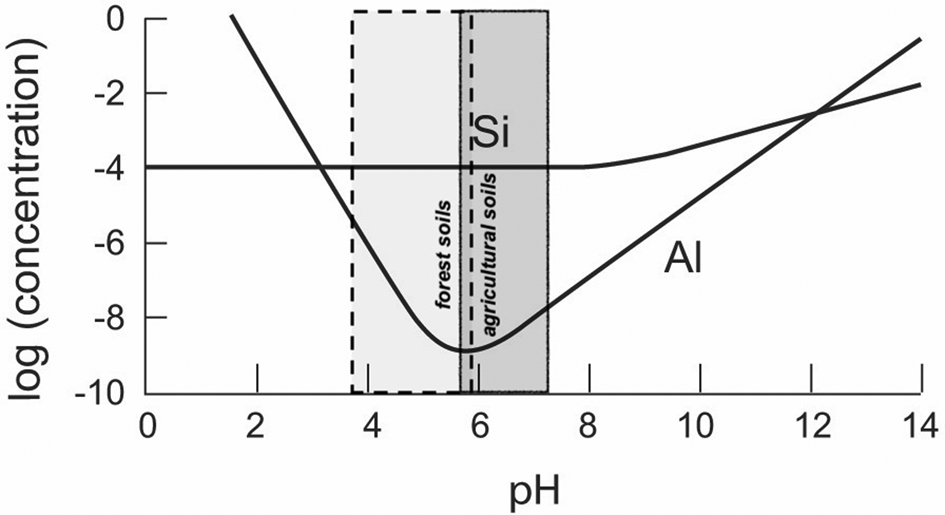
Al and Si solubilities are summarized in Fig. 2. Importantly, the contrasting behaviour with variation in pH is clear; at pH 6, the solubility of Al is 100,000 lower than that of silica (10 ppm Si), therefore of the order of 0.1 ppb Al. A survey of pH measurements for European soils shows that 50% of agricultural soils have pH values between ~5.6 and 7.3, and 50% of forest soils have pH values between 5.9 and 3.7, as summarized in Fig. 2. With very different mineralogies, these ranges correspond broadly to the soil pH values for similar land uses in tropical soils in Brazil (Crespo-Mendes et al., Reference Crespo-Mendes, Laurent, Bruun and Hauschild2019).
Solubility (molar concentration) of Al and Si as a function of pH (25°C, atmospheric pressure; gibbsite solubility calculated from May et al., Reference May, Helmke and Jackson1979; quartz solubility calculated from Rimstidt & Barnes, Reference Rimstidt and Barnes1980), with pH data (second and third quartiles; 12,333 soil pH measurements from 11 different sources) for European soils (European Soil Data Centre, 2010).
The reactions shown in Table 1 indicate the sources to the soil solution of the major cations that are needed as plant nutrients. Olivine, pyroxene and amphiboles deliver Mg and Ca to the soil solution, micas deliver K and Mg and feldspars deliver Ca, Na (plagioclase) and K (K-feldspar). Depending on the assumption that kaolinite is the clay product, as in Table 1, decomposition involves delivery of silica to the soil solution for all but muscovite and anorthite. It is important to recognize the importance of silica for plant growth (Cornelis & Delvaux, Reference Cornelis and Delvaux2016), especially in grasses and cereals, where the formation within the plant of silica phytoliths provides some protection against pests and abiotic stress (Currie & Perry, Reference Currie and Perry2007). However, the role of silica in plant biology is controversial, as is discussed by Coskun et al. (Reference Coskun, Deshmukh, Sonah, Menzies, Reynolds and Ma2019), who develop a model in which Si plays an extracellular role against biotic and abiotic stress.
The silica content of plant shoots (dry mass) varies from 0.1 to 10.0 wt.% Si (Currie & Perry, Reference Currie and Perry2007) and shows considerable variation. Hodson et al. (Reference Hodson, White, Mead and Broadley2005) review the Si contents of 735 species, grouped phylogenetically, and show considerable variation between phyla, with the greatest Si concentrations in specific monocots (the group of plants that includes grasses and cereals, as well as bananas). For a single plant, there can be considerable variation between various anatomical parts of the plant. For example, in rice, the grain typically contains 0.2 g Si kg–1, the bran 20 g Si kg–1, straw 60 g Si kg–1, rice husk 110 g Si kg–1 and rice joints (at the base of the grain) 160 g Si kg–1 (calculated from van Soest, Reference van Soest2006, and rounded to equivalent significant figures). Variation of plant Si content with soil type is reported by Schnug & von Franck (Reference Schnug and von Franck1985) for wheat, barley and oats in Schleswig-Holstein (Germany), reporting the lowest concentrations for crops grown on podzol (2.5 g Si kg–1), intermediate concentrations on a brown earth (5.9 g Si kg–1) and highest concentrations on a marsh soil (11.5 g Si kg–1).
A key aspect that controls the availability of nutrients from minerals as they weather is the dissolution rate of the mineral. This varies greatly, reflecting factors such as the proportion of covalent bonding in the mineral structure, and is affected by factors such as soil pH. An internally consistent compilation of mineral dissolution rates is provided by Palandri & Kharaka (Reference Palandri and Kharaka2004), who distinguish three reaction mechanisms: acid (where the H+-catalysed reaction is written as in Table 1), neutral (reaction with water alone) and base (OH–-catalysed). In most soils, the acid mechanism is appropriate, although for quartz this mechanism does not apply (Palandri & Kharaka, Reference Palandri and Kharaka2004).
Representative mineral dissolution rates corresponding to the minerals in the Goldich Stability Series (Fig. 1) are summarized in Fig. 3. These broadly follow the stability sequences shown in Fig. 1. Nepheline has been added, as this is potentially a source of K given its relatively rapid dissolution rate (seven orders of magnitude greater than K-feldspar; Manning, Reference Manning2010; Bell et al., Reference Bell, Ransom, Thompson, Hinsinger, Florence, Moody, Guppy, Murrell, Mikkelsen, Sulewski, Norton and Thompson2021). Basaltic glass has a corresponding dissolution rate of –3.30 (expressed as log moles m–2 s–1; Lewis et al., Reference Lewis, Sarkar, Wade, Kemp, Hodson and Taylor2021). The very low dissolution rate for quartz reflects its inherent stability as a completely covalently bonded mineral.
Mineral dissolution rates (from Palandri & Kharaka, Reference Palandri and Kharaka2004) for representative Goldich Stability Series minerals, with the addition of nepheline.

Novel sources of crop nutrients
Conventionally, the major crop nutrients are supplied as natural, mined, soluble salts (such as sylvite KCl, kieserite MgSO4⋅H2O and, more recently, polyhalite K2Ca2Mg(SO4)4⋅2H2O) or as artificial chemical fertilizers. N fertilizers are manufactured using the Haber–Bosch process, which uses methane from natural gas and atmospheric N to produce ammonia and subsequently urea. P fertilizers are manufactured from natural phosphate rock, which is treated with sulfuric acid to produce phosphoric acid, the basic feedstock for chemical P fertilizers (Manning, Reference Manning2018). Minor nutrients are added to these as required or are sold separately in other products.
The chemical fertilizer supply chain to farmers is well established in the developed world (mainly in the Northern Hemisphere), where the economic structure of the agricultural sector enables the widespread use of chemical fertilizers. In the Global South, conventional chemical fertilizers can be too expensive for farmers to buy, especially for those who produce food for domestic consumption in coupled rural–urban communities rather than large-scale commodity crops destined for export, and so alternatives are needed (Manning & Theodoro, Reference Manning and Theodoro2020). In the UK, emphasis is placed on rewarding farmers for delivering a wide range of ecosystem services that go beyond food production (Bateman & Balmford, Reference Bateman and Balmford2018; Arnott et al. Reference Arnott, Chadwick, Wynne-Jones and Jones2021; Cusworth & Dodsworth, Reference Cusworth and Dodsworth2021), and given current interest in no-till agriculture and even rewilding (Sandom et al., Reference Sandom, Dempsey, Bullock, Ely, Jepson and Jimenez-Wisler2019; Newton et al., Reference Newton, Evans, Watson, Ridding, Brand and McCracken2021) there is scope to transfer knowledge from the Global South to the UK to provide alternatives to conventional fertilizers. To do this, soil mineralogy is a key consideration.
Although it is not a silicate, polyhalite may influence the formation of secondary minerals within soil environments, given that it is a source of K and other elements to the soil solution. This possibility has yet to be assessed, as it is a relatively new entrant to the current fertilizer market. Following the discovery of major deposits of polyhalite in Yorkshire (Kemp et al., Reference Kemp, Smith, Wagner, Mounteney, Bell and Milne2016), which are currently produced from Boulby Mine, the new Woodsmith Mine is being constructed with a design production goal of 20 million tonnes year–1 (Anglo American, 2021). Its value as a fertilizer in pot trials has been reported by Molin et al. (Reference Molin, Nascimento, Teixeira and Benites2020), and Lewis et al. (Reference Lewis, Hallet, Paton and Harrold2020) report that polyhalite releases nutrients more rapidly than conventional KCl (sylvite) fertilizers, both of which are supplied as granules.
By virtue of their wide occurrence, silicate minerals and their host rocks have long been considered as sources of crop nutrients, described in texts such as Agrogeology: The Use of Rocks for Crops (van Straaten, Reference van Straaten2007).
Much attention has focused on the use of silicate minerals as an alternative source of K. This major nutrient is vital for crop growth and is being ‘mined’ with every harvest from agricultural soils at an unsustainable rate, especially in the Global South (Sheldrick et al., Reference Sheldrick, Syers and Lingard2002; Sheldrick & Lingard, Reference Sheldrick and Lingard2004; Yakovleva et al., Reference Yakovleva, Chiwona, Manning and Heidrich2021). An early review by Manning (Reference Manning2010) has been updated and extended by Swoboda et al. (Reference Swoboda, Döring and Hamer2021); both papers comment that inconsistency between published trials prevents systematic interpretation of the published data.
Mineral sources of K are summarized in Table 2. Although naturally occurring K salts contain the greatest amounts of K, and some contain additional nutrients (especially polyhalite), some K silicates have K concentrations that are similar to or greater than those of the salts. When the mineral dissolution rate is taken into account (Table 2), the rapid dissolution of sylvite is clear. Amongst the silicate minerals, the potential of nepheline as a source of K is greatest, followed by leucite, emphasizing the potential value of the feldspathoids and feldspathoid-bearing rocks as sources of K.
Mineral sources of K. Silicate dissolution rates taken from Palandri & Kharaka (Reference Palandri and Kharaka2004) and estimated for sylvite from Husband & Ozsahin (Reference Husband and Ozsahin1967; 20°C, assuming equal dissolution rates for halite and sylvite).

Interest in nepheline and micas as alternative sources of K for crop nutrition dates back formally to Goldschmidt's work in the 1920s. Work at the Norwegian State Raw Material Laboratory in the 1920s used materials from the North Cape nepheline syenite (Gautneb & Bakken, Reference Gautneb and Bakken1995) and compared the ability of biotite, nepheline and K-feldspar to deliver K for crop growth (Goldschmidt, Reference Goldschmidt1922; Goldschmidt & Johnsson, Reference Goldschmidt and Johnsson1922; Bakken et al., Reference Bakken, Gautneb and Myhr1997, Reference Bakken, Gautneb, Sveistrup and Myhr2000), and a related product is now available commercially (SoilFeed Silva, Sibelco; www.sibelco.com). These trials, carried out separately over a period of 100 years, show consistently that some biotite-bearing rocks deliver K as effectively as KCl (Bakken et al., Reference Bakken, Gautneb and Myhr1997), as also reported by Manning et al. (Reference Manning, Baptista, Sanchez Limon and Brandt2017). Nepheline-bearing rocks also were able to deliver K for plant growth. In all of these studies, K-feldspar is regarded as very poor in terms of it being a source of K for plant growth. Given the similarity in dissolution rates between K-feldspar and micas (Table 2), the difference in their ability to deliver K reflects their weathering behaviour (Bell et al., Reference Bell, Ransom, Thompson, Hinsinger, Florence, Moody, Guppy, Murrell, Mikkelsen, Sulewski, Norton and Thompson2021). In a sheet silicate, K is located in the interlayer site and so becomes accessible during weathering, which produces vermiculite, a mineral with a high cation-exchange capacity. The formation of vermiculite from phlogopite (the Mg end-member of the biotites) was observed in short (12 week) plant growth (pot) experiments reported by Mohammed et al. (Reference Mohammed, Brandt, Gray, White and Manning2014). In contrast, the framework structure of the feldspars is less conducive to weathering.
Although most studies of weathering of K-feldspar have shown no link between K-feldspar and K availability for plant growth, this observation is in part due to the design of the experiments, which generally use a natural soil in which feldspars and other K-bearing silicates may occur naturally. In experiments using a high-purity silica sand (99% quartz) and no silicate mineral other than the treatment, Manning et al. (Reference Manning, Baptista, Sanchez Limon and Brandt2017) were able to show that K was available for plant growth in experiments with added syenite that contained microcline as the only mineral host of K. Thus, if there is no alternative, it seems that a plant can derive K from a feldspar (Manning et al., Reference Manning, Baptista, Sanchez Limon and Brandt2017).
The role of soil microbial communities in the weathering of K silicate minerals has long been recognized, and this has been reviewed recently by Sattar et al. (Reference Sattar, Naveed, Ali, Zahir, Nadeem and Yaseen2019). Mechanisms include microbial production of organic acids that reduce pH, thus enhancing mineral dissolution directly or indirectly through chelation of Al and Si. Key communities include the rhizobacteria, fungal Aspergillus species and nitrogen-fixing bacteria. Baptista et al. (Reference Baptista, Gray, Tarumoto, Singleton, McCann and Manning2022) used molecular techniques to show that communities associated with K-feldspar from soils were dominated by Actinobacteria, and within this phylum the Actinomycetales were dominant. Scanning electron microscopy studies of feldspars from soils with known periods of exposure show clear corrosion of K-feldspar and the occurrence (Fig. 4) within the cavities thus formed of fungal filaments, microbial cells and soil protozoa (in this case, testate amoebae, which have a silica shell, or ‘test’; Manning & Baptista, Reference Manning, Baptista, Bamberg, Silveira, Martins, Bergmann, Martinazzo and Theodoro2017). Overall, the results of carefully designed plant growth experiments combined with observations from feldspars collected from soils demonstrate that despite the very low dissolution rate measured in sterile lab experiments, feldspars evidently do weather, and plants are able to derive K from these framework silicates.
Surfaces of corroded feldspars (Manning & Baptista, Reference Manning, Baptista, Bamberg, Silveira, Martins, Bergmann, Martinazzo and Theodoro2017). (a) From soil in Aberdeen, ~100 years of exposure; note testate amoeba (arrow). (b) From weathered syenite, Triunfo, Pernambuco, Brazil, unknown exposure; note dividing bacterial cells (arrow).

The use of nepheline (and other) feldspathoid-bearing rocks as alternatives to conventional sources of K has considerable potential to relieve deficiencies in many parts of the world where fertilizers are expensive. In East Africa, nepheline syenites occur along the East African Rift; their potential in Malawi (where fertilizer supply is a major problem) has been highlighted by Chiwona et al. (Reference Chiwona, Cortes, Gaulton and Manning2020). Phonolites are used as sources of K in Brazil, where crushed-rock fertilizers are established in federal regulation (Manning & Theodoro, Reference Manning and Theodoro2020) and are required to meet a set specification, with minimum limits for nutrients and upper limits for potential contaminants.
The possibility of using basaltic rocks as sources of K and P is addressed specifically by Lewis et al. (Reference Lewis, Sarkar, Wade, Kemp, Hodson and Taylor2021), extending studies of the availability of a wider range of cations essential for plant growth, especially Mg and Ca (e.g. Beerling et al., Reference Beerling, Leake, Long, Scholes, Ton and Nelson2018; Kelland et al., Reference Kelland, Wade, Lewis, Taylor, Sarkar and Andrews2020). As for nepheline, the relatively high dissolution rate for basaltic glass compensates for the very low K content (0.29% K2O in the glass studied by Oelkers & Gislason, Reference Oelkers and Gislason2001) in terms of releasing K into the soil solution (Lewis et al., Reference Lewis, Sarkar, Wade, Kemp, Hodson and Taylor2021).
Removing carbon from the biosphere
A simple interpretation of the carbon cycle (Ciais et al., Reference Ciais, Sabine, Bala, Bopp, Brovkin, Canadell, Stocker, Qin, Plattner, Tignor, Allen and Boschung2013) shows that the combined soil–plant system exchanges with the atmosphere ~120 Pg C year–1, compared with 90 Pg C year–1 for exchange between the atmosphere and the ocean. As the atmospheric pool is ~730 Pg C, all of the C in the atmosphere appears to pass through the coupled plant–soil system in ~6 years. Interventions disrupting this biological cycle by using soil processes to remove C from organic forms accessible to biological degradation offer scope for a ‘quick win’ in mitigating climate change through atmospheric CO2 accumulation.
In soils, emphasis is placed on soil organic matter, especially given its importance for ‘soil health’; high soil organic matter contents are associated with high levels of soil microbial activity and invertebrate biodiversity – all involving ‘churn’ that turns organic carbon into respired CO2. Such soils support high levels of plant diversity and productivity. At COP 21 in Paris (2015), the concept of ‘4 per mille’ was launched (https://www.4p1000.org), with the aim of increasing soil carbon stocks by 0.4% (4‰) annually as a means of mitigating climate change. However, although it is clearly desirable to increase the amount of soil organic matter, it is always unstable and, through decomposition, ultimately will release CO2 back into the atmosphere. Indeed, Berthelin et al. (Reference Berthelin, Laba, Tessier, Wander, Lemaire, Powlson and Baveye2022) point out that it may be ‘practically impossible to add sufficient amounts of crop residues to soils to have a lasting, non-negligible effect on climate change’.
The ability of soil processes to mineralize organic carbon (i.e. to remove carbon from the biological carbon cycle) has long been recognized, as discussed in a previous review (Manning, Reference Manning2008). Using pioneering C and O stable isotope studies, the formation of pedogenic carbonate minerals, predominantly calcite, was demonstrated to involve inputs of carbon that had passed through photosynthesis (Salomans & Mook, Reference Salomons and Mook1976; Salomans et al., Reference Salomons, Goudie and Mook1978; Cerling, Reference Cerling1984). More negative δ13C values in carbonate carbon (~7‰ VPDB; Fig. 5) reflect an input via the C3 photosynthetic pathway typical of the majority (93%) of plants, while less negative δ13C values (~3‰ VPDB) reflect the C4 pathway typical of tropical grasses and some shrubs (Khormali et al., Reference Khormali, Shahriari, Ghafarpour, Kehl, Lehndorff and Frechen2020). These characteristic carbon isotope values have been used to deduce vegetation change on a landscape to global scale from the measurement of δ13C in pedogenic carbonates (e.g. Cerling et al., Reference Cerling, Harris, MacFadden, Leakey, Quadek, Eisenmann and Ehleringer1997).
Summary of the C and O isotope characteristics of pedogenic carbonates associated with various plant communities and urban soils dominated by alkaline materials such as crushed concrete.

Figure 5 also shows the more extreme values for δ13C and δ18O observed for newly formed carbonates from urban soils that contain crushed concrete derived from demolition (e.g. Washbourne et al., Reference Washbourne, Lopez-Capel, Renforth, Ascough and Manning2015). In general, these have much higher pH values (pH ~10) than natural soils. This pattern is shown for soils constructed using crushed dolerite and crushed concrete in differing configurations (Jorat et al., Reference Jorat, Goddard, Manning, Lau, Ngeow, Sohi and Manning2020), which demonstrates the formation of pedogenic carbonates in soil formulations that may be used in the construction of green infrastructure.
Pedogenic carbonate formation is a natural soil process that can be rapid. Urban soils often contain artificial calcium silicate minerals (and portlandite; Ca(OH)2) derived from the crushing of concrete during demolition. They also contain glassy phases, which probably have similar dissolution rates to basaltic glass (Lewis et al., Reference Lewis, Sarkar, Wade, Kemp, Hodson and Taylor2021). Although as much concrete as possible is recycled as a secondary aggregate, the fine-grained products of crushing often remain on site and form part of the soil at a demolition site. Under these conditions, provided there is a source of carbonate (from the decomposition of organic inputs), calcite forms as a pedogenic urban soil carbonate mineral. The rate of formation of pedogenic carbonates in an urban soil was measured by Washbourne et al. (Reference Washbourne, Lopez-Capel, Renforth, Ascough and Manning2015), who showed that over a period of 18 months the equivalent of 85 tonnes of CO2 were removed annually per hectare of land, increasing soil C by 20 tonnes C ha–1 year–1. This compares with the removal of 3.63 tonnes C ha–1 year–1 through the establishment of new woodlands (Cantarello et al., Reference Cantarello, Newton and Hill2011).
Although urban soils can be highly reactive by virtue of the crushed concrete that some sites contain, carbonation here simply accounts for the CO2 lost stoichiometrically when limestone is calcined to produce Portland cement. But carbonation of natural silicate minerals also takes place on a human timescale. Weathering of basaltic rocks is known to produce pedogenic calcite in natural soil-forming processes (e.g. Kalin et al., Reference Kalin, Dardis, Lowndes, Hendry, Carey, Parnell, Ruffell and Worden1997; Srivastava et al., Reference Srivastava, Bhattacharyya and Pal2002), and this represents net removal of atmospheric CO2, as these rocks were never calcined artificially. The rate of pedogenic carbonate formation in artificial mixtures of compost and basaltic rock powders has been measured in a trial at Barrasford Quarry, Northumberland (UK), and corresponds to the removal of 4.8 tonnes C ha−1 year–1 (Manning et al., Reference Manning, Renforth, Lopez-Capel, Robertson and Ghazireh2013), a quarter of the rate of removal observed for urban soils that contain crushed concrete. This still exceeds what can be achieved from tree planting and aboveground growth.
Use of crushed basaltic igneous rocks (and Ca-rich artificial silicate materials such as slags) to remove atmospheric CO2 through the process of enhanced rock weathering (ERW) is becoming of increasing interest, especially following publications by Beerling et al. (Reference Beerling, Leake, Long, Scholes, Ton and Nelson2018, Reference Beerling, Kantzas, Lomas, Wade, Eufrasio and Renforth2020). In this process, natural weathering of mafic igneous rocks consumes CO2, generating alkalinity that is reflected by an increased carbonate (HCO3–) content of the soil solution, some of which then drains into aquifers and some into surface-water systems and eventually the ocean. The first measurements of an increase in bicarbonate in waters draining through a weathering basalt in Iceland were presented by Moulton et al. (Reference Moulton, West and Berner2000). Measurement of the bicarbonate content of streams and groundwaters for bare and wooded areas showed that up to 12 kg C ha–1 was produced annually as bicarbonate (60 kg bicarbonate) and exported via through-drainage. At a global scale, Dessert et al. (Reference Dessert, Dupre, Gaillardet, François and Allègre2003) estimate a flux to the ocean of 4.08 × 10¹² mol CO2 year–1, equivalent to 0.05 Pg C, which is tiny in comparison with the value of 120 Pg C in annual exchange between the atmosphere and the plant–soil system. What also needs to be taken into account is the currently unknown flux to groundwater, where bicarbonate is the dominant anion (e.g. Bottrell et al., Reference Bottrell, Hipkins, Lane, Zegos, Banks and Frengstad2019).
The calculation of CO2 removal through ERW is discussed in detail by Hartmann et al. (Reference Hartmann, West, Renforth, Köhler, De La Rocha and Wolf-Gladrow2013), involving use of the Steinour formula (Renforth, Reference Renforth2019). A simplified version of this formula is given as:

In this simplification, it is assumed that all of the chemical components are available for weathering – and so it gives a maximum value for ERW. The terms relating to S and P correct for Ca in particular that is combined with sulfate or phosphate in minerals such as gypsum, anhydrite or apatite. The coefficient given a value of 1.5 relates to the molar ratio of CO2 to divalent cation sequestered during enhanced weathering and is taken as a conservative global average (Renforth, Reference Renforth2019).
An alternative assessment of the ability of crushed rock to remove atmospheric CO2 through the formation of calcium and/or magnesium carbonates can be simply described through the following reactions:


Although there is widespread evidence for the formation of calcium carbonates in natural soils, the occurrence of magnesium carbonates appears to be restricted to Mg-rich locations, such as very specific mine wastes and other hosts of Mg silicate minerals. In these environments, a wide range of Mg carbonate minerals has been reported (e.g. Hamilton et al., Reference Hamilton, Wilson, Morgan, Turvey, Paterson and MacRae2016; McCutcheon et al., Reference McCutcheon, Wilson and Southam2016).
The amount of CO2 removed through the carbonation of calcium (or magnesium, using appropriate relative atomic masses) can be estimated simply using the stoichiometry of the following reaction:

In practice, the potential amounts of CO2 that can be removed could be estimated using a chemical analysis of the crushed rock or other material. If the focus involves basaltic igneous rocks (Beerling et al., Reference Beerling, Kantzas, Lomas, Wade, Eufrasio and Renforth2020), the amounts of S and P are very low (typically <0.5% as oxides) and can be regarded as negligible (especially given the lack of certainty over the value of the final coefficient in Equation 1; Renforth, Reference Renforth2019). The calculation of ERW gives a maximum estimate of CO2 removal (typically 230 kg tonne–1 for a dolerite), and the calculation of carbonation, based on the formation of calcite alone, gives a much lower value for CO2 removal (typically 70 kg tonne–1 for a dolerite). These values relate to complete reaction of the crushed rock, but little is known about the amount of time needed to achieve this, as it depends on many factors, including grain size (Kolosz et al., Reference Kolosz, Sohi and Manning2019).
In the absence of other information, it is often assumed that the production of crushed rocks suitable for use in ERW will use great quantities of energy. However, the production of crushed-rock aggregates necessarily is a very energy-efficient and competitive industry, as costs have to be kept low for construction markets. Carbon life-cycle analysis (Lefebvre et al., Reference Lefebvre, Goglio, Williams, Manning, de Azevedo and Bergmann2019) has shown that the amount of carbon used at the site of production of a crushed basalt, assuming fossil fuels as the primary energy source, is 5.4 kg CO2 tonne–1. The dominant carbon ‘cost’ in using crushed rocks is the cost of transport to the location where they are to be spread on a soil. Nevertheless, Lefebvre et al. (Reference Lefebvre, Goglio, Williams, Manning, de Azevedo and Bergmann2019) concluded that these materials could be transported for 1000 km before the carbon cost outweighed the carbon benefit. It is important to note that many quarries use permanently installed crushing plants that take electric power from the grid, offering the possibility of significant reductions to the carbon cost of production through the use of power generated from non-fossil fuel-dependent sources.
Demonstrating that these processes take place
The evidence that ‘rock-forming’ minerals, apart from quartz, are unstable in soils is widespread and has long been known and documented (e.g. Goldich, Reference Goldich1938). Evidence to support the benefits of the addition of minerals to soils to achieve either enhanced crop growth or artificially induced CO2 removal is much more difficult to obtain.
In the context of the supply of crop nutrients, the effect of an added treatment is conventionally measured using agronomic trials in which a yield–response curve is determined (e.g. Buczko et al., Reference Buczko, van Laak, Eichler-Löbermann, Gans, Merbach and Panten2018). This demonstrates the increase in yield as a consequence of the addition of a fertilizer, and it often shows that the response levels off above a specific application rate.
Trials using crushed rock or single minerals have been carried out, with contrasting results. For example, Mohammed et al. (Reference Mohammed, Brandt, Gray, White and Manning2014) show that applications of biotite and nepheline syenite both acted as sources of K for plant growth, whereas an application of microcline did not. Kelland et al. (Reference Kelland, Wade, Lewis, Taylor, Sarkar and Andrews2020) report enhanced growth of sorghum in column experiments as a consequence of application to a UK soil of basaltic rock dust providing P and K, with increased plant uptake of Si. In contrast, Ramezanian et al. (Reference Ramezanian, Dahlin, Campbell, Hillier, Mannerstedt-Fogelfors and Öborn2013) show that the application of a volcanic rock dust had no effect on plant growth or nutrient status using wheat. In studies in temperate climates that show little or no such effect and, critically, are not designed to control for soil mineralogy, the use of natural soils can cause problems. Although their chemical and mineralogical compositions may be determined, it is not possible to eliminate confounding effects that arise because alternative sources of the nutrient(s) of interest may occur naturally as natural minerals (especially micas and clays with relatively high cation-exchange capacities) within the soil. Attempts to overcome this include the use of ‘soils’ prepared from very well-known minerals; Manning et al. (Reference Manning, Baptista, Sanchez Limon and Brandt2017) used high-purity silica sand (>99% quartz) in experiments to test the growth of leeks with the application of feldspar, nepheline and mica (phlogopite), taking great care to ensure that the only source of K was the treatment. In contrast, addressing tropical conditions, experiments carried out using oxisols (in which silicate minerals are inherently unstable) typically show benefits for crop growth due to the addition of silicate minerals and rocks (e.g. Ramos et al., Reference Ramos, dos Santos de Medeiros, Gomez, Oliveira, Schneider and Kautzmann2020, Reference Ramos, Hower, Blanco, Oliveira and Theodoro2022).
Demonstrating carbon capture presents even more challenges. Ideally, a measured increase in soil inorganic carbon can be used to demonstrate that carbonation has taken place and that pedogenic carbonates have formed as a consequence of a treatment. For ERW, ideally the loss of the applied rock, as it is removed by weathering, or changes in bicarbonate in solution should be measured as evidence that the process is taking place. But both are much easier said than done, especially as soil is an open system, with downward migration of solutes and particulates.
Washbourne et al. (Reference Washbourne, Lopez-Capel, Renforth, Ascough and Manning2015) measured an increase in soil inorganic carbon by taking soil samples located using precise GPS positioning after an interval of 18 months. In the same study, trial pits to 3 m depth were dug, confirming reports from Renforth et al. (Reference Renforth, Manning and Lopez-Capel2009) that inorganic carbon, as carbonate, is greatest in the upper 1 m of a soil profile. In a much larger study of 20 brownfield sites, Jorat et al. (Reference Jorat, Goddard, Manning, Lau, Ngeow, Sohi and Manning2020) showed that it was not possible to observe consistently an increase in soil inorganic carbon, reflecting the lack of information on a site since demolition (especially the timing of demolition and subsequent interventions) and variable vertical distributions of soil carbon throughout the profile. Evidence that pedogenic carbonates had formed, however, was obtained from C and O stable isotope analysis.
An alternative approach is to use crop growth, given that the roots of a crop such as wheat extend to in excess of 1 m depth (Fan et al., Reference Fan, McConkey, Wang and Janzen2016) and can reach depths of 2 m (Thorup-Kristensen et al., Reference Thorup-Kristensen, Salmerón Cortasa and Loges2009), accessing in the order of 30,000–40,000 tonnes of soil ha–1. A growing crop thus samples a deep soil profile. Given that a crop such as wheat contains silica (Dodson et al., Reference Dodson, Hunt, Budarin, Matharu and Clark2011; Parr & Sullivan, Reference Parr and Sullivan2011), the production of biomass can be taken as an indication of the rate of release of silica from the soil. This silica is most likely to be derived from the weathering of silicate minerals within the soil, although wheat (and other plants) produces opaline silica phytoliths or phytolith-occluded carbon that can accumulate in soil, providing an alternative source (Parr & Sullivan, Reference Parr and Sullivan2011). Assuming production over a period of 4 months of a benchmark value of 9 tonnes ha–1 (Agriculture and Horticulture Development Board, n.d.) of wheat straw containing 2.5% SiO2 (Dodson et al., Reference Dodson, Hunt, Budarin, Matharu and Clark2011) in a monomineralic soil to 16.8 cm depth (the maximum depth for 50% of the root system; Fan et al., Reference Fan, McConkey, Wang and Janzen2016), Figure 6 compares the amount of silica removed by wheat with predicted yields for various minerals based on their dissolution rate.
Si yields for representative rock-forming minerals, calculated using data from Palandri & Kharaka (Reference Palandri and Kharaka2004), compared with observed removal of Si from soil in wheat straw.

Figure 6 needs careful interpretation. It shows results for two reaction mechanisms summarized by Palandri & Kharaka (Reference Palandri and Kharaka2004). The acid mechanism involves protons in the dissolution reaction and is regarded as appropriate in laboratory experiments for pH 1.3–4.0, while the neutral mechanism is appropriate for pH 5.6–8.2 (Hellman, Reference Hellman1994). In Fig. 6, the acid mechanism release rates have, for internal consistency, used the mineral dissolution rates extrapolated to pH 0, which is clearly impossible in soils. In a general case, where soil pH is not known, the release rates calculated for the neutral dissolution mechanism (open symbols in Fig. 6) may be more appropriate. In reality, the presence of organic acids in soils and the association of biological components of the soil with corroded surfaces indicate that the acid mechanism is likely to occur at higher pH values than assumed for the abiological dissolution processes summarized by Palandri & Kharaka (Reference Palandri and Kharaka2004), and so the true release rates could lie between those calculated for the neutral mechanism and those calculated for the acid mechanism.
From Fig. 6, the key observation is that quartz is unable to provide the silica required for crop growth. For minerals typically present in a dolerite or basalt (the plagioclase labradorite and the pyroxene augite), the plagioclase, if fine-grained, is able to react (assuming the neutral mechanism) sufficiently rapidly during a growing season to supply the silica required by wheat. Both react sufficiently rapidly according to the acid dissolution mechanism to provide the silica that the crop removes. Wollastonite reacts sufficiently rapidly for both the acid and neutral dissolution mechanisms, explaining its effective use as a source of Si for sugar cane production (Savant et al., Reference Savant, Korndörfer, Datnoff and Snyder1999).
Si yields for representative clay minerals, calculated using data from Palandri & Kharaka (Reference Palandri and Kharaka2004), compared with observed removal of Si from soil in wheat straw.

For comparison, a similar approach can be taken for the clay minerals reflecting their reactivity within soils (Bell et al., Reference Bell, Ransom, Thompson, Hinsinger, Florence, Moody, Guppy, Murrell, Mikkelsen, Sulewski, Norton and Thompson2021; Fig. 7), again considering quartz of a similar grain size. Kaolinite, smectite and clinochlore are all capable hypothetically of delivering the Si required by wheat over a wide range of particle sizes, and illite is capable of doing so for finer fractions. Quartz dissolution is unable to deliver the required Si even for a grain size of 0.001 mm (1 μm).
Conclusions
Drawing from a wide range of published work, it is clear that silicate mineral stabilities in soils are highly variable and are influenced by soil biological processes. The development of a soil capable of supporting plant life – and so supporting all life on land – is inherently driven by processes at the interface between the biosphere and the geosphere. The two systems work together. The stability of minerals is governed by chemical thermodynamics, with a considerable range in dissolution rates depending on the reaction mechanisms and crystal structures of various silicate minerals, especially the primary rock-forming minerals. The natural diversity of the geosphere has influenced the evolution of the biosphere over geological time. Natural selection – a biological process that is underpinned by random genetic mutation – has enabled organisms to evolve to give the highly diverse system that supports human life today. We are faced with the challenge of how the world will support a population of 9 billion people. We can only address this through a proper understanding of soils and of the biologically mediated reactions of the silicate minerals that weather to create those soils. These reactions both remove atmospheric CO2 and support crop growth. In the context of SDGs 2 and 13, they contribute to mitigating hunger and combatting climate change.
Acknowledgements
The author thanks the many research students and colleagues who have helped him with this work over the years and the funding bodies that have supported the research.


 Open access