


Investigations focusing on the relationship between abdominal fat accumulation and insulin resistance have exposed that an imbalance in the pro-inflammatory–anti-inflammatory environment plays a critical part in metabolic disorders(Reference Hyde, Sapper and Crabtree1). Indeed, prior studies have shown a strong relationship between low-grade inflammation and the incidence of metabolic dysregulation with adipose tissue-secreted molecules known as adipokines(Reference Ouchi, Parker and Lugus2), suggesting that adipokines can be utilised as targets to prevent and treat metabolic abnormalities(Reference Dludla, Nkambule and Mazibuko-Mbeje3).
Among adipokines, retinol binding protein 4 (RBP4) and fatty acid binding protein 5 (FABP5) have been described to be part of different metabolic signalling pathways affecting individuals with obesity and metabolic disorders(Reference Cho, Youn and Lee4). RBP4 is a specific transport protein for serum retinol that increases insulin resistance(Reference Chang, Yan and Bian5) and acts as a pivotal factor in the development of type 2 diabetes mellitus(Reference Chielle, Feltez and Rossi6,Reference McTernan and Kumar7) . In adipocytes, activators of fatty acid nuclear receptors known as PPAR induce RBP4 gene expression and RBP4 protein release. FABP5, on the other hand, plays a critical role in the regulation of lipid transport, homeostasis and metabolism. FABP5 as a lipid chaperone can combine with saturated and unsaturated long-chain fatty acids and increased the solubility of fatty acids(Reference Zimmerman and Veerkamp8). This role of FABP5 in fatty acid uptake may be closely associated with the pathogenesis of metabolic syndrome (MetS)(Reference Cao, Maeda and Gorgun9). Moreover, during lipid transport, PPARs have a direct physical interaction with FABP5. It is reported that FABP5 selectively enhances the activities of PPARβ/δ, and this cell signalling practically impacts the differentiation of keratinocytes(Reference Xu, Chen and Zhan10). Prior large-scale descriptive investigations involving thousands of human participants showed that altered RBP4 and FABP5 levels have a strong and independent association with MetS(Reference Mongraw-Chaffin, Hairston and Hanley11,Reference Armstrong12) , which provides further credence on the importance of improving the concentrations of these adipokines.
Decreasing adipose tissue is a main target in the treatment of MetS, and strategies commonly utilised for this purpose can also improve adipokines levels. Indeed, studies have revealed that lifestyle modifications, such as exercise and diet, improve RBP4 and FABP5 concentrations. For example, Taghian et al. showed that RBP4 and insulin resistance significantly decreased after 12 weeks of aerobic exercises (AE) in obese women(Reference Taghian, Zolfaghari and Hedayati13). On the other hand, Zabetian-Targhi et al. showed important role of diet control in decreasing RBP4 concentrations(Reference Zabetian-Targhi, Mahmoudi and Rezaei14). In another investigation, Shibue et al. reported that FABP5 expressed in murine K-cells is involved in fat-induced gastric inhibitory polypeptide secretion, resulting in diet-induced obesity(Reference Shibue, Yamane and Harada15). It seems that improving adipokine levels with exercise and diet may potentially control MetS status. Yet, no prior study has investigated the effect of diet and exercise in improving RBP4 and FABP5 concentrations in cohorts with MetS. Moreover, it has been hypothesised that higher thermic effects of KD and regular AE may reduce body mass and fat mass (FM) by increasing daily energy expenditure. But to our knowledge, the effects of the combination of diet and exercise on lipid homeostasis markers in individual with MetS are understudied. Consequently, the purpose of this study was to investigate the effects of dietary carbohydrate restriction and AE on RBP4 and FABP5 in middle-aged men with MetS. We also evaluated body composition and MetS factors as secondary outcomes of our investigation.
Methods
Study design
The study had a randomised, double-blinded, parallel-controlled design. Cluster or multistage sampling was utilised to assigned participants into four groups as follows: AE (n 10), ketogenic diet (KD; n 10), AE combined with KD (Aerobic + KD = 10) or control (C; n 10). All participants were fully familiarised with testing and experimental procedures prior to baseline measurements. Measurements were recorded at baseline and after 12 weeks (post) at the same time (within about 1 h) in the morning. Post-measurements took place approximately 72 h after the last exercise session in order to minimise potential acute influences of exercise on our outcomes. Participants were instructed to avoid altering their usual lifestyle and dietary habits during the investigation.
Participants
Forty middle-aged men with MetS (mean age = 53·97 ± 2·85 years, BMI = 31·09 ± 1·04 kg/m2) from Ardabil city in Iran participated in this research (Figs. 1 and 2). These individuals were recruited through social networks, emails through listservs, public announcement and word of mouth. Participant flow through the study and descriptive information are shown in figure and Table 1. The inclusion criteria were as follows: (1) men with MetS defined as having three or more of the following characteristics according to the US National Cholesterol Education Program Adult Treatment Panel III (NCEP ATP III) criteria: fasting glucose ≥ 100 mg/dl, HDL-cholesterol < 40 mg/dl, blood pressure (BP) ≥ 130/85 mmHg, waist circumference > 102 cm (40 in) and TAG ≥ 150 mg/dl(Reference Huang16); (2) sedentary (<60 min of exercise per week during the past 6 months); and (3) non-smoking. Potential participants were excluded if they were lactose-intolerant, had gastrointestinal disorders, infections in the last 3 months, and high total cholesterol (> 300 mg/dl), or used severe emergency treatment for high cholesterol (familial hypercholesterolemia), metabolic or endocrine dysfunction (unable to participate in exercise and diet interventions). Participants were also excluded if they smoked or consumed alcohol regularly, consumed dietary supplements that affected study outcomes, had any changes in their dietary patterns at least for 6 months prior to the study, were unwilling to comply with the dietary intervention or exercise training procedures, or desired to partake in additional exercise (independent of their assigned intervention). All participants reviewed and signed the written informed consent form. The study was approved by the Ethical Committee of the Tabriz Medical Sciences University (IR.TBZMED.REC.1399.880), performed according to the latest version of the Declaration of Helsinki ethical standards and registered in the International Clinical Trials Registry Platform with identifier IRCT20180724040579N3.
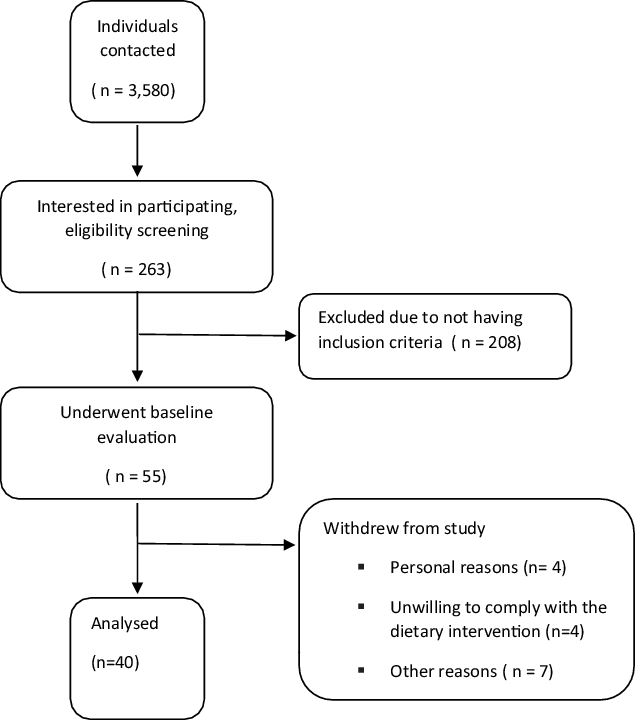
Fig. 1. Participant’s flow diagram.
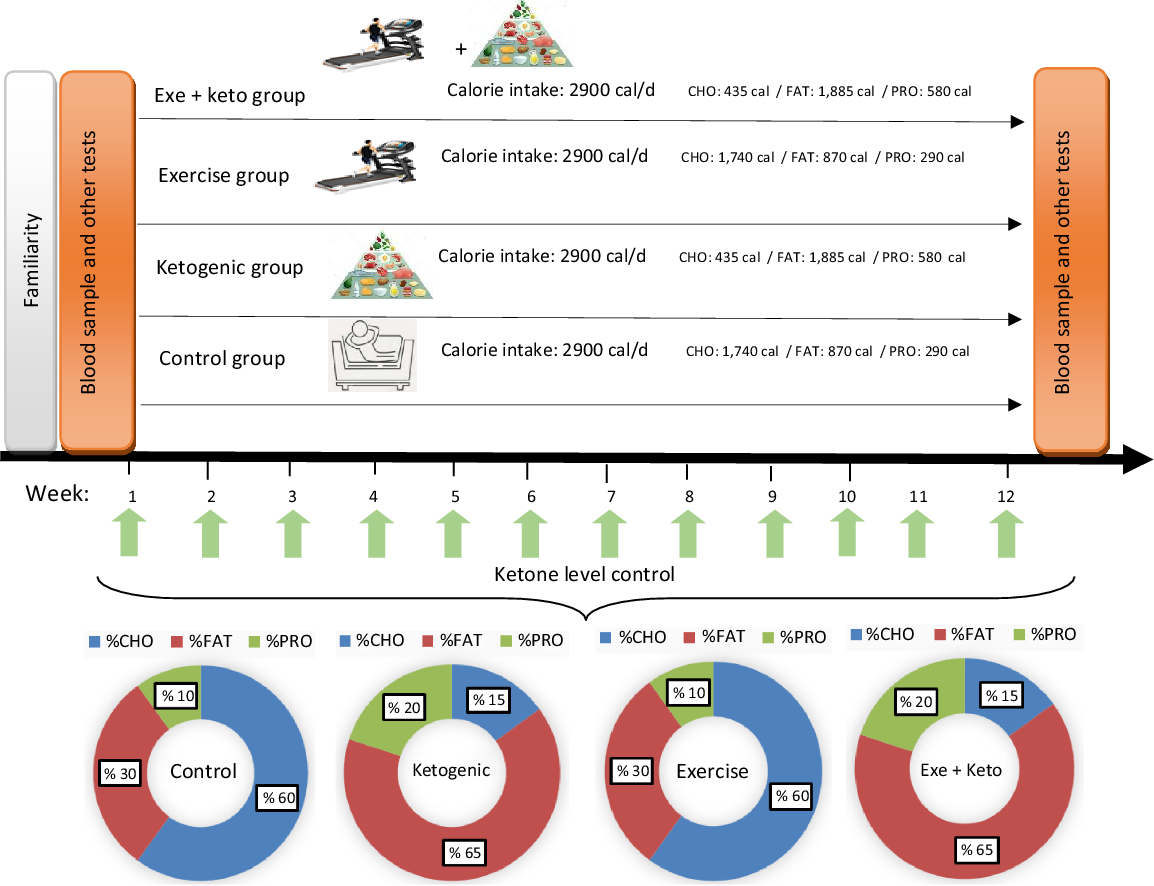
Fig. 2. Overview of study design and experimental diets. The caloric intake in each group was 2900 cal. % CHO, % FAT and % PRO refer to the percentage of energy substrates used in each group. Ketone levels were checked weekly. The amounts of energy consumed from each of the substrates are shown as a percentage in the pie chart and numerically in the figure. CHO, carbohydrate; PRO, protein.
Table 1. Participant’s body composition, insulin resistance, insulin sensitivity, MetS and VO2max at pre- and post-test
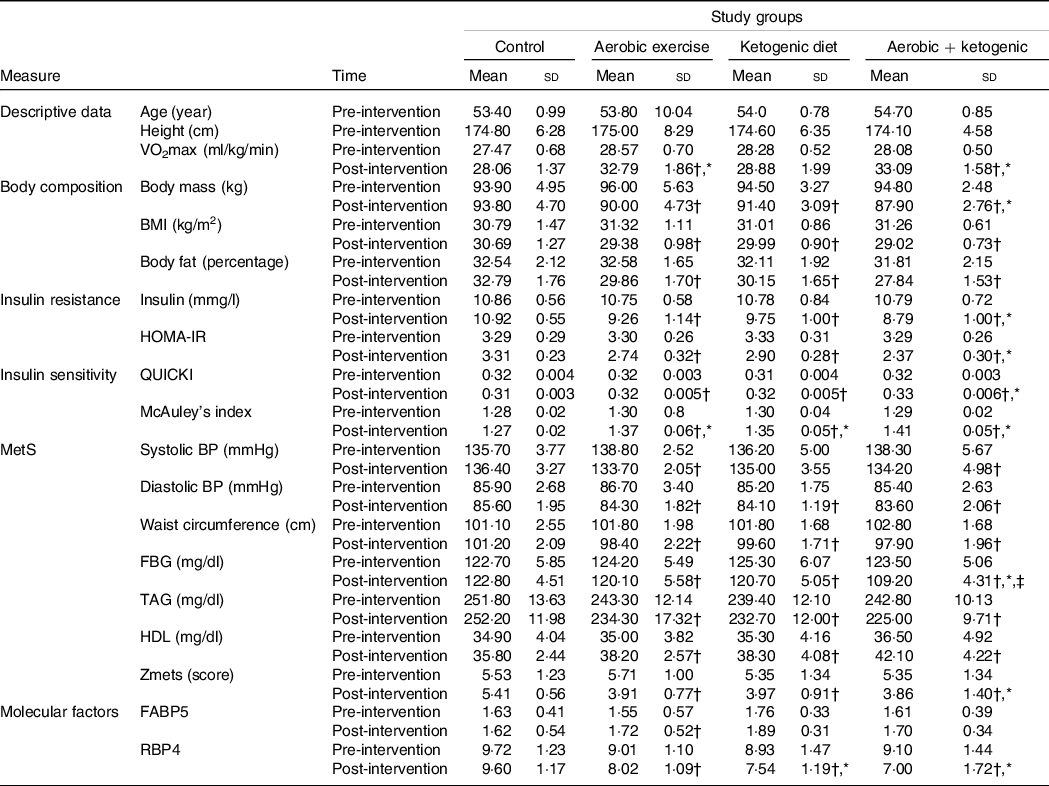
MetS, metabolic syndrome; HOMA-IR, homeostasis model of insulin resistance; QUICKI, quantitative insulin-sensitivity check index; BP, blood pressure; FBG, fasting blood glucose; FABP5, fatty acid binding protein 5; RBP4, retinol binding protein 4; KD, ketogenic diet.
* Statistically significant changes between the control and the intervention groups at post-test.
† Statistically significant differences from pre-test to post-test in each group.
‡ Statistically significant differences between the exercise + KD and the KD groups.
Exercise programme
Before initiating the exercise programme, participants in the AE and aerobic+ ketogenic groups were familiarised with the equipment and protocols. The familiarisation phase lasted 1 week and consisted of three sessions (15 min per session). Aerobic training was completed in a treadmill, three times per week for 12 weeks. The intensity of AE was moderate (60–70 % maximal heart rate equivalent to 11–14 Borg scale), while the duration of the training sessions was set at 45 min through the study. In the first 4 weeks (first 12 sessions), the intensity of exercise was 60 % of the maximal heart rate. In the second 4 weeks (sessions 13–24), the intensity was increased to 65 % of the maximal heart rate. Finally, in the last 4 weeks (sessions 25 to 36), the intensity of exercise was established at 70 % of the maximal heart rate. Our training protocol is based on the American College of Sports Medicine (ACSM) Aerobic Exercise Guidelines for Patients with Metabolic Syndrome(Reference Tjønna, Ramos and Pressler17). Each subject was supervised by a research physiologist and a physician during training. Adherence to exercise was defined as the proportion of sessions completed v. sessions scheduled. The adherence ratio was perfect due to the precise control of the training conditions. Moreover, heart rate monitors (Polar) were utilised to ensure adherence to the appropriate exercise intensity.
Diet control programme
Specific 7-d rotational menus were developed for the two diets utilised. A normal diet for the control and AE groups, and a KD for the ketogenic and the ketogenic + exercise groups performed in intervention period. Each menu was designed base of 2900 kcal caloric intake with constant relative macronutrient and micronutrient proportions between subjects. In this regard, foods containing vitamins and minerals as micronutrients in the KD were checked. For example, vitamin A (cruciferous veggies), vitamin B complex (red meats, seafood, dairy products, etc), vitamin C (citrus fruits, red and green peppers, brussel sprouts, spinach, etc), vitamin D (fatty fish, cheese, egg yolks, etc) and vitamin E (some nuts, legumes and seeds) are not lacking in the KD. But, vitamin K (cruciferous veggies like collards, turnip greens, kale and broccoli) could lack in a KD, although unlikely. In order to prevent vitamin K deficiencies participants consumed supplements. Also, minerals included Ca (dairy products, kale and broccoli), chloride (table or sea salt), Cu (dark chocolate and green veggies), fluoride (water), iodine (white fish, dairy products and eggs), Fe (plant and animal sources), Mg (spinach, almonds and yogurt), manganese (teas and spices), molybdenum (beans and peas), phosphorus (meats and dairy products), potassium (meats and dairy products), Se (animal products), Na (salt), sulphur (eggs) and Zn (meats and seafoods) are not lacking in the KD. However, Cr (grape juice, wheat muffins and potatoes) could possibly lack in a KD. To prevent Cr deficiencies, subjects consumed more broccoli or a supplement. Indirect calorimetry and the Harris–Benedict equation were used for a preliminarily determination of participants energetic needs. In order to match energy expenditure between subjects, subjects were fed a normal diet at an energetic intake level estimate at the initiation of the run-in diet. The KD was limited to a carbohydrate intake of 30–40 g/d. In this diet, the consumption of foods such as fish, eggs, cheese, chicken, beef and vegetable oils are quite normal, and the consumption of nuts and various seeds is somewhat limited and moderate amounts of vegetables, water, tea or sometimes low-carb diets were consumed. To ensure the status of ketogenic metabolism, daily urine ketone test strip (ACON brand, CA92121) was used to control the level of dietary ketones(Reference Greene, Varley and Hartwig18,Reference Vargas, Romance and Petro19) .
Dietary adherence was estimated using the protocol proposed by del Corral and colleagues(Reference Del Corral, Chandler-Laney and Casazza20). First, total energy expenditure (TEE) was calculated for each subject using RMR × 1·4 method. TEE at baseline and week 13 was calculated and the average of both (TEE baseline and TEE week 13) used. The following formula was used to calculate RMR = 9·99 x weight (kg) + 6·25 x height (cm) – 4·92 x age (years) + 5. Also, the expected daily kilocalorie loss was calculated as: expected daily kilocalorie loss = average TEE (baseline and week 13 for each subject) – actual daily average energy provided by the diet. Second, to convert losses of FM and fat-free mass (FFM) to energy, we used energy coefficients of 9·3 and 1·1 kcal/g, respectively. Therefore, actual daily kilocalorie loss = (FM lost (g) × 9·3 kcal/g) + (FFM lost (kg) × 1·1 kcal/g). Finally, index of dietary adherence was calculated as: daily kilocalorie discrepancy = actual daily kilocalorie loss–expected daily kilocalorie loss, and daily kilocalorie adherence was calculated as: daily kilocalorie adherence = (actual daily kilocalorie loss/expected daily kilocalorie loss) × 100. A daily kilocalorie discrepancy of 0 represents 100 percentage adherences. In this study, a daily kilocalorie discrepancy rate was 93 percentages.
Measures
Body composition
Body weight was established with a Seca Digital Scale (hyper model), while height was determined with a stadiometer (ADE 10038). The BMI (kg/m2) of all participants was calculated on the basis of their weight and height. We instructed our participants to fast for 12 h (overnight fast, with at least 8 h of sleep) and refrain from physical activity prior to all measurements. Body fat percentage was established utilising the 7-Site Skinfold (Jackson & Pollock) Protocol (Tricep, Chest, Subscapular, Midaxillary, Suprailiac, Abdominal and Thigh Sites). All the methods and measures used for assessing body composition were performed according to the recommendations from the book, Applied Body Composition Assessment(Reference Heyward and Wagner21). Waist circumference was determined using standard procedures(Reference Carroll, Chiapa and Rodriquez22).
Maximal oxygen consumption (VO2max) and blood pressure
VO2max was estimated with the oxygen consumption prediction formula in which participants walk on a treadmill. The test was performed following the American College of Sports Medicine Standard guidelines(Reference Glass and Dwyer23). Moreover, VO2max was estimated with the corresponding formula: VO2max = (speed (m.min) × 0·1) + (speed (m.min) × Grad × 1·8) + 3·5(Reference Tapking, Popp and Herndon24).
Systolic and diastolic BP at the right brachial artery were measured via a mercury sphygmomanometer following standard procedures. BP was measured three times (at 2-min intervals) and then averaged(Reference Shin, Abbott and Lee25).
Biochemical analyses
Blood samples (10 ml) were collected in the morning after a 10–12 h fast. These were taken from the antecubital vein using standard procedures. Following blood sampling, the samples were placed at room temperature for 15 min to clot. Samples were centrifuged at 3000 rpm for 15 min, and serum was stored at −80°C for future analysis. A Human RBP4 ELISA Sandwich kit (E-EL-H1581) was used for the in vitro quantitative determination of Human RBP4 concentrations in serum with sensitivity of 0·94 ng/ml, detection range of 1·56–100 ng/ml, specificity as well as intra- and inter-assay CV of < 10 %. Other supplies required included a microplate reader with 450 nm wavelength filter, a high-precision transfer pipette, EP tubes and disposable pipette tips, an incubator capable of maintaining 37°C, deionised or distilled water, absorbent paper and loading slot. Also, a Human FABP5 (Epidermal) ELISA Kit (E-EL-H1086) was applied to quantitatively determine Human FABP5 concentrations in serum with sensitivity of 0·19 ng/ml, detection range of 0·31–20 ng/ml, specificity to recognise Human FABP5 in samples, intra- and inter-assay CV of < 10 %. The TAG, HDL, LDL, total cholesterol and glucose concentrations were measured using the Pars Azmun company Kits.
Metabolic analyses
The homeostasis model of insulin resistance (HOMA-IR), quantitative insulin-sensitivity check index (QUICKI), McAuley et al. index (McAuley index)(Reference Kim, Kim and Kim26) and MetS severity Z-score (Zmets)(Reference Azali Alamdari and Gholami27) values were calculated using the following formulas: HOMA-IR = (fasting serum glucose (mmol/l) × fasting serum insulin (mg/ml))/22·5), QUICKI = 1/(log (fasting serum insulin (mg/ml)) + log (fasting serum glucose (mg/dl)), McAuley = exp (2·63–0·28 ln (fasting serum insulin (mg/ml)) - 0·31 ln (serum TaG (mmol/l))(Reference Kim, Kim and Kim26), and Zmets =((40-HDL)/5·89) + ((TAG-150)/41·11) + ((fasting serum glucose – 110)/15·82) + ((waist circumference – 91·5)/9·46) + ((mean arterial pressure – 100)/6·65)(Reference Azali Alamdari and Gholami27). A Human INS (Insulin) ELISA Kit (Catalog No: E-EL-H2665, Elabscience Biotechnology Inc. company) was used for fasting serum insulin analyses.
Statistical analysis
The SPSS statistical package, version 26.0 (IBM, SPSS, Inc.) was used for data analysis. The normality and homogeneity of data variance were established with the Shapiro–Wilk and Levin tests. A repeated-measures ANOVA was conducted for metabolic factors with time (pre-intervention and post-intervention) and groups (AE, KD, AE combined with KD and control) as the between-subject factors. Before the ANOVA test, Mauchly’s test was used to check the sphericity of the data. Bonferroni correction was performed for post hoc analysis after significant results of the ANOVA. For the calculation of sample size, a minimum detectable effect size (i.e. Δ of laboratory end points) of 0·20 was considered clinically plausible. This was determined using data from previous investigations utilising exercise and KD interventions(Reference Volek, Freidenreich and Saenz28–Reference Syamsunarno, Iso and Hanaoka30). Based on α = 0·05, a power (1-β) of 0·85, and an effect size of 0·2, a total sample size of forty participants (ten participants per group) was needed for sufficient power to detect significant changes in in RBP4 and FABP5. To account for potential participant attrition, we planned to recruit an extra five participants per group.
Results
Data overview
Participants tolerated the interventions well. The data overview of the descriptive and metabolic factors before and after the intervention of AE and KD is presented in tables and figures. The potential synergism between diet and AE was calculated using Excel calculator software. Measures of interaction on additive scale, including the relative excess risk due to interaction, synergy index of additivity and attributable proportion due to interaction for KD and AE in Zmets factor, were calculated. The results showed that the relative excess risk due to interaction on an additive scale is 0·26 (95 % CI (–0·30, 0·82)), meaning that the combined effect (0·26) is more than the sum of the individual effects. The synergy index of additivity is above 1 (1·79), and attributable proportion above 0 (0·16) indicates positive interaction.
Efficacy of aerobic exercise and ketogenic diet on body composition
Body mass, BMI and body fat percentage were significantly reduced after the AE, KD and the exercise + KD interventions (P = 0·001 for all groups). Between group comparison showed that only exercise + KD significantly decreased the body fat percentage (BF) as compared with control group (P = 0·007) (Tables 1 and 2).
Table 2. Results of the mixed model ANOVA for effects of group (exercise, ketogenic diet, exercise and KD and control) and time (pre-intervention and post-intervention) on metabolic factors
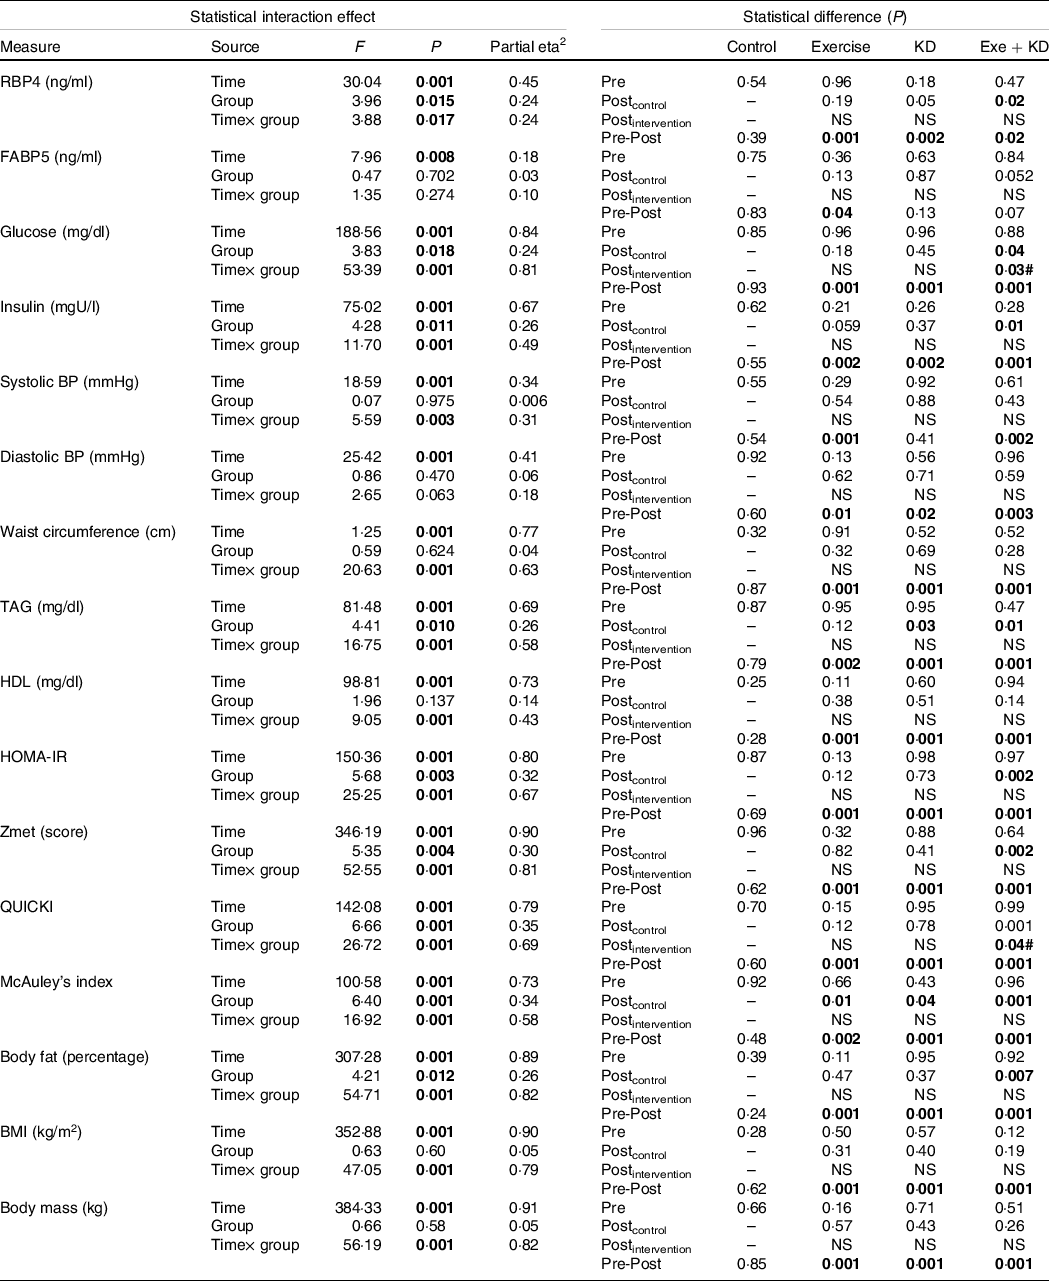
KD, ketogenic diet; RBP4, retinol binding protein 4; FABP5, fatty acid binding protein 5; BP, blood pressure; HOMA-IR, homeostasis model of insulin resistance; QUICKI, quantitative insulin-sensitivity check index.
Significant items are marked in bold.
Efficacy of aerobic exercise and ketogenic diet on retinol binding protein 4 and fatty acid binding protein 5
In the pre-post comparison, exercise (P = 0·001), KD (P = 0·002) and exercise + KD (P = 0·020) interventions showed significant reductions in RBP4. Interestingly, only the exercise intervention (P = 0·045) showed significant reduction in FABP5. Between-group comparison showed that the KD (P = 0·041) and exercise + KD (P = 0·017) interventions significantly decreased the RBP4 compared with the control group (Tables 1 and 2).
Efficacy of aerobic exercise and ketogenic diet on metabolic syndrome
The exercise, KD and exercise + KD interventions significantly (P < 0·05) decreased the Zmets, fasting blood glucose (FBG), waist circumference (P = 0·001 for all groups), TAG, systolic BP, diastolic BP, total cholesterol (P = 0·001 for all groups) and LDL (P = 0·001 for all groups). Moreover, these interventions significantly increased HDL (P = 0·001 for all groups) after 12 weeks. Between-group comparison showed that compared with control group, exercise + KD significantly decreased the Zmets (P = 0·002) and FBG (P = 0·049). Interestingly, exercise + KD significantly decreased FBG (P = 0·037) when compared with KD (Tables 1 and 2).
Efficacy of aerobic exercise and ketogenic diet on insulin resistance and sensitivity
The results showed that exercise, KD and exercise + KD significantly decreased the HOMA-IR (P = 0·001 for all groups) and insulin (P = 0·001 for all groups). Also, exercise, KD and exercise + KD significantly increased QUICKI (P = 0·001 for all groups) and the McAuley’s index. Between-group comparison showed that exercise + KD significantly decreased the HOMA-IR (P = 0·001) and insulin (P = 0·011), while significantly increasing QUICKI (P = 0·038) compared with the control group (Tables 1 and 2).
The results showed that AE and KD had no significant effect on the relationship between FM loss and FABP5 and RBP4 in the study groups. Only KD intervention had small but yet non-significant changes in the relationship between FM loss and FABP5 and RBP4 (Figs. 3 and 4).
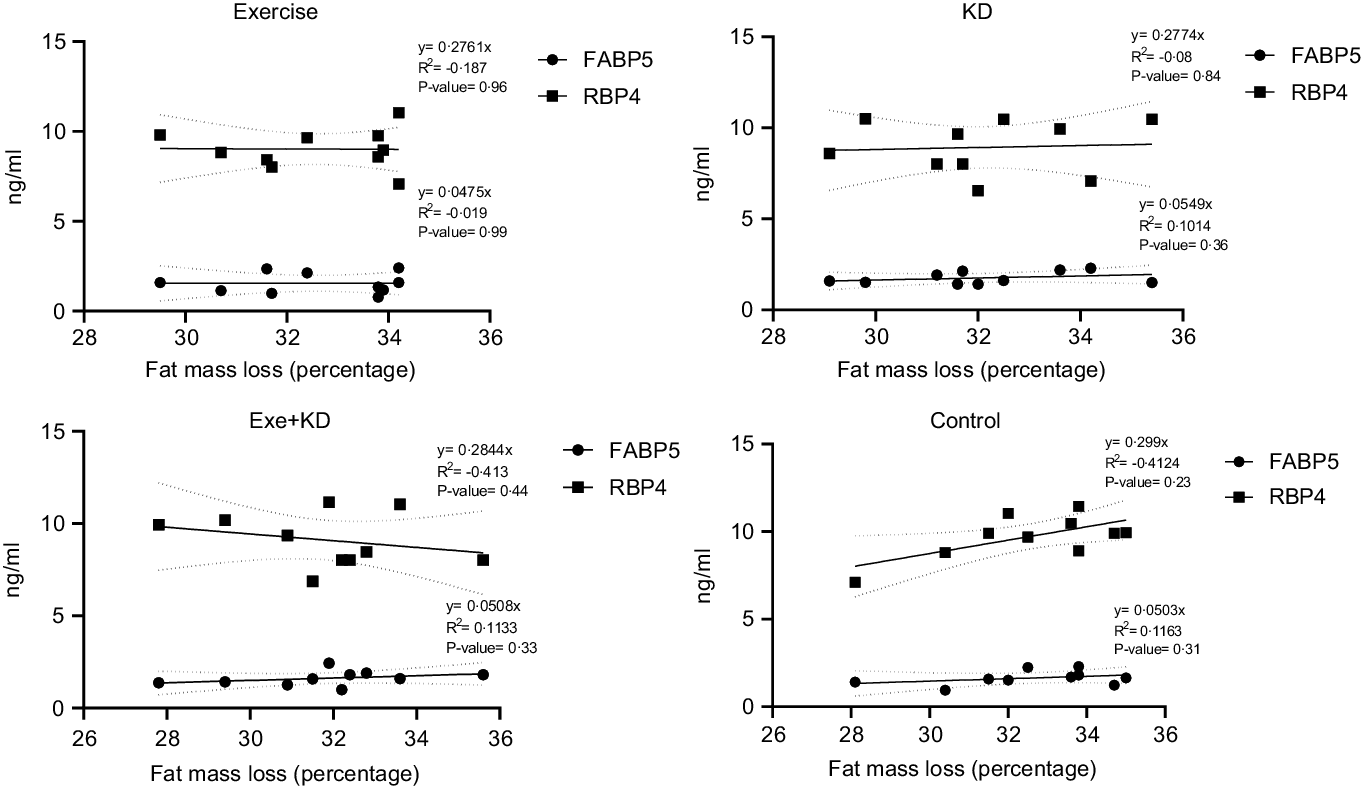
Fig. 3. Pre-test correlation between fat mass loss and FABP5 and RBP4 in the study groups. FABP5, fatty acid binding protein 5; RBP4, retinol binding protein 4.
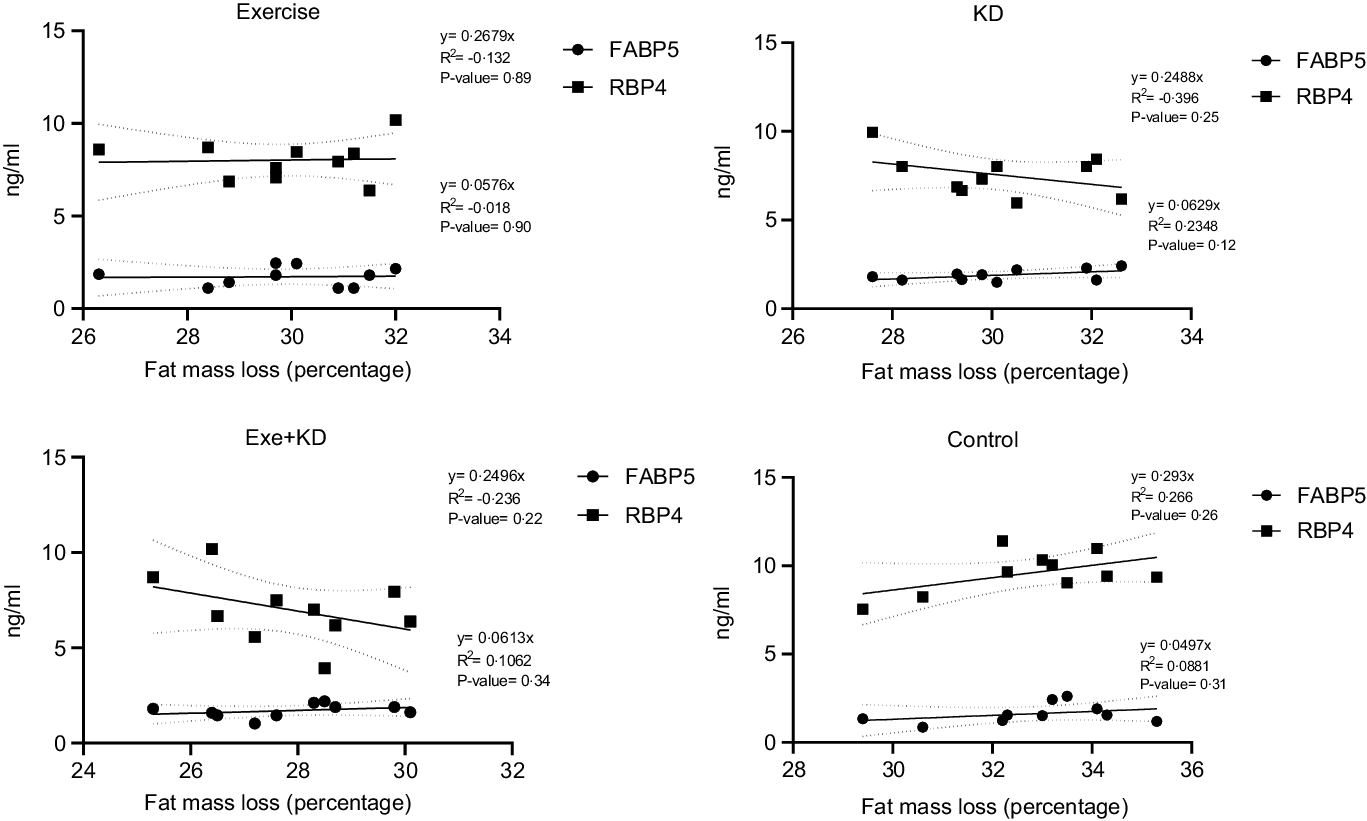
Fig. 4. Post-test correlation between fat mass loss and FABP5 and RBP4 in study groups. FABP5, fatty acid binding protein 5; RBP4, retinol binding protein 4.
Discussion
To our knowledge, this was the first investigation to assess the effects of dietary carbohydrate restriction and AE on RRBP4 on FABP5 levels in middle-aged men with MetS. We showed that after 12 weeks of intervention, exercise + KD improved body composition (BF), MetS factors (Zmets and FBG), insulin resistance (HOMA-IR and insulin), insulin sensitivity (QUICKI) and RBP4 levels in middle-aged men with MetS. Our study also revealed that exercise + KD significantly reduced FBG level compared with KD. Other interesting findings were that in within-group comparison, exercise intervention showed significant reduction in FABP5 level (P = 0·045). No adverse events were reported from the dietary carbohydrate restriction or AE intervention. Overall, the combination of dietary carbohydrate restriction and AE is an effective strategy for improving MetS in middle-aged men.
Continued escalation of MetS prevalence as a chronic progressive disorder have limited proven effective behavioural or pharmacological treatment options(Reference Hyde, Sapper and Crabtree1). Our results clearly show that carbohydrate restriction combined with AE improved RBP4 levels in middle-aged men with MetS. Moreover, AE improved FABP5 concentrations in our participants. Some authors encourage the results of our study. For intance, Volek et al. in a randomised, controlled, dietary intervention trial reported that serum RBP4 was associated with insulin resistance, and that a 12-week carbohydrate-restricted diet (% carbohydrate: fat: protein = 12:59:28) decreased this marker compared with a low-fat diet (% carbohydrate: fat: protein = 56:24:20) in subjects with atherogenic dyslipidemia(Reference Volek, Phinney and Forsythe31). In addition, Numao and et al. showed that performing 12-week AE (brisk walking, mild jogging and/or aerobic dancing) and 15–25 min recreational and cool-down activities (50–70 % maximal heart rates; 3 times/week) resulted in a reduction in circulating RBP4 concentrations in middle-aged obese men(Reference Numao, Sasai and Nomata29). Moreover, Delbari et al. in a parallel group-controlled trial showed that 8 weeks of AE had no significant effect on plasma levels of FABP5 in normal-weight and overweight women(Reference Delbari, Fathi and Talebi Garakani32). The discrepancies between these outcomes and our findings may be related to reductions in body weight and body fat percentage with AE training, changes that were not present in the study by Delbari et al. Because elevated adiposity levels have been associated with altered adipokines levels(Reference Balistreri, Caruso and Candore33), our findings indicate that a decrease in adiposity may have play a role in the FABP5 improvement in our participants. This decrease in adiposity may be related to greater AE training volume (12 v. 8 weeks) in our study compared with that of Delbari et al. Additionally, our participants had a greater weight and BMI (obese middle-aged men with MetS v. Normal-weight and overweight women) indicating a higher exercise-induced energy expenditure, which enhances body weight and fat loss.
We also observed significant reductions in body fat percentage, weight and BMI in our KD and aerobic+KD groups which reinforces the notion that KD are effective for improving body composition. Ashtary-Larky et al. in a review study demonstrated that the FFM preserving effects of KD are more efficient in sedentary individuals with obesity after endurance training because of the appetite-suppressive effects of KD(Reference Ashtary-Larky, Bagheri and Bavi34). Also, in agreement with our study, Vargas-Molina et al. established that after 8 weeks of KD, FM was significantly reduced in physicaly active women(Reference Vargas-Molina, Petro and Romance35). The efficacy of KD on body composition is related to predisposing factors, and its possible mechanisms are reductions of energy intake and appetite as well as an increase in daily energy expenditure(Reference Ashtary-Larky, Bagheri and Bavi34) leading to an enhanced lipid metabolism and decreased TAG storage(Reference Ma, Huang and Tominaga36). Research to date also indicates that a higher insulinemic response to meals may increase food intake and KD may reduce appetite by decreasing insulin concentrations(Reference Holt and Miller37–Reference Westman and Volek39). Interestingly, Lee et al. reported that central FM reduction and concomitant improvements in insulin sensitivity are associated with an about 25 % serum RBP4 levels decrease in non-diabetic individuals with obesity(Reference Lee, Lee and Shim40), which agrees with our findings of concurrent declines in RBP4, body fatness and insulin levels. It also appears that the beneficial effects of KD on body composition when concurrent with AE are due to shifting fuel utilisation towards greater fat oxidation during AE(Reference Ashtary-Larky, Bagheri and Bavi34). Additionally, during AE, exogenous fatty acids oxidation is an important source of energy(Reference Lundsgaard, Fritzen and Kiens41). Elevated ketone bodies, resulting from the KD, may provide a supplemental fuel source to sustain endurance exercise(Reference Durkalec-Michalski, Nowaczyk and Siedzik42). This suggests that performing exercise as a lifestyle factor is an important componed to facilitate body composition modulation during KD.
Insulin resistance is typically characterised by impaired sensitivity to insulin and a variability in insulin actions, which produces an attenuated biological response. Our results showed that exercise combined with KD significantly improved the HOMA-IR in middle-aged men with MetS. Previous studies have suggested that low-carbohydrate diets have beneficial effects on insulin resistance(Reference Ebbeling, Knapp and Johnson43,Reference O’Neill44) . For instance, Tay et al. mentioned that HOMA-IR was significantly reduced after 52 weeks of following very-low-carbohydrate diet in individuals with type 2 diabetes(Reference Tay, Luscombe-Marsh and Thompson45). Additionally, Maekawa et al. showed that 12 months of low-carbohydrate diet improved HOMA-IR in patients with impaired glucose tolerance(Reference Maekawa, Kawahara and Nomura46). In regard to exercise, Amanat et al. revealed that 12 weeks of aerobic training at 65–75 % of the maximal heart rate (HRmax) significantly reduced fasting insulin and HOMA-IR in overweight women with MetS(Reference Amanat, Sinaei and Panji47). Interestingly, in our study, the effect of both AE and KD was close to each other, and in the combined group, the effect of these two factors was potentiated. This finding emphasises the importance of combining KD and AE for improving insulin resistance in cohorts with MetS condition. It means that KD can be considered as a complementary factor for better effect of AE on middle-aged men with MetS.
We also showed that exercise combined with KD significantly improved the Zmets compared with exercise alone. In line with our results, previous studies have shown that low-carbohydrate diet(Reference Altooq, Aburowais and Alajaimi48) and physical activity(Reference Guio de Prada, Ortega and Morales-Palomo49) interventions improve the most prevalent MetS components, especially MetS Z-score (Zmets). Because the measures of interaction on the additive scale revealed that the combined effects of exercise and KD on Zmets were more than the sum of the individual effects, current results support their synergistic effect and importance for the control of MetS conditions. Our findings are also of clinical relevance, because improvements in Zmets lead to increases in quality of life in this population(Reference Azali Alamdari, Yavari and Azarian Sousahab50).
A possible mechanism for the effect of dietary control on metabolic conditions is nutrient sensing with insulin signalling(Reference Ost, Danielsson and Liden51). For example, it was proposed that RBP4 inhibits phosphorylation at the site of the insulin receptor substrate 1 that may be responsible for integrating nutrient sensing with insulin signalling(Reference Kotnik, Fischer-Posovszky and Wabitsch52). Phosphorylation of this site causes the recruitment of Janus kinase 2 (JAK2) and after that, recruiting and activating the transcription factors signal transducer and activator of transcription (STAT) 5 or, in a cell-dependent manner, STAT3(Reference Randolph and Ross53,Reference Rask and Peterson54) . It has been demonstrated that treatment of cultured adipocytes with RBP4 triggers phosphorylation of STRA6, activation of JAK2 and STAT5, and up-regulation of SOCS3, leading to suppression of insulin responses(Reference Kawaguchi, Zhong and Kassai55,Reference Krzyzanowska, Zemany and Krugluger56) . Notably, a ligand-controlled nuclear localisation signal role of FABP5 and interaction of this protein with STRA6 impair both the association of the binding protein with the receptor and STRA6-mediated vitamin A uptake(Reference Kawaguchi, Zhong and Kassai55). Interestingly, some studies showed that KD can also induce the circulating RBP4–STRA6 pathway signalling, which leads to the activation of Janus kinase/signal transducer and activator of transcription (JAK–STAT)(Reference Calibasi-Kocal, Mashinchian and Basbinar57). In addition to KD, performing AE can have affective intervention on RBP4 levels in middle-aged men with MetS, although limited information is available on the potential mechanisms of exercise on RBP4 levels. But in some studies mentioned that part of the changes in RBP4 levels in response to AE appear to be related to changes in body weight, especially body FM(Reference Graham, Yang and Blüher58–Reference Vitkova, Klimcáková and Kovacikova60). In another study, Azali et al. reported that a positive correlation was observed between fat content with liver fat and liver lipase enzyme activity with RBP4 levels in middle-aged women with MetS(Reference Azali Alamdari and Gholami27). This indicates that changes in liver fat metabolism and liver enzyme activity after regular AE may be possible factors in the reduction of serum RBP4 levels(Reference Azali Alamdari and Gholami27). Altered FABP5 expression as cellular binding proteins affects retinoid function from impairing pancreas development resulting in abnormal glucose and energy metabolism(Reference Napoli61), but the extent of FABP5 interactions with retinoid metabolon enzymes and their impact on retinoid physiology remains understudied.
There are several limitations to this work. It is clear from the previous literature and our results that KD improves MetS, but does this improvement occur independent of weight loss? Consequently, it can be useful to study the changes in these indicators at the same time as weight monitoring. Another limitation is that our study was conducted in male participants only. Although most studies reported that MetS is more prevalent in women than men, there are some investigations showing a higher incidence in men than women(Reference Njelekela, Mpembeni and Muhihi62,Reference Fezeu, Balkau and Kengne63) . Moreover, prior research showed that MetS was present in 23 % of men(Reference Beigh and Jain64). Therefore, our findings are relevant to a vast number of individuals. An additional limitation is the duration of our study (12 weeks). It is possible that longer durations could produce greater adaptations. Finally, our participants were middle-aged men with MetS, and thus our findings cannot be generalised to other populations.
Conclusion
Consistent with the pathologic state of MetS, our results show that compared with carbohydrate restriction and AE alone, an intervention combining carbohydrate restriction with AE improved RBP4, HOMA-IR as well as different body composition and MetS factors in middle-aged men with MetS.
Acknowledgements
This work has been financially supported by Azarbaijan Shahid Madani University under the grant number 99-400-1.
B. G. and A. I. conceived the study design and analysed the data. A. I. conducted the experiments and interpreted the data. A. I. wrote the initial manuscript drafts. B. G. and A. W. performed critical editing and writing. All authors approved the final version of the manuscript.
The authors declare no conflict of interest.


