

Despite the recognition of gender equality and the empowerment of women and girls as key goals for sustainable development and the progress made in recent years, gender differences persist and continue to be a major challenge for both developed and developing countries. Yet, we lack consistent and comprehensive summary measures for quantifying how much gender gaps have evolved over time and across space. Such measures are instrumental in deepening our understanding of the relationship linking gender equality and economic development in the long run.
Theoretical contributions have highlighted various mechanisms and channels through which gender equality fosters economic development, for example, fertility decisions, human capital formation, or as a source of productive workers, to list a few of them.Footnote 1 Among them, Diebolt and Perrin (Reference Diebolt and Perrin2013, Reference Diebolt, Perrin, Diebolt, Carmichael, Dilli, Rijpma and Störmer2019) argue that female empowerment and the movement toward greater gender equality were at the origins of the demographic transition and involved in the take-off of modern economic growth. More specifically, they point out that the evolution of family organization away from a clear division of roles toward greater equality between spouses has been a crucial ingredient of the transition to sustained economic growth. Yet few studies have explicitly considered the impact of gender equality on economic development from a historical perspective. Most evidence supporting the positive effect of gender equality on economic growth are based on modern data (e.g., Hill and King 1995; Dollar and Gatti Reference Dollar and Gatti1999; Klasen Reference Klasen1999, Reference Klasen2002; Seguino Reference Seguino2000; Knowles, Lorgelly, and Owen 2002; Klasen and Lamanna Reference Klasen and Lamanna2009; among others).Footnote 2 Although the literature on gender history is vast, contributions are typically based on qualitative evidence or are delimited to particular gender gaps, such as those concerning wages or education. The lack of consistent indicators capturing gender differences and/or similarities is one of the crucial reasons why we still know very little about the evolution of gender relations in the past, and therefore how much it contributed to the development process.Footnote 3
A few contributions have attempted to construct indices to capture the size of gender inequality in the past. The work of Perrin (Reference Perrin2014), which looked at the gender gap in France in the middle of the nineteenth century, was the first to propose the construction of such an index at the historical level; and then to investigate its association with economic development (Perrin Reference Perrin2022a). Using a similar methodology, Dilli, Carmichael, and Rijpma (Reference Dilli, Carmichael and Rijpma2019) constructed a gender equality index for a collection of 129 countries during the period 1950 to 2003. Despite these recent works, there has been a lack of macroeconomic appraisal of the various dimensions of the gender gap in the past.Footnote 4 Given the vast differences between the methods of statistical agencies at the national level for defining and measuring variables of interest, we believe that the most fruitful approach for research on the historical gender gap is to consider variation within countries and use sub-national entities as the main units of analysis. Moreover, the evolution of gender gaps over time at the national level may hide important variation within countries.
The current paper aims to contribute to this literature by providing a method for one country that could be generalized and applied to others at various geographic levels. In this endeavor, we investigate the case of Sweden, a particularly interesting country when it comes to the economic history of gender. On the one hand, Sweden is generally regarded as a leading country in the field of gender equality. Since the World Economic Forum launched its annual global gender gap report in 2006, Sweden, along with its Scandinavian neighbors, has consistently ranked among the top countries (4th in 2020 with a score of 0.82). On the other hand, it is well established that Sweden in the period 1870–1970 was among the fastest-growing economies in the world; in those ten decades, the country also experienced a sharp decline in fertility and the profound modernization of many aspects of society (Schön Reference Schön2007). The problem is that, while we know a good deal about economic growth in Sweden’s history, we have only a dim idea of what the long-term development of gender equality may have looked like. Although we may assume that Sweden began to take substantial steps toward closing the gender gap and emerging as an international role model in the second half of the twentieth century, we know very little about how the gender gap, broadly defined, evolved over time.Footnote 5 How have various components of the gender gap been related? Has the closing of the gender gap been a uniform pattern across the country, or were particular regions spearheading the development? Has increased gender equality been associated with economic growth at the regional level?
The purpose of this paper is to assess the long-run evolution of gender roles and relations in Sweden by constructing a spatial Historical Gender Gap Index (HGGI). We have collected and digitized an important set of data on the various dimensions of gender equality—over time and across space. The index covers the 1870–1990 period in 10-year intervals and provides information for the 24 Swedish counties (NUTS-3 regions). We use a disaggregated approach that has the advantage of offering a better appraisal of the differences existing within large macroeconomic entities. Accordingly, we are able to capture the diversity and size of the gender gap within Sweden during a key phase characterized by industrialization, urbanization, and demographic transition. The construction of the index allows us to track the evolution of gender equality over 120 years and identify the strengths and weaknesses of Sweden in closing the gender gap. Additionally, our paper contributes to the literature by providing an empirical exploration of the long-run relationship between gender equality and economic growth.
The article is organized as follows. First, we set up the scene by providing a contextual background and presenting some of the main characteristics of the Swedish counties. Second, we present the data and method used to calculate the Swedish spatial HGGI. Third, we present the national index, its spatial distribution, and discuss convergence over time and across space. Fourth, we investigate gender outcomes and their implications for economic development. Finally, we sum up the main results and open the discussion on future research.
SETTING THE SCENE – SWEDEN AND ITS COUNTIES
Economic Growth, Democratization, and the Welfare State
Extensive research has been conducted about Swedish economic growth. Swedish historical national accounts go back as early as the sixteenth century (Edvinsson Reference Edvinsson2005; Lobell, Schön, and Krantz Reference Lobell, Schön and Krantz2008; Schön and Krantz Reference Schön and Krantz2012) and at the regional level have been advanced to account for regional trends with the elaboration of estimates (Enflo, Henning, and Schön Reference Enflo, Henning and Schön2014; Enflo and Missiaia Reference Enflo and Missiaia2018).
Sweden was one of the world’s fastest-growing economies between 1870 and 1970, concurrently undergoing a steep reduction in the birth rate and thoroughgoing social modernization (Magnusson Reference Magnusson2000; Schön Reference Schön2010). In the mid-nineteenth century, Sweden was still a predominantly rural society that had experienced some decades of rapid population growth and pronounced agricultural reforms. The demographic transition had begun with decreasing levels of infant and child mortality, resulting in growing numbers of adults without access to land. The population structure was also influenced by huge-scale migration across the Atlantic, which peaked in the 1880s but remained substantial until the 1920s. Apart from reducing the population pressure, migration also skewed the age structure and sex ratio, as prime-age men were overrepresented among the migrants (Sommestad Reference Sommestad1998). Simultaneously, a growing demand for oats and timber from England and other advanced countries stimulated the country’s early resource-based industrialization, which toward the turn of the century became increasingly focused on products with higher value added. Meanwhile, the internal market for consumer goods was expanding as farmers benefited from enclosures and increased opportunities to participate in export production.
Nineteenth-century Sweden has been described as “the impoverished sophisticate” (Sandberg Reference Sandberg1979), that is, a poor country with remarkably high levels of literacy and sophisticated capital market institutions. Another defining feature of social development in the nineteenth century was the spread of popular movements, of which the revivalist, temperance, and labor movements are most often thought of (Lundkvist Reference Lundkvist1977). Women could and did participate in the revivalist and temperance movements, and to a lesser extent, in the labor movement. The Swedish women’s movement was less radical than its English counterpart; female suffrage was not achieved until 1919 (Holgersson and Wängnerud Reference Holgersson and Wängnerud2018; Östberg Reference Östberg1997). Still, leading advocates of the Swedish women’s movement achieved some influence in existing parties and made important advances in the 1920s and 1930s (Jonsson and Neunsinger Reference Jonsson and Neunsinger2011). Among the important signs of progress, the employment restrictions for married women in the public sector were lifted in 1925, and in 1939, a more general prohibition of marriage bars was introduced (Frangeur Reference Frangeur1998).
However, Sweden was not spearheading the movement toward democracy (Bengtsson Reference Bengtsson2019). Initially, democracy was associated with political instability. Weak minority governments replaced one another until 1932, when the Social Democrats and the Farmers Party struck a deal that is thought to have laid the foundations for major welfare reforms. While some early reforms were launched in the 1930s, including opening up secondary education for girls, the major expansion of the Swedish welfare state ensued after WWII. Some of these systems, such as child-care provision, helped to free the female labor force, but only after a substantial lag (Nyberg Reference Nyberg2000). The public sector also became the major employer of women, especially after the decline of the female-dominated textile and garment industries in the 1950s and 1960s. A notable institutional reform in this era, indicating the dual breadwinner norm that came to characterize the Swedish welfare state, was the introduction of separate taxation for husbands and wives in 1971 (Gustafsson Reference Gustafsson1992).
Sweden in Gender History
The past 40 years have seen an upsurge in gender history in Sweden (Nyström Reference Nyström2015). While this academic field had early connections with quantitative social history (cf. Göransson Reference Göransson1988), its mainstream, following the influential work of Yvonne Hirdman (Reference Hirdman1990), has had a clear theoretical flavor, centered on the study of power relationships and discourses.Footnote 6 With some notable exceptions, most of this research has been qualitative in nature and not aimed at creating long-time series.
While Swedish gender history has been tilted toward the past two centuries (Fiebranz et al. Reference Fiebranz, Lindberg, Lindström and Ågren2011), there is also substantial literature on the pre-historical, medieval, and early-modern periods. Ideas on the role of women in the Viking age, reflecting contemporary norms, have shifted over time from women being depicted as housewives in the late nineteenth century to the current emphasis on their relative independence (Arwill-Nordbladh Reference Arwill-Nordbladh1998; Borgström Reference Borgström2002). The early-modern period saw the emergence of Sweden as a great regional power. From this era, there is at least patchy evidence of how women could transcend traditional gender boundaries and undertake male jobs (Lindegren Reference Lindegren1980; Lindström et al. Reference Lindström, Karin Hassan Jansson, Jacobssson and Ågren2017; Gary Reference Gary2018). Toward the latter part of the early-modern era, however, women’s opportunities as economic and political agents were restricted. For example, the Civil Code of 1734 placed Swedish women under the coverture of their husbands (Sweden 1874). The general franchise was extended to women only in 1919 (Florin and Kvarnström 2001).
Comparative quantitative research on gender history is rare. A bold and recent exception is Buckwalter and Baten’s (2019) review of archaeological evidence from the Viking and medieval periods. Based on skeleton remains, the authors argue that Scandinavian women had better nutrition and health relative to men than women had in other parts of Europe, a difference to which they attribute the importance of cattle farming. This explanation aligns with the view of Esther Boserup (Reference Boserup1970) and more recent studies (Alesina, Giuliano, and Nunn Reference Alesina, Giuliano and Nunn2013), suggesting that variation in gender inequality across modern societies and individuals has deep historical roots. It is not a line of thought that has been pursued in the fairly rich strand of comparative welfare-state research with a gender focus. According to Lewis (Reference Lewis1992), the most influential writer in this field, Sweden did not enter its distinctive path toward a “dual-breadwinner model” until the late 1960s and early 1970s.Footnote 7 In this account, three reforms were of particular importance for boosting female participation in the labor force, namely, separate taxation, the expansion of public child care, and parental insurance. Lewis’ explanation is political, emphasizing the role of Social Democratic governments. Sommestad (Reference Sommestad1997, p. 174) shifts attention to the inter-war period as the formative years of the “comparatively gender-neutral model of citizenship,” under the influence of a perceived population crisis caused by emigration and low fertility levels. In this context, Swedish politicians became more receptive to ideas of a universal welfare state, most forcefully advocated by Alva and Gunnar Myrdal. The explanations of Lewis and Sommestad are, to some extent, complementary and share an understanding of Swedish gender equality as a twentieth-century phenomenon. Their accounts are centered around the national level. However, Sommestad (Reference Sommestad1997, Reference Sommestad1998) put more emphasis on economic and demographic forces and traces the origins of the dual-breadwinner model further back in time, to the early twentieth century. According to Sommestad (Reference Sommestad1998, p. 108), “a predominant feature of the Swedish society [at the turn of the 19th century] was the comparative weakness of male breadwinning practices.” Referring to the evolution over time and focusing on non-farm employment, Stanfors and Goldscheider (Reference Stanfors and Goldscheider2017) have, however, argued for Sweden’s remarkable similarity to the United States until the 1960s.
Sweden and Its Regions
Sweden is a sparsely populated country. It covers a huge area, including areas where the soil quality and climate zones vary; some parts show historical concentrations of land ownership while others were dominated by self-owning farmers. Situated as it is on a north-south axis, it is reasonable to assume that it would have generally varied economic and social structures and that these might have implications for the gender gap in some regards.
Our account of the development of the HGGI has two levels of analysis: Sweden as a whole and its 24 individual counties. The county organization, which was established for administrative reasons in the seventeenth century, was largely stable from 1810 onward. Previous researchers have frequently used the county-level of observation (equivalent to NUTS-3 regions) in an aggregated way by focusing on the three “lands”: Norrland (the north), Svealand (the east), and Götaland (the west). An influential example of this is found in Emigrationsutredningen (1908), where the geographer Gustav Sundbärg observed distinct demographic patterns in the three lands. Historically, Svealand, in particular the east-central part (the counties surrounding Stockholm), has been the most affluent part of the country (Söderberg Reference Söderberg1993). Agriculture in the east-central region and in the southernmost part of the country (Malmöhus), was to a greater extent than elsewhere, dominated by manors and focused on crop production. Farming in northern Sweden, whose interior was not colonized until the eighteenth and nineteenth centuries, was diversified and more based on cattle rearing. Götaland and western Sweden in particular, enjoyed an upswing in the early half of the nineteenth century, manifested in the large-scale export production of oats. East-central Sweden regained its position as the most dynamic part of the country when the process of industrialization took off in the second half of the century (Söderberg Reference Söderberg1984). This period also saw growth in the south (Malmöhus) and the north of the country. Striking features of early industrialization in Sweden were its spatial diffusion and rural character. Early industrialization was to a great extent built upon the exploitation of natural resources, such as timber in the north (the counties of Gävleborg, Västernorrland, Västerbotten, and Norrbotten) and iron in Bergslagen. The textile industry, which produced goods for the domestic market, had its center in Älvsborg, in western Sweden, whereas the mechanical engineering industry was more important in east-central Sweden. Although known for its glass works, south-eastern Sweden was for a long time relatively untouched by industrialization and urbanization.
The second phase of industrialization, beginning around 1900 and completed around 1930, was associated with relative decline in the north of Sweden, as well as in the larger cities, when low-wage industries moved to regions with cheaper labor (Berger, Enflo, and Henning Reference Berger, Enflo and Henning2012). The first half of the twentieth century put an end to the rural character of Swedish industry. In 1900, 60 percent of manufacturing employment was found outside cities (Berger, Enflo, and Henning Reference Berger, Enflo and Henning2012). In 1953, the proportion was 47 percent, and it was much lower for industries such as metalworking and machinery.
Quite a few pieces of ethnographic evidence suggest regional differences in women’s work. It has, for example, been observed that in the grain-producing areas dominated by manors, women were more confined to the home (Nyberg Reference Nyberg1987). Taking care of cattle, and milking in particular, was often considered a “female” task (Sommestad Reference Sommestad1994). So far, few researchers have quantitatively explored and analyzed the evolution of gender roles and regional economic development in Sweden. The main exception is Schultz (Reference Schultz1985), who exploits regional differences in agricultural production to analyze the relationship between labor demand and fertility in the period 1860–1910.Footnote 8 Schultz uses the relative prices of animal products and grains to identify changes in the demand for women’s labor at the county level and finds that higher butter prices coincided with a reduction in the birth rate.
The relatively limited investigations conducted at the regional level might reflect the fact that Sweden in the latter half of the twentieth century appeared to be a highly centralized country. In fact, centralization is sometimes presented as a defining feature of the Swedish Model (Magnusson Reference Magnusson2000). Yet this may be a matter of writing history backwards. Given the geographical variety within Sweden, both in terms of natural resources and socio-economic structure, analysis at the regional level may have untapped potential.
CONSTRUCTION OF THE HISTORICAL GENDER GAP INDEX
Method
The HGGI is constructed in line with the historical index developed by Perrin (Reference Perrin2014, Reference Perrin2022a) for France in the mid-nineteenth century. The method, inspired by the Global Gender Gap Index launched by the World Economic Forum in 2005 (Hausmann, Tyson, and Zahidi Reference Hausmann, Tyson and Zahidi2006), provides a comprehensive measure of gender equality that can easily be compared with other variables, such as economic, demographic, or cultural variables.
The index focuses on gender differences by measuring the gaps between men and women. All variables are converted into female-to-male ratios. Perfect gender equality is 1 on all variables except on the health variables. In human societies, the sex ratio varies according to the age composition of the population and may also be affected by environmental and social factors. The natural sex ratio at birth is close to 1.06 males per 1 female (Grech, Savona-Ventura, and Vassallo-Agius Reference Grech, Savona-Ventura and Vassallo-Agius2002). To correct for this natural difference, the sex ratio is rescaled to one. A similar process is applied to account for the natural gender differentials in longevity.Footnote 9 All ratios are then truncated to one to assign the same score to a county that has reached parity between women and men and to a county where women have surpassed men.
The Swedish HGGI captures gender differences along three dimensions reflected within the economic, health, and political sub-indices. The sub-index scores are obtained by calculating the weighted average of the variables within each sub-index.Footnote 10 The weighting process ensures that the variables within each sub-index are given the same relative importance. Accordingly, variables for which there are greater variations over time and across space do not weigh more heavily than variables that do not vary as much.Footnote 11 The final score is calculated as a simple average of the three sub-index scores. The HGGI is bounded between 0 and 1. The value 0 corresponds to perfect inequality; 1 corresponds to perfect equality.
Data
Our database consists of transversal and longitudinal data. It covers information about the 24 Swedish counties in the period between 1870 and 1990, when the borders between the counties remained unchanged and for which we have access to recurring population censuses.Footnote 12 The censuses constitute an important source of material for capturing regional variations. In addition, we have made use of other official publications, such as statistics on population and manufacturing industry, which are available from the nineteenth century onward and often contain detailed information by gender. Thanks to Sweden’s data, we can provide an overview of gender disparities in three critical areas: economic participation and opportunities, health and survival, and political empowerment.13
The economic sub-index includes aspects such as labor force participation and wages. Male and female labor force participation is estimated based on information from population censuses. The variable is defined as the number of women (men) with gainful employment divided by the female (male) population aged 15 and over.Footnote 14 To assess the gender wage gap, we use two sources. For the years 1870 to 1920, relative hourly wages are constructed using agricultural wage data. Over this period, Sweden remained dominantly agrarian, although the industrial sector slowly started to grow. Starting in 1930, wages are calculated using information from manufacturers.Footnote 15 We use the number of total work hours to calculate the weighted average of wages paid in different industries. Data on wages are not available for every point in the period under consideration. Consequently, the wages for the years 1930, 1950, and 1960 correspond to the closest available information, namely, 1931, 1949, and 1962, respectively.
The health sub-index incorporates information about crude mortality rates and live births. The rates are calculated as the number of deaths per thousand people.Footnote 16 We use a second measure to assess the gap in health: female-to-male live births, defined as the number of girls born alive divided by the number of boys born alive. This measure aims to assess parents’ relative preference for boys over girls. In certain economic and cultural contexts, unbalanced sex ratios can reflect practices such as female infanticide (and/or mortal neglect of young girls).
The political sub-index is difficult to include in a historical assessment of the gap between men and women. However, our period of investigation includes the major extensions of the franchise in 1918–1919, after which most men and women earned the right to vote and be elected at the municipal level. We use data on men and women elected in municipal elections (kommunala val) to capture the political participation of women relative to men. These elections took place every fourth year after 1922 and every third year after 1970.
Table 1 reports the descriptive statistics of the variables used in the construction of the gender gap index. The share of individuals working has evolved substantially over time and across space. Despite these substantial evolutions for both genders, men over the studied period remained dominant in the labor market. On average, 80.5 percent of men were working, compared to 33 percent of women. The labor force participation rate spreads from a minimum of 20 percent (in Gävleborg, 1890) to a maximum of 60.8 percent (in Stockholm, 1990) for women, and from a minimum of 59 percent (in Jämtland, 1980) to a maximum of 93 percent (in Stockholm, 1910) for men. The upper row the entire period, from a minimum score of 0.43 (in Västerbotten, 1870) to a maximum of 0.96 (in Gotland, 1990).
SUMMARY STATISTICS – VARIABLES USED IN THE CONSTRUCTION OF THE SUB-INDICES

Notes: Statistics about wages in agriculture and industry concern the periods 1870–1910 and 1930–1950, in turn.
Sources: Using data from SCB.
Regarding the health and survival variables, Table 1 displays relatively similar mortality rates and numbers of live births between men and women, both being on average relatively close to gender equality, with lower heterogeneity across counties than can be observed for other variables. Yet gender differences exist. Hence the (inverted) female-to-male mortality spreads from a minimum of 0.83 (in Skaraborg in 1940) to a maximum of 1.34 (in Västerbotten in 1970); and the female-to-male births from 0.86 (in Jämtland, 1880) to 1.05 (in Halland, 1930). The highest female mortality rate is found in 1870 in Norrbotten, while that of males is found in Stockholm the same year. Turning to political empowerment, the overall average of female-to-male elected is very low, with an average score of 0.10 over the period of interest. The ratio, however, substantially increased over time and across space to reach a maximum of 0.73 in Stockholm in 1990, namely a representation of 73 women for 100 men.
SWEDEN’S STRENGTHS AND WEAKNESSES IN CLOSING THE GENDER GAP
Longitudinal Evolution
Figure 1 presents the evolution of the HGGI at the national level between 1870 and 1990. The long-run evolution of gender equality in Sweden follows a hockey stick shape, reflecting the impressive progress made by Sweden to close the gender gap during the second half of the twentieth century.
HGGI NATIONAL—WEIGHTED BY THE POPULATION SIZE OF COUNTIES
Sources: Authors’ calculations using data from SCB.
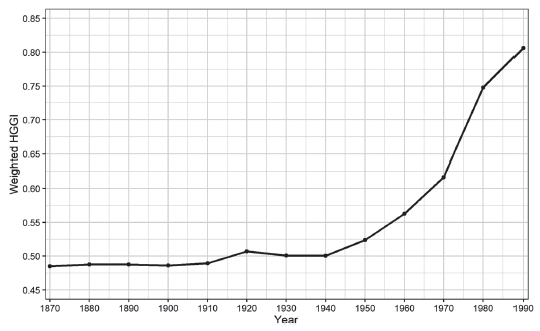
Over time, the average level of gender equality in Sweden increased from 0.485 in 1870 to 0.806 in 1990. This means that the index increased by more than 0.32 units during this period, corresponding to a 66 percent increase. Two main periods can be identified: (i) a period of stagnation between 1870 and 1940; and (ii) a period of continuous increase in the HGGI from 1940 onward. The increase in the 1910s was a temporary deviation from the overall pattern of stagnation in the first period, the shaft of the hockey stick. In the second period, the blade of the hockey stick, we observe that the rate of increase was accelerating to reach a peak in the 1970s.
Sweden, in fact, displayed relatively large gender inequalities until the 1940s. At the end of the 1930s, it had closed only 50 percent of its gender gap. The timing suggested by Figure 1 is interesting in the light of previous research, particularly the views of Lewis (Reference Lewis1992) and Hirdman (2012), according to which the major take-off for gender equality was seen in the late 1960s and early 1970s. Although it is true that the pace of change seems to have accelerated around this time, Figure 1 also shows that Sweden’s path toward closing the gender gap began earlier. Policies specifically oriented toward women’s participation in the labor force increased after WWII. This period during which Sweden made significant improvements in closing the gender gap coincides with the golden age of the Swedish Social Democratic Party from the mid-1930s to the mid-1980s.Footnote 17
However, major structural changes contributed to expanding women’s opportunities on the labor market. As the economy underwent a phase of rationalization with the introduction of Fordist modes of production in the 1950s and 1960s, relatively low-skilled labor was in high demand (Schön Reference Schön2010). Employers were turning to women and migrants to fill vacant jobs. Women were also employed in the growing public sector as nurses, schoolteachers, and social workers. In many ways, jobs that had once been performed by women at home without pay became formal waged work. As argued by Svensson (Reference Svensson1995), these structural changes contributed to a compressed gender wage gap along with higher rates of female participation in the labor force.
Furthermore, radical reforms addressing gender inequality issues were implemented in the 1960s and 1970s.Footnote 18 The reforms aimed notably to further encourage women to participate in the labor market, as well as make it easier for women to combine paid work and family life. The policies in favor of a better integration of women into the public sphere—accounting for measures such as the abolition of joint taxation in 1971 (Gustafsson Reference Gustafsson1992; Selin Reference Selin2014), the introduction of publicly financed daycare for children (Gustafsson and Stafford Reference Gustafsson and Stafford1992), and sex-neutral parental leave (see Gunnarsson and Svensson Reference Gunnarsson and Svensson2009)—are commonly referred to when explaining the rapid progress made by Sweden in closing the gender gap in economic participation (although their causal effects have not yet been established). During the same period, effective contraceptives became available (oral contraception from 1964; IUDs from 1966), and the Abortion Act, stating that the choice of an abortion is entirely up to the woman until the end of the eighteenth week, was signed in 1974.
The overall gender gap performance is a synthesis of performances across the three dimensions composing the index, measuring economic participation, health and survival, and political empowerment, but it masks potentially significant differences in the gender gap between the dimensions. Figure 2 presents the evolution of gender gaps across the three dimensions. The gender gaps vary significantly from one dimension to another.
HGGI SUB-INDICES—WEIGHTED BY COUNTIES’ POPULATION SIZE
Sources: Authors’ calculations using data from SCB.

The economic sub-index shows a slow but steady increase until 1930, when it temporarily falls and then starts to increase again from 1940 at an accelerating pace. The temporary setback in the 1930s is mainly explained by the relatively lower rates of female participation in the labor market that reached a low point in 1950 (see Figure C3 in the Online Appendix). This trend was neither due to the opening up of secondary schooling for women nor the result of a widespread introduction of marriage bars,Footnote 19 but was mainly driven by population aging and a higher share of married women (Silenstam Reference Silenstam1970, p. 43). Participation rates among married women increased in the 1930–1950 period, although at a slow pace (Silenstam Reference Silenstam1970, p. 57). Relative wages, the other component of the economic sub-index, remained stable in the 1930s but increased substantially thereafter. What happened in the 1940s was probably the result of a general wage compression during WWII, whereas the 1950s saw more explicit policies for eliminating gender wage discrimination from collective agreements. General wage compression reappeared in the period from the 1960s to the early 1980s. This time, wage compression was initially driven by an increased demand for unskilled labor and later by the so-called solidaristic wage policy adopted by the labor market parties (Svensson Reference Svensson1995; Molinder Reference Molinder2019).Footnote 20
The health and survival sub-index displays remarkably high and stable values over the entire period. Looking at the components of the sub-index separately (see Figure C2 in the Online Appendix), we note a small decrease in the mortality ratio in 1930, while the ratio of women’s and men’s death rates remained stable despite the sharp increase in mortality rates caused by the Spanish flu pandemic that affected Sweden in 1918–19.Footnote 21
The temporary increase in the overall index observed in 1920 is explained by the progress of political empowerment, reflecting the rise in the number of females elected to municipal councils made possible in 1919.Footnote 22 As can be seen in Figure 2, the ratio declined to a lower level in 1930, which, according to Österberg (1997), can partly be explained by the fact that some women left their commissions or decided not to run for re-election. This suggests that early female politicians may have faced hostility from their male colleagues. However, this momentary decline in female empowerment was brief, and from 1940 on, female political empowerment grew steadily and fast, reaching 0.54 in 1990. However, a closer look at the municipal assemblies reveals that men still hold most of the higher positions nowadays. In 2019, for example, men chaired 68 percent of the municipal boards (SCB 2020, p. 53). Although the composition of most Swedish governments since 1994 has been characterized by gender parity, it took until 2021 for Sweden to have its first female Prime Minister.
Contrary to what many may assume, Sweden has not always been as equal as it is today and may not always have acted as a forerunner. Comparing the economic participation sub-index of Sweden in 1870 to that of France in 1851 (provided by Perrin (Reference Perrin2014)), we observe that while Sweden scored 0.46 in 1870, France was already scoring 0.605 in 1851—a level that Sweden reached only in the 1960s. Gender equality has evolved dramatically in Sweden during the twentieth century. The clear improvements made by Sweden to close the gender gap started in the 1940s, before institutions and policies started to actively support women. Progress appears to have been driven by both greater equality in economic participation and political empowerment.
Spatial Distribution
After the 1940s, all counties made astonishing progress in closing the gender gap. Policies favorable to gender equality are likely to have contributed to leveling out regional differences. Figure 3 presents the geographical distribution of the HGGI across the Swedish counties over the two periods under review.
HGGI BY COUNTIES
Sources: Authors’ calculations using data from SCB.

All Swedish counties follow a similar trend to that observed at the national level, as shown by Figure 3. However, some counties changed their relative positions. Stockholm, for example, went from being a laggard to becoming a leader on gender equality. In 1870, Stockholm displayed one of the lowest HGGI scores (0.47)—together with Gotland, Uppsala, and Västmanland. From there, Stockholm progressed continuously and became the clear leader from 1940 onward. Stockholm’s leadership is mainly explained by its high score on the political sub-index. In 1990, Stockholm scored 0.87, almost 7 percentage points higher than the national average.Footnote 23
Conversely, Älvsborg, which had ranked first in 1870 (with a score of 0.51), progressively lost its leadership and ranked 19th (out of 24) in 1990 with a score of 0.78. The strength of Älvsborg originates from its top score in the economic participation sub-index, followed by Malmöhus and Göteborg och Bohus, which ranked second and third, respectively. The importance of the textile industry in Älvsborg, known for intensively relying on a female labor force, can explain the high score made by this county.Footnote 24 Only from the 1960s did other counties, such as Jämtland or Gotland, catch up and outperform Älvsborg. Unlike Stockholm, which always scored high in political empowerment, Älvsborg scored relatively poorly, and its ranking worsened over time, clustering at the bottom of the list with Jönköping, Kristianstad, Kronoberg, Skaraborg, and Malmöhus.
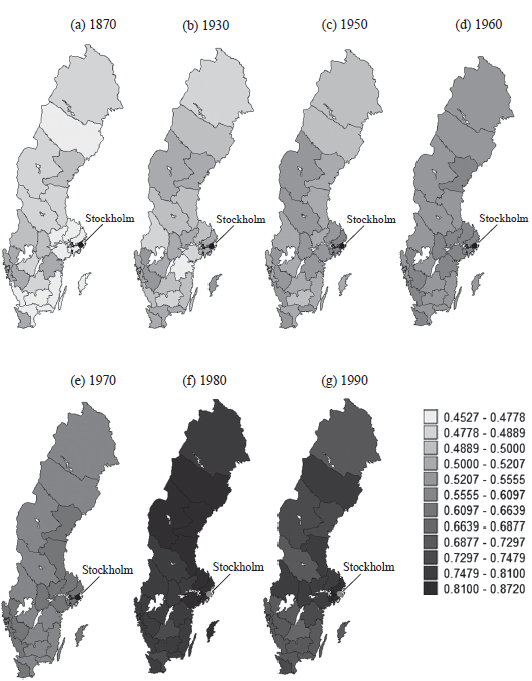
The contrasting evolution of Stockholm and Älvsborg reflects the existence of diversity in the trajectories taken by different counties and confirms the need to take the spatial dimension into account. These differences can be observed in more detail in Figure 4. The figure presents the distribution of the HGGI across Sweden and shows its evolution over time. The darker counties reflect higher gender equality. The maps become darker over time, reflecting the strong effort made by Sweden to close its gender gap. The darkness gets more intense from 1970 onward, when the pace of progress increases faster. Despite the clear trends toward greater gender equality, the maps reveal the existence of differences in the distribution of the index across Swedish counties.Footnote 25 At the beginning of the period, some counties were clearly scoring better than others. Älvsborg led, followed by Malmöhus, Göteburg och Bohus, and Östergötland. Later, in 1930, other counties started to emerge. This is notably the case with Gotland, Jämtland, Stockholm, and Skaraborg—though Älvsborg kept its top position, starting to slowly lose it only in the following decades. Then Stockholm took the lead and kept it all the way through 1990. Stockholm was then followed as leader by Jämtland, Småland, Västernorrland, Gävleborg, and Västerbotten.
DISTRIBUTION OF THE HGGI
Notes: The intervals are calculated based on the percentile distribution of the HGGI’s scores over time and across space and merged into 12 classes. Less gender-equal counties (areas where the index scores are the lowest) appear in lighter colors; more gender-equal counties (areas where the index scores are the highest) are depicted in darker colors.
Sources: Authors’ calculations using data from SCB.
Trends and Regional Patterns
Was there convergence across Swedish counties toward greater gender equality in the long run? We rely on two measures of regional convergence: the β and σ convergences. The β-convergence measures the inclination of less gender-equal counties to catch up with more gender-equal counties. The σ-convergence measures the spread of gender equality levels over time. A declining σ coefficient reflects the decline of the dispersion of the gender gap.
Figure 5 offers evidence for the presence of convergence between Swedish counties. The figures on the upper row relate the growth rate of the counties’ sub-index over the 1870–1990 period (vertical axis) to their starting value in 1870 (horizontal axis). The analysis of the β-convergence shows that counties that were performing best at the beginning of the period displayed lower growth rates over time. Stockholm is undoubtedly the county that made the most and quickest progress, with a 0.98 percent annual growth rate of its HGGI between 1870 and 1990. The negative slope of the line is remarkably sharp for all sub-indices. The economic sub-index displays the highest R-square value: 0.96. The analysis of the σ-convergence (lower-row figures) is similarly eloquent. All counties made substantial progress in closing their gender gaps, and the differences between counties drastically declined over time. The negative slope of the economic sub-index confirms the occurrence of a convergence process between Swedish regions during the periods under study.
BETA-CONVERGENCE AND SIGMA-CONVERGENCE OF THE SUB-INDICES
Sources: Authors’ calculations using data from SCB.
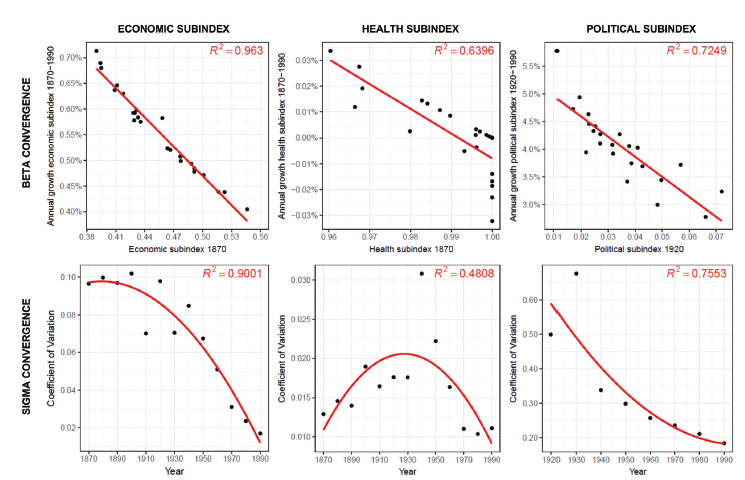
The σ-convergence shows that the process of convergence reduced regional gender inequalities more quickly after 1940. The fast progress of women’s economic participation and political representation is illustrated by the strong decline in the coefficients of variation from high values to lower values.Footnote 26 An inverted U-shape—with a decline in variation from 1940—is noticeable in the case of the health gap, but the overall variation of this sub-index is extremely small. These results align surprisingly well with the convergence process observed by Enflo and Rosés (Reference Enflo and Rosés2015) in the case of Swedish regional incomes, in particular with the 1940–1980 period during which these authors identify a strengthening of regional convergence.Footnote 27
GENDER OUTCOMES AND IMPLICATIONS FOR ECONOMIC DEVELOPMENT
The convergence analysis confirms that regional inequalities decreased significantly in Sweden from 1940 onward. A combination of various ingredients is certainly at the heart of the patterns observed over time and across space. In this section, we explore the links between gender equality and economic development during Sweden’s modernization. Empirical analyses of the relationship between gender equality and economic growth based on modern data present asymmetrical associations. Evidence that gender equality contributed to economic growth appears more consistent and more robust than evidence that economic growth contributed to gender equality (Kabeer and Natali Reference Kabeer and Natali2013). In this section, we estimate the effect running from gender equality to GDP per capita, with the caveat that incomes could affect gender equality.
Gender Equality and GDP per Capita
The evolution from an agrarian to an industrial society brought substantial transformations to the Swedish economy and society. This structural change marked the transition to modern economic growth. The 1870–1970 period represents the most successful part of Swedish industrialization and growth (Schön Reference Schön2007). The convergence process and homogenization of Sweden in closing its gender gap occurred during the golden age of Sweden’s modernization. The economic catching-up of Sweden, through technological transfer from more advanced economies, was followed by a period during which it became a leader in many (innovative and sophisticated) industrial areas (Schön Reference Schön2007). To what extent did gender equality foster the economic development of the country?
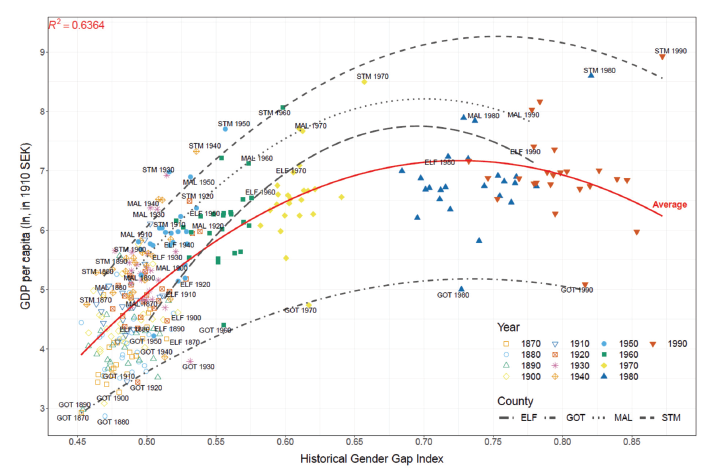
The relationship between gender equality and economic development is presented in Figure 6. The figure graphs the HGGI of Swedish counties against the (log) GDP per capita over the 1870–1990 period. It shows a positive and strong association for most counties between economic growth and gender equality over the 1870–1970 period and a weakening of the positive association over the 1970–1990 period.Footnote 28 As Swedish counties continued their paths toward closing the gender gap, growth slowed down. When assessing the long-term association between gender equality and growth, one should, however, keep in mind that the 1970–1990 period, when our investigation ends, was followed by a deep economic crisis in Sweden, and thereafter, by recovery and growth rates that were higher than the average of OECD countries.
RELATIONSHIP BETWEEN HGGI AND GDP PER CAPITA, 1870–1990
Note: Älvsborg (ELF), Gotland (GOT), Malmöhus (MAL), Stockholm (STM).
Source: GDP per capita estimates from Enflo, Henning, and Schön (Reference Enflo, Henning and Schön2014).
Empirical Strategy
In order to empirically explore the association between gender equality and economic development, as observed in Figure 6, we estimate the following panel model that allows us to account for time-invariant unobserved heterogeneity at the county level:Footnote 29
where i represents each county (with i = 1,.,24) and t represents each time period (with t = 1870,…,1990). The dependent variable, log(GDPpercapita) it , is the log of the GDP per capitaFootnote 30 for county i during period t. Our main explanatory variable, HGGI it , is the gender gap index for county i during period t, with β 1 being the coefficient of our variable of interest; X it denotes the vector of control variables; α i the county fixed effects; and u it is the error term. In some specifications, we add time or period fixed effects to capture unobservable factors that were common across counties in a year period.
The joint evolution of gender equality and economic growth in Sweden during its development process can result from various factors (economic, demographic, and cultural, among others). Hence, we control for possible confounders that are likely to have affected both our dependent variable (GDP per capita) and our independent variable (HGGI). The vector X contains a set of control variables. We use the share of individuals employed in industry as a proxy for the level of industrialization and the population density as a proxy for the level of urbanization. In addition, we control for demographic factors by including the mortality rate (measured as the number of deaths per thousand inhabitants) and the total fertility rate. In order to account for the position of women within the family sphere, which is not directly captured by the HGGI, we control for the share of married women and the female mean age at marriage. Lastly, as Sweden had high rates of emigration between 1880 and 1910 and high immigration in more recent decades, we control for the share of emigrants and the share of immigrants per thousand inhabitants.Footnote 31
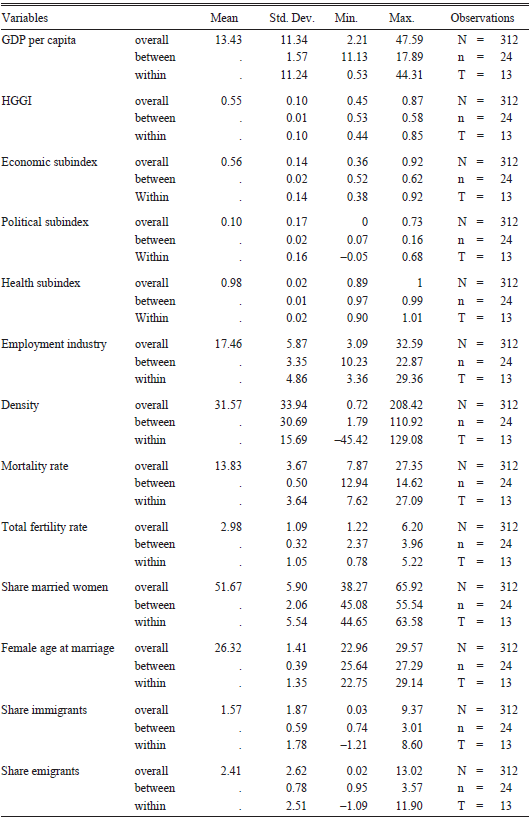
Table 2 provides the descriptive statistics of the variables used in the regression analyses. Most of the data we use come from the censuses published by the Swedish Central Bureau of Statistics. Regional GDP estimates and employment by sector come from Enflo, Henning, and Schön (Reference Enflo, Henning and Schön2014). The descriptive statistics depict the existence of heterogeneity across time and space. Out of the employment figures, the first thing to note is the relatively high overall share of employment in agriculture, reflecting the importance of the role played by the agricultural sector during the studied period. The manufacturing sector strengthened over time. The minimum share of individuals employed in industry was found in Vesterbottens län in 1970, and its maximum in Vestmanlands län in 1960. The lowest level of population density was measured in Norrbottens län in 1870 with only 0.46 inhabitants per square kilometer, and the highest share was found in Stockholm in 1990 with 208 inhabitants per square kilometer.
DESCRIPTIVE STATISTICS
Sources: See text.
Sweden experienced major reductions in mortality and fertility during the 1870–1990 period. The maximum fertility rate is found in Norrbottens län for the year 1900, with six children registered per woman of childbearing age. Stockholm län recorded the lowest fertility rate (1.2 children per woman in childbearing age) in 1930 and the highest mean age at marriage for women (29 years old on average) in 1870. The minimum female age at marriage is found in Blekinge for the year 1970. As far as emigration is concerned, the peak is observed in 1890, when 13 percent of the population from Hallands län emigrated abroad, and the maximum share of immigrants (9.4 percent) in Vestmanlands län in 1970.
Empirical Findings
We make use of our balanced dataset to analyze the relationship between the HGGI and the GDP per capita. The panel estimates are presented in Table 3. We successively estimate Equation (1) using pooled OLS (Columns (1)–(4)), fixed effects (Columns (5)–(7)), and first differences (Column (8)).
REGRESSION RESULTS
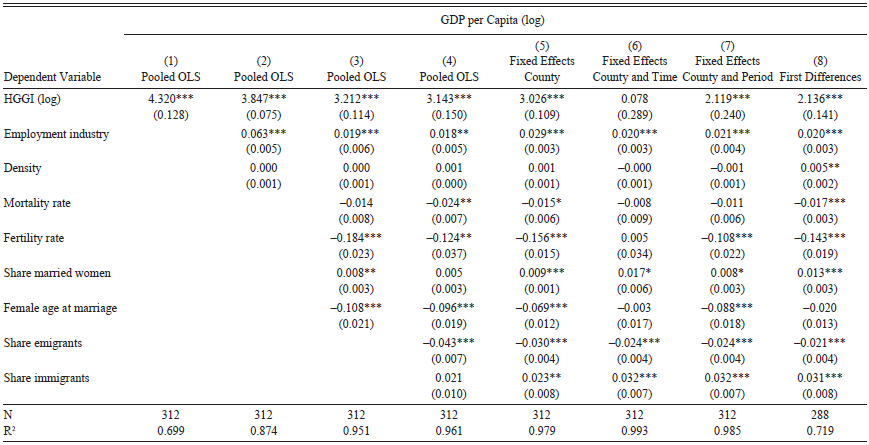
Notes: Dependent variable is GDP per capita (log); variable of interest is HGGI (log). Columns (1)–(4) present OLS estimates; Column (5): county-fixed effects estimates; Column (6): county and time fixed effects; Column (7): county and 20 year period fixed effects; Column (8): first differences. Heteroskedastic robust standard errors (clustered at county level) in parentheses * p<0.05, ** p<0.01, *** p<0.001.
Sources: See text.
The bivariate regression (Column (1)) shows that HGGI and GDP per capita are positively and significantly correlated (at the 0.1 percent level). The coefficient indicates that an increase in the HGGI of 1 percent is associated with a 4.3 percent increase in the GDP per capita. In the subsequent columns, we progressively introduce control variables: employment in industry and density (Column (2)), demographic controls (Column (3)), and migration variables (Column (4)). The introduction of covariates slightly reduces the magnitude of our coefficient of interest, but our result remains robust through the various specifications. Considering the richest specification (Column (4)), an increase of 1 percent in the HGGI is associated with an increase in the GDP per capita of slightly more than 3 percent.Footnote 32
Columns (5)–(8) introduce alternative estimation techniques. In order to control for omitted variable bias for missing time-invariant predictors that differ across counties, we rely on county-fixed effects estimates (Column (5)).Footnote 33 The size of the HGGI coefficient remains large and significant. However, when simultaneously accounting for county and year fixed effects (Column (6)), the significance and magnitude of the effect disappear. Recent research has highlighted the existence of intrinsic issues related to the use of two-way fixed effects (Imai and Kim 2021) and the difficulty of interpreting the estimates they produce (Kropko and Kubinec Reference Kropko and Kubinec2020). Our sample size may also not be large enough to handle the complexity of a model accounting for both county and time dummies. Alternatively, we use period dummies by breaking our time variable into 20-year periods (Column (7)), which has the advantage of consuming fewer degrees of freedom than year dummies. Finally, we use first difference estimates (Column (8)) that cancel out county-specific effects and account for the time dimension. The use of these alternative methods corroborates the existence of a strong and robust association between HGGI and GDP per capita.
Interestingly, our results confirm the importance of the industrialization process, the demographic transition, and cultural attitudes with regard to the family sphere (captured by the marriage pattern) as incremental factors for economic growth. Beyond the importance of the role played by greater gender equality, our findings show that counties that economically performed better, in other words, that displayed a higher level of GDP per capita, were characterized by wider industrial employment, lower fertility and mortality rates,Footnote 34 a higher share of married women and women who married at a younger age (falling in line with the pattern found by Perrin (Reference Perrin2022a, 2022b) for France), as well as lower emigration and higher immigration.
Additionally, we run several robustness regressions to check the validity of our results. Column (1) in Table 4 reports the county and period fixed effect estimates as found in our baseline regression (Column (7) in Table 3). De la Croix and Vander Donckt (Reference De la Croix and Vander Donckt2010) have shown, in the context of developing economies, that the different dimensions of gender disparity have different effects on shaping the development process. Columns (2) to (4) present (county and period) fixed-effect estimates when replacing successively our main dependent variable (HGGI) with the three components of the index, namely the economic sub-index, the political sub-index, and the health sub-index. Both the economic and political sub-indices are positively and significantly correlated with the GDP per capita. Not so surprisingly, we find no significant association between the health sub-index and the GDP per capita. As already discussed, gender equality in health was extremely high during the entire period studied, and very little variation can be observed across counties.Footnote 35 In Column (5), we test the sensitivity of our baseline regression results against the inclusion of additional control variables. The regression yields similar quantitative answers.
ROBUSTNESS CHECKS
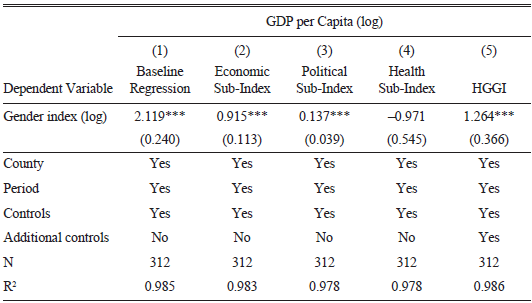
Notes: Dependent variable: (log) GDP per capita. Variable of interest: (log) HGGI (Columns (1) and (5)); (log) economic sub-index (Column (2)); (log) political sub-index (Column (3)); (log) health sub-index (Column (4)). Columns (1)–(4) display county and 20-year-period fixed-effect estimates using the same controls as in Table 3. Column (5) presents county and 20-year-period fixed effect estimates using additional control variables, namely employment in agriculture, employment in private services, employment in public services, urban population, and infant mortality. Heteroskedastic robust standard errors in parentheses (clustered at county level) * p<0.05, ** p<0.01, *** p<0.001. Full estimation results are available upon request.
Sources: See text.
Our attempt here is not to claim causality but to explore whether the HGGI is significantly correlated with the level of economic activity. Our results show that gender equality is positively and significantly associated with GDP per capita. Counties that have improved their gender gap over time have experienced higher economic growth. These findings are consistent with previous empirical studies using more recent data (see, e.g., Klasen Reference Klasen1999; Seguino Reference Seguino2000; Klasen and Lamanna Reference Klasen and Lamanna2009) and corroborate the preliminary results found by Perrin (Reference Perrin2022a) using cross-sectional data for mid-nineteenth-century France. Our findings contribute to the literature by providing empirical evidence confirming the importance of accounting for the gender dimension to enhance our understanding of long-run development processes (Diebolt and Perrin Reference Diebolt and Perrin2013, Reference Diebolt, Perrin, Diebolt, Carmichael, Dilli, Rijpma and Störmer2019).
CONCLUSION
This paper tracks the evolution of gender equality in Sweden along three key dimensions (economic participation and opportunity, health and survival, and political empowerment) over 120 years and adds a spatial dimension that allows the heterogeneity in the country to be accounted for. This paper is the first to contribute by providing a longitudinal dimension (going as far back as 1870) and a spatial one in the appraisal of gender equality from a historical perspective.
Beyond improving our understanding of gender relations in the past by studying the magnitude of gender-based inequalities, the ultimate purpose of the paper is to provide a comprehensive measure of gender equality that will be easy to compare with other variables (economic, demographic, and cultural). Following a similar methodology to the one proposed by Hausmann, Tyson, and Zahidi (Reference Hausmann, Tyson and Zahidi2006) and applying it to the 24 Swedish counties over the 1870–1990 period, we find that Sweden made impressive progress in closing the gender gap. At the national level, the average level of gender equality (county population-weighted) increased from 0.485 in 1870 to 0.806 in 1990. All counties made astonishing progress in closing the gap. Of the three sub-indices, political empowerment improved the most, followed by economic participation and opportunity. Despite being the most improved dimension (in terms of growth rates), the political sub-index presents the largest gender disparity. Only 54 percent of the political empowerment gap was closed at the end of the period under study, compared to 88 percent of the economic participation and opportunity gap and 99 percent of the health and survival gap. Although all the counties followed similar trends, some stood out with regard to the pace of progress made. Of all counties, Stockholm made the most progress, from lagging behind to becoming a forerunner for gender equality. Despite the diversity in the trajectories taken by counties, the investigation of the convergence patterns reveals that Swedish counties converged and that regional inequalities declined over time.
The idea of Sweden’s historic equality is called into question by our quantitative indicator, which captures the long-run evolution of Swedish gender gaps. As argued by Bengtsson (Reference Bengtsson2019), while it has become commonplace to see Sweden’s twentieth-century egalitarianism as the outcome of a long historical trajectory, the trajectory may not have been as persistent as is sometimes argued. The comparison with France adds additional and complementary arguments to this view. Economically, mid-nineteenth-century France appears to have been considerably more gender-equal than Sweden (see Perrin (Reference Perrin2014, Reference Perrin2022a)). It took a century for the Swedish economic sub-index to reach the level displayed by France in 1851. Before 1940, Sweden was not performing significantly better than most countries of a similar level of development. Sweden was within the average of other economies. It is only in its recent history that Sweden has become one of the most gender-equal nations in the world, and the Swedish Model has become famous. Our findings suggest that rapid progress toward high gender equality occurred from the 1940s onward. The converging roles between men and women undeniably reflect the changing economic needs of the country, demonstrate the political will to take practical measures in favor of women’s participation in economic activities, and more generally reflect a change in attitude toward women within Swedish society.
Beyond its significance for Swedish economic history, this paper adds substantial knowledge to our currently limited knowledge of the evolution of gender differences in the past and their association with economic development. The spatial dimension offers a unique opportunity to study the heterogeneity of gender equality across space—focusing on a case that is central to the whole debate on gender equality. This paper provides a crucial quantitative indicator of gender equality that can be generalized and applied to other countries and geographical areas. We additionally contribute to the literature by providing the first empirical exploration of the long-run relationship between gender equality and economic growth from a historical perspective. The empirical analysis reveals that regions displaying higher gender equality performed economically better than less gender-equal regions.
More research is needed to continue deepening and strengthening our understanding of the long-run relationship between gender equality and economic and demographic developments. Our future research will: (i) investigate the determinants of gender equality on its various dimensions to determine what factors matter the most for fostering gender equality; (ii) analyze both directions of the causal relationship between gender equality and economic growth—since the causation is likely to run from gender equality to economic growth but also from economic growth to gender equality; and (iii) explore the dynamics of the relationship.


 Open access