

Obstructive sleep apnoea (OSA) is considered a public health problem due to its high prevalence in the general population( Reference Lee, Nagubadi and Kryger 1 ) and its association with both increased morbidity and mortality in the short term (traffic and workplace accidents)( Reference Rakel 2 ) and in the long term (CVD)( Reference Loke, Brown and Kwok 3 – Reference Kendzerska, Gershon and Hawker 5 ). The identification of the mechanisms responsible for the development of atherosclerosis triggered by OSA is of major importance, and despite significant efforts they remain incompletely understood( Reference Lévy, Ryan and Oldenburg 6 ). There is evidence that OSA, mainly driven by chronic intermittent hypoxia, can increase the risk for CVD through sustained sympathetic activation, oxidative stress, systemic inflammation, hypercoagulability, endothelial dysfunction and also by promoting metabolic abnormalities( Reference Lévy, Ryan and Oldenburg 6 – Reference Drager, Togeiro and Polotsky 8 ).
Nutritional intervention for weight loss is one of the treatment options for OSA in patients with overweight or obesity, based on the knowledge that weight loss can improve the apnoea/hypopnoea index (AHI) and oxygenation in such patients( Reference Johansson, Neovius and Lagerros 9 – Reference Qaseem, Holty and Owens 12 ). Several guidelines for the treatment of obesity recommend moderate energy restriction in order to achieve a modest weight loss of 5–10 % in a 6-month period( Reference Jensen, Ryan and Apovian 13 – 15 ). However, the effects of this nutritional approach on the severity of OSA are not yet known( Reference Anandam, Akinnusi and Kufel 16 ). To the best of our knowledge, all randomised clinical trials that have evaluated the impact of weight loss on OSA severity explored either severe energy restriction, the association of energy restriction with physical activity or bariatric surgery( Reference Johansson, Neovius and Lagerros 9 , Reference Foster, Borradaile and Sanders 17 , Reference Tuomilehto, Seppä and Partinen 18 ). Moderate energy restriction was tested in a few studies, but they lacked a control group (CG) and participants were also instructed to increase their physical activity( Reference Gilardini, Lombardi and Redaelli 19 , Reference Iguchi, Yamakage and Tochiya 20 ). Furthermore, moderate weight loss in patients with excess body weight is associated with significant improvement in different CVD risk factors in the general population, including reduction in blood pressure, improvement of insulin resistance and lipid profile( Reference Jensen, Ryan and Apovian 13 , Reference Hainer, Toplak and Mitrakou 21 ). However, to date, it is not yet known about the effects of weight loss upon these different CVD risk factors in obese individuals with OSA.
Therefore, the purpose of this study was to evaluate the effects of moderate energy restriction on OSA severity, sympathetic activity, blood pressure, inflammatory biomarkers, metabolic profile and endothelial function in obese patients with OSA.
Methods
The present study was conducted at the Laboratory of Clinical and Experimental Pathophysiology, CLINEX, located at Pedro Ernesto University Hospital, Rio de Janeiro State University. The present study was conducted in accordance with the Declaration of Helsinki, and all the procedures involving human subjects/patients were approved by the committee on ethics and research of the Pedro Ernesto University Hospital (3017/2011-CEP/HUPE–CAAE:0161.0.228.000-11). Written informed consent was obtained from all the patients. The present trial was registered at www.clinicaltrials.gov (ID no. NCT02206126).
The present study was a 16-week, parallel-group, open-label, randomised, clinical trial. The inclusion criteria were as follows: individuals with obesity (grade I or II), aged between 20 and 55 years and with AHI≥5 events/h. Participants were enrolled between July 2011 and October 2013. Potential participants were recruited from the waiting rooms of the Departments of Orthopedics, Plastic Surgery and Gynecology at the Pedro Ernesto University Hospital.
Exclusion criteria were as follows: smoking; use of dietary supplements; use of medications that could interfere with body weight, metabolic profile and/or blood pressure; use of α-adrenergic-blocking agents; use of a permanent pacemaker; recent changes in body weight defined as at least >3 kg within the previous 6 months as well as recent modifications in dietary intake and/or intensity or frequency of physical exercise during the same period; diagnoses of diabetes mellitus, hypertension, dyslipidaemia (with drug treatment) and/or kidney disease; clinical history of thyroid dysfunction, angina pectoris, heart failure, myocardial infarction and/or stroke; presence of peripheral vascular disease, peripheral neuropathy, liver failure, chronic pulmonary disease and gastro-oesophageal reflux disease; finger deformity that prevents the proper use of the sensors necessary to evaluate OSA and endothelial function; and previous bilateral cervical-thoracic sympathectomy. Pregnant or lactating women were not allowed to participate in the study.
At the beginning of the study (week 0), potentially eligible subjects were scheduled to arrive at the Laboratory between 08.00 and 10.00 hours after a 12-h fasting period. When fasting, they underwent evaluation of their nutritional status, blood pressure, sympathetic nervous system activity, inflammatory biomarkers, metabolism of glucose and lipids and endothelial function. Subsequently, the dietary intakes of the participants were evaluated and they received a portable device (Watch-PAT200®; Itamar Medical) and all the necessary instructions to conduct the home sleep study.
The following day, after the sleep study, participants visited the laboratory and returned the Watch-PAT200®. During the same visit, participants who presented with AHI≥5 events/h were randomised into two groups: the energy restriction group (ERG) and the CG. The ERG was instructed to follow an energy-restricted diet −3347·2 kJ/d (−800 kcal/d) and the CG was advised not to change their food intake.
Subsequent visits were scheduled with 4-week intervals (weeks 4, 8, 12 and 16). All the participants underwent an evaluation of their dietary intake, anthropometric parameters and blood pressure at weeks 4, 8 and 12. At the end of the study (week 16), participants of both the groups underwent all the evaluations performed at week 0, as previously described, and once again received the Watch-PAT200® for another home sleep study.
Both the groups were instructed not to change their usual exercise routine during the study period. At weeks 0, 4, 8, 12 and 16, physical activity was evaluated using the Baecke questionnaire( Reference Baecke, Burema and Frijters 22 ). This questionnaire evaluates physical activity at three subscales: at work, sports during leisure time and other physical activities during leisure time( Reference Baecke, Burema and Frijters 22 , Reference Florindo, Latorre and Jaime 23 ).
Dietary intervention
The energy intake of the participants allocated to the ERG was formulated to correspond to an 3347·2 kJ/d (800 kcal/d) reduction in baseline total daily energy expenditure, calculated using the Dietary Reference Intake equations( 24 ). This energy-restricted diet was structured to provide levels of macronutrients as follows: ±15–20 % of energy from proteins, ±25–30 % of energy from fat and ±50–60 % of energy from carbohydrates. At weeks 4, 8 and 12, the total energy value of the diet was adjusted according to the participant’s body weight at that time, as an attempt to continue weight loss.
The participants allocated to the CG were advised not to change their food intake. However, after the 16-week follow-up period, participants in the CG received nutritional counselling for energy restriction.
Sleep study
The diagnosis of OSA was made using the wrist-worn portable device Watch-PAT200 ® . This device, approved by the Food and Drug Administration, allows accurate and clinically effective home diagnosis of OSA, with a highly significant correlation between the AHI obtained from polysomnography( Reference Yuceege, Firat and Demir 25 , Reference Weimin, Rongguang and Dongyan 26 ).
The Watch-PAT200 ® is a six-channel non-invasive device. The channels of the device are as follows: (1) peripheral arterial tonometry (PAT), (2) pulse oximetry, (3) actigraphy, (4) heart rate, (5) body position and (6) snoring detection( Reference Weimin, Rongguang and Dongyan 26 ). The PAT signal measures the finger arterial pulsatile volume changes that are regulated by α-adrenergic innervation of the smooth muscles of the finger vasculature, and thus reflects sympathetic nervous system activity. This augmentation in sympathetic activity accompanies the increase in heart rate and O2 desaturation at the termination of respiratory events. Thus, the Watch-PAT200 ® indirectly detects apnoea/hypopnoea events by identifying surges of sympathetic activation associated with the termination of such events( Reference Yuceege, Firat and Demir 25 ).
Following the sleep study, the recordings were automatically downloaded and analysed by an offline procedure using zzzPAT software. The zzzPAT algorithms use four Watch-PAT200 ® channels for the detection of different parameters, including AHI, respiratory disturbance index (RDI), O2 desaturation index (ODI), and mean and minimum O2 saturation. AHI refers to the number of apnoeas and hypopnoeas per hour of sleep, and RDI includes both the AHI and the respiratory effort-related arousal (RERA) index together. RERA is an obstructive event that does not meet the criteria for apnoea or hypopnoea but causes arousal from sleep. ODI expresses the number of O2 desaturation events during an hour of sleep. A desaturation event is determined as a reduction of 4 % or more of the oxygen saturation baseline level. In the present study, the diagnosis of OSA was considered positive when AHI was ≥5.
Nutrition assessment
The usual dietary intake assessment was performed using a semi-quantitative FFQ at week 0. This questionnaire could determine the usual daily intake of energy, proteins, carbohydrates, lipids, cholesterol and fibres over the previous 6 months. This questionnaire, containing eighty items and usual portions, was developed for the Brazilian population based on habitual consumption of food and was validated against more accurate methods( Reference Sichieri and Everhart 27 ). Alcohol consumption was considered when the reported frequency was 1 or more times/week.
Dietary intake during the study (weeks 4, 8, 12 and 16) was assessed through a 3-d food record, covering 2 weekdays and 1 weekend day. The food record was reviewed and clarified during an interview with a registered dietitian. In the ERG, the food record was used to assess dietary adherence. In the CG, the food record was used to assess whether the study participants maintained the baseline dietary pattern.
Height was measured using a stadiometer accurate to ±0·5 cm, and weight was measured using a digital scale accurate to ±0·1 kg (Filizola S.A.), with participants wearing light clothing and no shoes, and they also attempted to empty their bladder. BMI was calculated using the standard equation (kg/m2). Waist circumference (WC) was measured in the standing position midway between the lower margin of the last rib and the iliac crest at mid-exhalation. Waist:height ratio was obtained by dividing WC (cm) by height (cm). Neck circumference (NC) was measured at the level of the cricothyroid membrane( Reference Stradling and Crosby 28 ). Anthropometric measurements were taken twice and mean values were used in all the analyses.
Percentage of body fat was estimated by electrical bioimpedance using a Biodynamics BIA-450 body fat analyser (Biodynamics Corp.).
Laboratory parameters
Blood samples were collected after a 30-min resting period in the supine position. Aliquots of plasma and serum were stored at −20 or −70°C as appropriate for laboratory determinations. The blood sample assigned for the determination of plasma catecholamines was collected in a cold tube and plasma was separated in a refrigerated centrifuge. Laboratory parameters included fasting circulating levels of glucose, insulin, lipids, high-sensitivity C-reactive protein (hs-CRP), adiponectin, adrenaline, noradrenaline, dopamine, intercellular adhesion molecule 1 (ICAM-1) and P-selectin.
Fasting plasma glucose level was measured by an automated technique, glucose oxidase/peroxidase method, using a commercial kit (BioSystems). Fasting plasma insulin levels were determined by the ELISA method using the commercially available specific kit (EMD Millipore Corporation). Insulin resistance status was assessed using the homoeostasis model assessment of insulin resistance (HOMA-IR) index, which was calculated as fasting insulin (μU/ml)×fasting plasma glucose (mmol/l)/22·5( Reference Matthews, Hosker and Rudenski 29 ).
Concentrations of total cholesterol, HDL-cholesterol and TAG were assessed by an automated technique. LDL-cholesterol was estimated using Friedewald’s formula( Reference Friedewald, Lévy and Fredckson 30 ).
To evaluate biomarkers of inflammatory state, circulating levels of hs-CRP and adiponectin were determined. The turbidimetry method was used to determine the serum concentration of hs-CRP (BioSystems). ELISA was used to assess plasma adiponectin concentrations.
The activity of the sympathetic nervous system was evaluated by determining plasma concentrations of adrenaline and noradrenaline measured by ELISA using a commercial kit (DIAsource ImmunoAssays S.A.). To evaluate endothelial function, circulating levels of ICAM-1 and P-selectin were determined by the luminexTM xMAP method using a commercial kit (EMD Millipore Corporation).
Blood pressure
Blood pressure was recorded using a calibrated and semi-automatic sphygmomanometer device, OMRON® Model HEM-742INT (Omron Healthcare), after a resting period of 10 min. The first reading was discarded and the mean of three consecutive measurements, taken in the non-dominant arm with 3-min intervals between readings, was used for the study. An appropriate arm cuff was used, and patients were instructed to stay free from tight clothing, sit with their legs uncrossed, with their feet on the floor, back supported, arm supported at heart level, palm facing upwards and elbow slightly flexed( 31 ).
Endothelial function
Endothelial function was also evaluated by the PAT method, using Endo-PAT 2000®, a finger plethysmographic device (Itamar Medical). This is a non-invasive method that offers the possibility of an easy and rapid assessment of vascular function in which data are analysed independently of the examiner( Reference Bonetti, Pumper and Higano 32 ).
The measurements were taken using fingertip probes placed on both index fingers. A 5-min measurement was taken at baseline. Sequentially, arterial flow was occluded using a cuff on the non-dominant arm, which was inflated to 60 mmHg above systolic blood pressure, but never below 200 mmHg. The cuff was rapidly deflated after 5 min of occlusion to allow reactive hyperaemia, and the following 5 min were then recorded. The other arm served as a control and the difference between the two arms was used by the Endo-PAT 2000® software to automatically calculate the reactive hyperaemia index.
Statistical methods
Means with their standard errors were used to summarise continuous variables. Normality was tested by using the Shapiro–Wilk’s test. A Student’s t test or the Mann–Whitney test was used to assess the differences of variables between the two groups at week 0 and to evaluate the intragroup and intergroup differences for variables evaluated at week 0 and week 16. Categorical variables were expressed as percentage and compared by the χ 2 test. Repeated-measures ANOVA were used to evaluate intragroup and intergroup differences for anthropometric parameters and blood pressure levels (which were evaluated at weeks 0, 4, 8, 12 and 16). Cohen’s d effect size was calculated for the intergroup differences. As effect sizes are not dependent upon the sample size, they can help inform about the potentially meaningful effects of the intervention. Effect sizes of 0·20 are small, 0·50 are medium and 0·80 are large( Reference Cohen 33 ).
Correlations between continuous variables were determined using the Pearson’s or Spearman’s correlation coefficient. Partial correlations adjusted for potential confounders (age, sex, values of the variables involved in the analysis at baseline, changes in body weight and changes in WC) were also used.
Statistical analyses were limited to those who completed the intervention (n 21). All the analyses were performed using STATA (version 10.0; Stata Corp.) software. A P value<0·05 was considered to be statistically significant. Randomisation was performed in blocks.
It was not possible to determine the desired sample size to achieve a significant decrease in AHI, due to the non-existence of a previous randomised clinical trial with a similar intervention.
Results
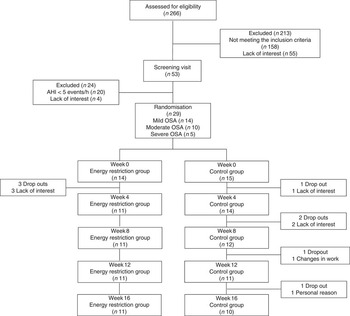
A total of 266 subjects were interviewed, of which thirty-three met the eligibility criteria and twenty-nine were randomised. The most common reasons for exclusion were smoking (n 30), hypertension (n 41), BMI<30 kg/m2 (n 40), BMI≥40 kg/m2 (n 13), age >55 years (n 8) and diabetes (n 5). Among randomised subjects (n 29), twenty-one completed the study, with eleven participants in the ERG and ten in the CG (Fig. 1). The non-completers left the study because of lack of interest, personal reasons and changes in work schedule.
Flow diagram of the study. AHI, apnoea/hypopnoea index; OSA, obstructive sleep apnoea.
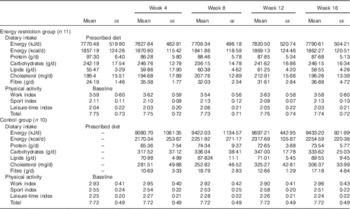
Both the study groups were comparable in all parameters evaluated at baseline (week 0) (Table 1). Compliance to dietary prescription in the ERG and maintenance of the habitual dietary intake during the study period in the CG were satisfactory (Table 2). Participants maintained their physical activity during the study period (Table 2).
Baseline characteristics of study subjects (Mean values with their standard errors)
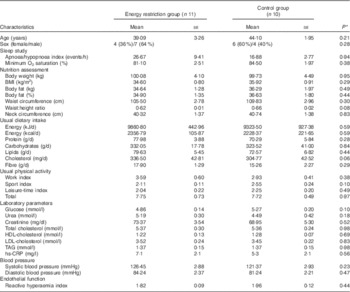
hs-CRP, high-sensitivity C reactive protein.
* P values refer to differences between the energy restriction group and the control group.
Dietary intake and physical activity of the participants in the different groups of the study (Mean values with their standard errors)
Participants allocated to the ERG, compared with those in the CG, presented a significant reduction in body fat and in all anthropometric parameters, as expected, due to the energy deficit in this group (Table 3). AHI decreased significantly in the ERG compared with the CG, whereas minimum O2 saturation increased significantly in the ERG compared with the CG (Table 4).
Nutritional parameters at baseline (week 0) and at the end of the study (week 16) in the different groups of the study (Mean values with their standard errors)

Δ, Week 16–week 0; WheiR, waist:height ratio.
* P value<0·05 for modification during the study in the energy restriction group.
** P value<0·001 for modification during the study in the energy restriction group.
† P values refer to differences between the energy restriction group and the control group.
‡ Cohen’s d effect size.
Obstructive sleep apnoea severity parameters at baseline (week 0) and at the end of the study (week 16) in the different groups of the study (Mean values with their standard errors)
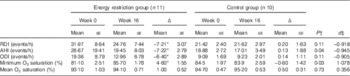
Δ, Week 16–week 0; RDI, respiratory disturbance index; AHI, apnoea/hypopnoea index; ODI, O2 desaturation index.
* P value<0·05 for modification during the study (week 0 v. week 16) in each group.
† P values refer to differences between the energy restriction group and the control group.
‡ Cohen’s d effect size.
Subjects in the ERG compared with those in the CG showed significantly greater reduction in plasma levels of adrenaline. There was no significant difference between the groups in relation to the modifications in plasma insulin, HOMA-IR, hs-CRP, lipid profile, endothelial function and blood pressure (Table 5). However, medium-to-large effect sizes were observed for insulin, HOMA-IR, hs-CRP, adiponectin, ICAM-1 and blood pressure, suggesting that the statistically non-significant difference between the groups might be due to the small sample size.
Biochemical variables, reactive hyperaemia index (RHI) and blood pressure (BP) at baseline (week 0) and at the end of the study (week 16) in the different groups of the study (Mean values with their standard errors)

Δ, Week 16–week 0; HOMA-IR, homoeostasis model assessment of insulin resistance; hs-CRP, high-sensitivity C-reactive protein; ICAM-1, intercellular adhesion molecule 1.
* P value<0·05 for modification during the study (week 0 v. week 16) in each group.
† P values refer to differences between the energy restriction group and the control group.
‡ Cohen’s d effect size.
During the study period, the modifications in body weight, body fat, WC and NC exhibited a significant correlation with changes in parameters of OSA severity, blood pressure, insulin levels and HOMA-IR, even after adjustments for confounding factors. The changes in WC were significantly associated with modifications in the levels of noradrenaline and adiponectin (Table 6).
Correlations between changes in nutritional parameters and changes in the variables obtained during the sleep study, biochemical biomarkers, blood pressure (BP) and endothelial function

Δ, Week 16–week 0; AHI, apnoea/hypopnoea index; RDI, respiratory disturbance index; ODI, O2 desaturation index; HOMA-IR, homoeostasis model assessment of insulin resistance.
* After adjustments for confounding factors (age, sex and values of the variables involved in the analysis at baseline).
Correlations between changes in variables obtained during the sleep study and the modifications in the biochemical biomarkers, blood pressure and endothelial function are presented in Table 7. The changes in parameters of OSA severity presented a significant association with the modifications in serum levels of hs-CRP. This association was independent of confounding factors (age, sex, changes in body weight and changes in WC). The changes in minimum O2 saturation were associated positively and significantly with changes in serum adiponectin levels. This association was attenuated and was no longer statistically significant (P=0·06) after adjustment for the same confounding factors.
Correlations between changes in variables obtained during the sleep study and the changes in biochemical biomarkers, blood pressure (BP) and endothelial function
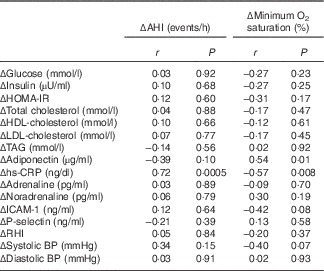
Δ, Week 16–week 0; AHI, apnoea/hypopnoea index; HOMA-IR, homoeostasis model assessment of insulin resistance; hs-CRP, high-sensitivity C-reactive protein; ICAM-1, intercellular adhesion molecule 1; RHI, reactive hyperaemia index.
Discussion
The guidelines for the management of OSA recommend weight loss for all overweight patients( Reference Epstein, Kristo and Strollo 11 , Reference Qaseem, Holty and Owens 12 ). However, evidence is still lacking to support the concept that modest weight loss, induced by moderate energy restriction, can represent a therapeutic strategy for OSA.
In the present study, modest weight loss, induced by moderate energy restriction, was able to significantly improve parameters of OSA severity (reduction in AHI and increase in minimum O2 saturation) (n 21). This finding is in agreement with other randomised( Reference Johansson, Neovius and Lagerros 9 , Reference Foster, Borradaile and Sanders 17 , Reference Tuomilehto, Seppä and Partinen 18 ) and non-randomised( Reference Gilardini, Lombardi and Redaelli 19 , Reference Iguchi, Yamakage and Tochiya 20 , Reference Kansanen, Vanninen and Tuunainen 34 – Reference Nerfeldt, Nilsson and Mayor 36 ) trials in which weight loss, induced by different strategies, was associated with improvements in OSA severity. In contrast, however, the study conducted by Barnes et al. ( Reference Barnes, Goldsworthy and Cary 37 ) failed to show a statistically significant reduction in AHI in obese patients with mild-to-moderate sleep apnoea, after following a very low-energy diet combined with physical activity for 16 weeks, which resulted in an average weight loss of 12·3 kg.
As expected, in the present study, the degree of weight loss was lower than that observed in clinical trials that evaluated the effects on OSA severity of weight loss induced by severe energy restriction( Reference Johansson, Neovius and Lagerros 9 , Reference Kansanen, Vanninen and Tuunainen 34 , Reference Nerfeldt, Nilsson and Mayor 36 ) or severe energy restriction associated with increased physical activity( Reference Foster, Borradaile and Sanders 17 , Reference Tuomilehto, Seppä and Partinen 18 , Reference Kajaste, Brander and Telakivi 35 ). Despite the lower weight loss observed in this study, the degree of improvement in parameters of OSA severity was similar to that observed in some randomised clinical trials in which participants presented a greater weight loss( Reference Foster, Borradaile and Sanders 17 , Reference Tuomilehto, Seppä and Partinen 18 ). On the other hand, in some studies, a greater weight loss was achieved and was associated with higher improvements in parameters of OSA severity( Reference Johansson, Neovius and Lagerros 9 , Reference Kansanen, Vanninen and Tuunainen 34 ). Therefore, these findings suggest that other factors rather than absolute weight loss may interfere with the degree of improvement in OSA severity, such as, for example, the site of adiposity reduction (central v. peripheral).
Only uncontrolled studies addressed the impact of weight loss induced by moderate energy restriction, but they are not similar to the present investigation because energy restriction was coupled with physical activity( Reference Gilardini, Lombardi and Redaelli 19 , Reference Iguchi, Yamakage and Tochiya 20 ). These studies reported improvements in OSA similar to that observed in our participants, after a modest weight loss similar to that observed in our participants.
Bariatric surgery is often touted as the most effective option for treating obesity and its co-morbidities, including OSA( Reference Sarkhosh, Switzer and El-Hadi 38 ). Dixon et al. ( Reference Dixon, Schachter and O’Brien 39 ) evaluated whether surgically induced weight loss was more effective than conventional weight loss therapy in the management of OSA. Patients lost a mean of 5·1 kg in the conventional weight loss programme compared with 27·8 kg in the bariatric surgery group (P=0·001). The AHI decreased by 14·0 events/h in the conventional weight loss group and by 25·5 events/h in the bariatric surgery group. Surprisingly, bariatric surgery compared with conventional weight loss therapy did not result in a statistically greater reduction in AHI (P=0·18), despite major differences in weight loss( Reference Dixon, Schachter and O’Brien 39 ).
According to all the studies cited above (including ours), it is possible to conclude that there is a great heterogeneity between them in relation to the effect of weight loss on the parameters of OSA severity. For example, in one study, weight loss of 12·3 kg was not associated with a significant decrease in AHI( Reference Barnes, Goldsworthy and Cary 37 ), whereas in another study participants who had lost >3 % of their weight had a significant decrease in AHI( Reference Iguchi, Yamakage and Tochiya 20 ). The possible explanations for this heterogeneity may include differences in BMI and in OSA severity at the beginning of the study, sample size, characteristics of the participants such as age and sex, the site of preferential adiposity loss as previously commented and the association of physical activity with energy restriction. Exercise can directly change the structure of sleep( Reference Shneerson and Wright 10 ). In a randomised clinical trial that evaluated the impact of exercise on the OSA severity, it was observed that exercise, as compared with stretching, resulted in a significant AHI and ODI reduction in the absence of a significant decrease in body weight( Reference Kline, Crowley and Ewing 40 ).
In this study, the ERG compared with the CG did not achieve a significant improvement in CVD risk factors (blood pressure, inflammatory biomarkers, metabolic profile and endothelial function). A possible explanation to account for this lack of differences may rest in the small sample size, as there were medium-to-large effect sizes for the majority of these variables as well as a significant association between changes in parameters of nutritional status and modification in CVD risk factors.
One could also hypothesise that in the present study the moderate weight loss improved OSA severity but not CVD risk factors, because excessive adiposity is a risk factor for OSA by ‘direct’ or ‘mechanical’ mechanisms. These mechanisms include enlargement of soft tissue structures within and surrounding the airways and an excessive fat deposition in the tongue, soft palate and uvula and also under the mandible. In addition, lung volumes are markedly reduced in obese patients due to increased abdominal fat mass. Reduction of lung volume may decrease longitudinal tracheal traction forces and pharyngeal wall tension, predisposing to airway narrowing( Reference Drager, Togeiro and Polotsky 8 ). Conversely, the benefits of weight loss on CDV risk factors may be mediated by ‘indirect’ or ‘metabolic’ mechanisms that may require either a greater weight loss, a longer time of intervention or both. Therefore, during weight loss, the benefits for OSA severity may be obtained more easily than the benefits regarding CVD risk factors.
Evidence suggests that weight loss can reduce sympathetic activity in obese patients( Reference Lambert, Rice and Eikelis 41 , Reference Lambert, Straznicky and Dawood 42 ). The present clinical trial is accordance with this fact, because modest weight loss resulted in significant reduction in plasma levels of adrenaline. In addition, there was a positive and significant association between changes in WC and the variations in plasma concentrations of noradrenaline, demonstrating the importance of central body fat in the modulation of sympathetic activity. The decrease in sympathetic activity observed in the ERG can also be attributed to the reduction in OSA severity.
We observed a strong association between changes in parameters of OSA severity (AHI, minimum O2 saturation) and modifications in hs-CRP levels, which was maintained even after adjusting for confounding factors. Therefore, in this study, it can be inferred that the changes in the various parameters of OSA severity had greater impact on the levels of hs-CRP than changes in body weight or WC during the study period. Evidence suggests that OSA patients have increased levels of several pro-inflammatory cytokines and of hs-CRP( Reference Shamsuzzaman, Winnicki and Lanfranchi 43 – Reference Lui, Lam and Mak 46 ).
In addition, a significant inverse association was found between changes in WC and modifications in serum adiponectin levels, supporting the role of central adiposity in the regulation of serum adiponectin concentrations.
There are several limitations to the present study. The main limitation is the evaluation of a small number of individuals. Type I error inflation was likely, given the high number of statistical comparisons.
In summary, we found that a modest weight loss (≤5 % of initial body weight) in obese subjects with OSA was able to improve OSA severity and sympathetic activity. However, it did not improve other CVD risk factors such as blood pressure and insulin resistance. As weight loss presented a significant correlation with the decrease in blood pressure and insulin resistance and as the effect sizes for the intergroup differences were rated as medium-to-large, it is possible that if weight loss had been greater or sample size larger a meaningful decrease in blood pressure and insulin resistance might have been documented.
Conclusion
The findings of this study suggest that in obese patients with OSA moderate energy restriction is able to reduce OSA severity and sympathetic nervous system activity, but not other CVD risk factors.
Acknowledgements
The authors express their sincere gratitude to Maria de Lourdes Guimarães Rodrigues, Débora Cristina Torres Valença, Sileia Nascimento and José Firmino Nogueira Neto.
The present study was supported by Fundação Carlos Chagas Filho de Amparo à Pesquisa do Estado do Rio de Janeiro (FAPERJ).
J. F. R. F., A. F. S. and M. R. S. T. K. contributed to the study conception and design; J. F. R. F., L. d. S. A., A. F. S. and M. R. S. T. K. contributed to data collection, assembly, analysis and interpretation of the data; S. E. K. contributed to data analysis and interpretation; J. F. R. F., L. d. S. A., S. E. K., M. R. S. T. K. contributed to the manuscript drafting and approval of the final version of the manuscript.
There are no conflicts of interest.


