


1. Introduction
In Reference GoldGold (1997), information was given on the statistical characteristics for the type and length of deformation-induced cracks in columnar-grain ice. This paper presents similar information for the strain dependence of the crack density and the spatial distribution of the cracks for the same crack populations. The two papers are part of the record of a study of the dependence of the statistical characteristics of grain-boundary and transcrystalline cracks on strain rate, grain-size and temperature, carried out when the author was a Visiting Scientist at the Institute for Marine Dynamics of the National Research Council of Canada in St John’s, Newfoundland.
There is considerable interest in the strength of ice and the factors that control it, particularly with reference to engineering problems such as the prediction of ice forces on off-shore structures (Reference SandersonSanderson, 1988; Reference DaleyDaley, 1992; Reference Arunachalam and Muggeridge.Arunachalam and Muggeridge, 1993). Damage to the ice due to such forces is known to be one of the stages of failure (Reference Frederking, Jordaan. and McCallum.Frederking and others, 1990; Reference Riska, Rantala. and Joensuu.Riska and others, 1990; Reference Cole, Jones, McKenna., Tillotson and Jordaan.Cole, 1991; Reference Stone, Jordaan., Xiao. and Jones.Stone and others, 1997). Attempts have been made to take into account the effect of damage on the rheological behavior of ice (e.g. Reference SinhaSinha, 1988, Reference Sinha, Jones, McKenna., Tillotson. and Jordaan.1991a, Reference Sinha and Sodhib; Reference Jordaan and Xiao.Jordaan and Xiao, 1992; Reference Kalifa, Ouillon. and Duval.Kalifa and others, 1992; Reference Meany, Jordaan. and Xiao.Meany and others, 1996; Reference Xiao and Jordaan.Xiao and Jordaan, 1996).
Attention has been given to possible mechanisms of formation of cracks in ice (Reference GoldGold, 1972a, Reference Goldb; Reference ColeCole, 1988; Reference Kalifa, Duval., Ricard., Sinha, Sodhi. and Chung.Kalifa and others, 1989, Reference Kalifa, Jones. and Slade.1991; Reference Frost and Smith.Frost and Gupta, 1993; Reference Frost and Smith.Frost and Smith, 1993; Reference Picu and Gupta.Picu and Gupta, 1995; Reference Elvin and Sunder.Elvin and Sunder, 1996; Reference Weiss, Schulson. and Frost.Weiss and others, 1996). Little attention has been given, however, to the characteristics of the crack populations that are induced. Reference GoldGold (1972a, Reference Goldb, Reference Gold1997) showed that such populations, produced by a uniaxial constant load perpendicular to the long direction of the columns of columnar-grain ice, have statistical characteristics that depend on the stress, strain, strain rate, grain-size and temperature. Reference Kalifa, Duval., Ricard., Sinha, Sodhi. and Chung.Kalifa and others (1989) showed that the ratio of grain-boundary to transcrystalline cracks for granular ice depend on the strain rate. Reference Kalifa, Jones. and Slade.Kalifa and others (1991) found a temperature and grain-size dependence of the stress and strain for the initiation of the first crack in granular ice, similar to that found by Reference Gold, Jones. and Slade.Gold and others (1993) for columnar-grain ice. Reference ColeCole (1986) gives information on the dependence of the crack length on grain-size for granular ice, and the distribution in crack lengths for the induced population. The present paper provides additional evidence that, for some relatively common situations of ice structure and applied forces, crack initiation can be assumed to be a random process, resulting in grain-boundary and transcrystalline crack populations with well-defined statistical characteristics.
A purely statistical study of the stress, strain, strain rate, grain-size, ice structure and temperature dependence of crack populations should not be expected to yield fundamental information on the mechanisms of initiation of individual cracks. Weil-defined statistical characteristics for these populations, however, can yield useful insight into the general nature of the mechanisms and their dependence on the above variables. Also, knowledge of the statistical characteristics can provide a connection between the micro-scale of crack initiation and the macro-scale of specimen or ice-cover failure.
2. Nature of the Investigation
The method of preparing the ice and specimens, measuring the strain and grain-size and observing the cracks after each test is given in Reference GoldGold (1997). Specimens were 200 mm × 90 mm × 30 mm, with the long direction of the columnar grains perpendicular to the 200 mm × 90 mm face. The axis of hexagonal symmetry of each grain tended to lie in the plane perpendicular to the long direction of the columnar grains and to have a random direction in that plane. A uniaxial compressive stress was applied to the 90 mm × 30 mm end faces, perpendicular to the long direction of the grains, at a constant rate of cross-head displacement by a servo-controlled hydraulic actuator. The specimens were strained at the nominal rates of 10−3, 10−4 and 10−5 s−1 corresponding to average measured values of 7.0 × 10⁻⁴, 7.6 × 10⁻⁵ and 7.8 × 10⁻⁶ s−1, respectively. Strain rates were almost constant over the strain range of 1.4 × 10⁻⁴ to the maximum imposed during a test for the nominal rates of 10−3 and 10−4 s1. Some plastic strain was observed at the nominal rate of 10−5 s−1. Two experiments were carried out at the nominal rate of 10−2 s−1 (6.7 × 10⁻³ s−1), but these were at the limit of the strain- and crack-recording systems. Tests were conducted at –5°, –10°, –20° and –30°C; only observations at –10°C are presented in this paper.
Strains were measured with two electrical extensometers, one mounted on each edge of the specimen, and were recorded on a computer at a rate that depended on the nominal strain rate. Strains used in the analyses are the average of these two measurements. The maximum stress applied to the specimens was limited in each case to about 60% of the failure stress that would be expected for the conditions of the test, i.e. to 3–5 MPa, depending on the nominal strain rate. The corresponding maximum strains were between 6 × 10⁻⁴ and 9 × 10⁻⁴. A video camera, mounted in front of the specimens and recording at a rate of 30 frames s1, monitored the formation of the cracks. The formation of a crack was abrupt and easily detected by the reflection of light from two lamps, one on each side of the specimen. A light appeared in the video record at the instant a test was started. This allowed the strain and crack records to be synchronized to within one-30th of a second.
Because of the random crystallographic orientation of each grain, the columnar-grain structure, the anisotropy in the resistance to viscous shear for single-crystal ice and the direction of the stress relative to the long direction of the grains, the initial deformation was, effectively, two-dimensional; the strain in the long direction of the grains was much smaller than in the plane perpendicular to that direction. The problem, therefore, was one of cracks forming under two-dimensional deformation rather than three-dimensional, as would be the case for a granular structure.
The cracks were long and narrow, with their long direction in the long direction of the grains and their plane tending to be parallel to the applied compressive stress. There was no visual evidence of their increasing in size for strain rates greater than 10−5 s−1 and stress less than 60% of the yield or failure values. A few cases of enlargement were observed in the video record for the average strain rate of 7.8 × 10⁶ s1. All information for the analysis presented in this paper was obtained from the video and strain records. It was not possible, unfortunately, to differentiate between grain-boundary and transcrystalline cracks during a test.
A statistical analysis of the length of grain-boundary and transcrystalline cracks in the plane perpendicular to the long direction of the columnar grains (Reference GoldGold, 1997) indicated that the formation of cracks under the conditions of the tests was a random process. This paper presents additional information from the same work on this possible random behavior. In the next section, evidence is presented for the statistical nature of the strain dependence of the crack density (cracks m−2). The assumption of random behavior for the spatial distribution of the cracks is considered in section 4.
3. Strain Dependence of the Crack Density
In an earlier study of the statistical characteristics of cracks formed during uniaxial creep, observations on the strain dependence of the crack density were made for applied stresses of 0.6, 0.8, 1.0, 1.2, 1.6, 1.8 and 2.0 MPa at a temperature of –9.5°C. The average grain-size was about 3 mm. Some of this work was reported in Reference GoldGold (1972a, Reference Goldb). An approach by Reference WeibullWeibull (1951) was used in that study to determine a probability distribution function for the dependence of the crack density on stress and strain that was in reasonable agreement with the observations.
One goal of a statistical study can be to find the simplest probability-distribution function that is a satisfactory description of the data. In the present study, it was found that the log-normal distribution appeared to be a better description than that based on the approach of Weibull for both the constant-strain-rate tests and the earlier constant-load tests. This distribution was used, therefore, to describe the statistical dependence of the crack density on strain for both conditions. In order to fit the distribution to the observations, however, it was necessary to determine or estimate the maximum crack density, N 0, that would develop if the random crack-forming process was not interrupted by tertiary creep or failure. For the creep tests, N 0 could be estimated from the observations for stress less than 1.2 MPa as the rate of crack formation tended to zero during the secondary creep stage.
The observations of the strain dependence of the number of cracks formed in a 6 cm × 10 cm central area of each specimen for the creep tests were combined for each constant-stress condition. Cracks formed during the loading of the specimen if the stress was about 0.8 MPa or greater. These cracks were usually small and at grain boundaries. The number of grain-boundary plus transcrystalline cracks, minus the cracks formed on loading, were plotted against strain on a log-normal probability coordinate system using the computer program Kaleida Graph. The ordinate of the plot was n(ε)/N 0, expressed as per cent, where n(ε) is the crack density (m−2) at strain ε. The value for N 0 was varied until a maximum was found for the correlation coefficient for an exponential curve fit to the observations. For those cases for which the random process of crack formation was interrupted by tertiary creep, the exponential curve fit was applied over the range of strain for which the observations indicated that tertiary creep had not yet been initiated.
The curve fit gave an equation of the form:

If the correlation coefficient is sufficiently large, ε0 can be taken as the logarithmic mean of the log-normal distribution approximation for the observations, with s the standard deviation. A table for the standard normal distribution function (see, e.g., Reference Kempthorne and Folks.Kempthorne and Folks, 1971) can be used to determine n(ε)/N0 for given values of Z.
Table 1 presents, for the creep tests, ε 0, s, estimated value for N 0 and the range of strain rate associated with the range in strain for the analysis. The value of N 0 for stress up to 1.2 MPa was found to agree closely with the value expected from the observations. Figure 1 is an example of the exponential curve fit giving a maximum for the correlation coefficient for tests carried out under creep stresses of 0.8 and 1.8 MPa. In the case of the tests for the stress of 1.8 MPa, the range of strain is 0–20 × 10−4 because of the development of tertiary creep at larger strains.
Constants for the strain dependence of the exponential curve fit to the log-normal probability distribution for the crack density found for the creep experiments

Log-normal probability plot for cracks formed in creep experiments for the stresses, σ, of 0.8 and 1.8 MPa (see Table 1). Average grain-size ≈3 mm; temperature –9.5° C.

For the constant-strain-rate tests, the dependence of the crack density on strain for a central 6 cm × 8 cm area of observation was determined for each test from the synchronized video and strain records. The video record was viewed frame by frame at a magnification of about 1.2 on a screen that was about 30 cm square. For this magnification, and by moving back and forth between frames if necessary, it was relatively easy to determine to within one-30th of a second the time of appearance of a bright spot that indicated the formation of a crack. This was found to be the case down to the smallest crack in the crack populations induced under the conditions of the experiments (crack length ≈0.2 mm; Reference GoldGold, 1997).
For nominal strain rates greater than about 10−5 s−1, it would be expected that the ice would fail in a brittle manner. The applied stress for each experiment was limited to 60% of the expected failure stress, so that the random process of formation of cracks would not be interrupted by failure, and the crack density would be sufficiently small not to mask the formation of cracks. The range of strain over which the crack observations were made, therefore, was a small fraction of the hypothetical range that would be expected to be associated with N 0. This caused a problem for the analysis, as the observations defined only the tail of the distributions.
The observations were grouped for each nominal strain rate in the average grain-size ranges of 2–4, 4–6 and 6 mm to the maximum value for the tests. Again, n(ε)/N 0, in per cent, was plotted against strain on a log-normal probability-coordinate system using KaleidaGraph. It was found that as N 0 was increased, the correlation coefficient rose rapidly to a value greater than 0.99 and continued to increase very slowly with increase in N 0, except for the nominal rate of 10−4 s−1, for which maximum values were found. Table 2 gives ε0, s, the value or range in values for N 0 and the corresponding correlation coefficients for the equation for the exponential fit to each set of observations for the three ranges in grain-size.
Constants for the strain dependence of the exponential curve fit to the log-normal probability distribution for the crack density found for the constant-strain-rate experiments

It was found that if the first one or two cracks were included on the plot as specific data points for the analysis, this could result in a lower maximum correlation coefficient. Therefore, these data points, which were at strains of ˂ 1.0 × 10⁴, were excluded. Figure 2 is an example of an exponential fit to data obtained for the average grain-size range of 2 d ˂ 4 mm at the nominal rate of 10−3 s−1, and of 6 d ˂ 9 mm at the nominal rate of 10−5 s−1. The correlation coefficients are given in Table 2. This figure indicates the relatively small percentage of cracks relative to the hypothetical maximum density that was observed for the constant-strain-rate tests.
Log-normal probability Plots for cracks firmed at the nominal strain rates of 10−3 s−1 and 10−5 s−1 (see Table 2). Average grain-size is given by d; temperature –10°C.

Figure 3 shows the strain-rate dependence of the estimated maximum crack density, N 0, for both the creep and the constant-strain-rate tests and average grain-size in the range 2–4 mm. The range in strain rate for the creep tests corresponds to that for the time over which the cracks were observed to form. The range in maximum values for the nominal constant strain rates of 10−3 and 10−5 s−1 is associated with the range in values for the correlation coefficients given in Table 2. It can be seen that N 0 increases rapidly to an apparent maximum with increasing strain rate.
Strain-rate dependence of the actual or hypothetical maximum crack density (see Tables 1 and 2). The range in strain rate for the creep experiments corresponds to the range of strain over which the observed cracks formed; the range in N0 for the constant-strain-rate experiments is associated with the range in value for the corresponding correlation coefficient. Average grain-size ≈3 mm; temperature –9.5°C for the creep experiments and –10°C for the constant-strain-rate experiments.

Figure 4 gives the strain-rate dependence for ε0. It is relatively constant for the range of strain rates for the ductile behavior associated with the creep tests for stress less than 1.0 MPa. It rises to a maximum in the strain-rate range of 10−5 to 10−6 s−1 and drops to a relatively constant value for strain rates greater than about 10−4 s−1, i.e. less than that for fully ductile deformation behavior. Figure 5 presents the strain-rate dependence of, s. It rises quickly to a maximum at a strain rate a little less than 10−5 s−1, then decreases rapidly to values less than that for the fully ductile condition by the nominal rate of 10−4 s−1. The effect of grain-size on the strain-rate dependence of N 0, ε0 and s for the constant-strain-rate tests is indicated in Figure 6. The effect appears to be relatively small for N 0. It appears to reverse with increasing strain rate for ε0 and to increase for s.
Strain-rate dependence for ε0 for the creep and constant-strain-rate experiments (see Tables 1 and 2). The range in strain rate for the creep experiments corresponds to the range of strain over which the observed cracks formed; the range in N0 for the constant-strain-rate experiments is associated with the range in value for the corresponding correlation coefficient. Average grain-size ≈3mm; temperature 9.5°C for the creep experiments and –10°C for the constant-strain-rate experiments.

Strain-rate dependence of the standard deviation, s, for the creep and constant-strain-rate experiments (see Tables 1 and 2). The range in strain rate for the creep experiments corresponds to the range in strain over which the observed cracks formed; the range in N0 for the constant-strain-rate experiments is associated with the range in value for the corresponding correlation coefficient. Average grain-size ≈3mm; temperature –9.5°C for the creep experiments and –10°C for the constant-strain-rate experiments.

Grain-size dependence for N0 (a), ε0 (b) and s (c) from the constant-strain-rate experiments. Grain-sizes, d: filled circles, 2 ˂ d ˂ 4 mm; diamonds, 4 ˂ d ˂ 6 mm; triangles, ˃6mm. Temperature –10°C.

4. Spatial Distribution
Reference GoldGold (1972a) studied the spatial distribution of cracks formed in the same type of ice under a constant uniaxial compressive stress applied perpendicular to the long direction of the grains. After completion of a test, the specimen surface perpendicular to the long direction of the grains was divided into a grid of equal squares. If the spatial distribution of the cracks is truly random, the probability of finding exactly k cracks in any square should be given by the Poisson distribution:

where λ is the expected or mean number of cracks per square.
In the earlier work, several specimens were strained to 15 × 10−4, 25 × 10−4 and 50 × 10−4 under a stress of 1.0 MPa. A grid, 6 cm × 10 cm, subdivided into 2 cm × 2 cm squares, was placed on the central area of the surface of each specimen, and the number of cracks in each square was counted. The total number of squares containing exactly k cracks for all the specimens strained to each given value above, was determined and compared to the expected number given by the Poisson distribution. In some cases it was necessary to combine the number of squares with successive numbers of exactly k cracks in order to have sufficient for the analysis. The crack numbers that have been combined for each strain condition are shown in the columns headed N in Table 3. A measure of the agreement between the observed and predicted number of squares was obtained using the χ 2 test. Table 3 gives the calculated χ 2 and the theoretical value for  for each set of results. According to the χ 2 test, the hypothesis that the formation of the cracks had a spatial Poisson distribution would have to be rejected at the 5% level for the populations formed in total strain of 15 × 10−4 and 25 × 10−4, but was acceptable at the strain of 50 × 104. At this strain, the value of λ was so large that the assumption of a normal distribution was also acceptable at the 5% level (the Poisson distribution tends to the normal distribution with increasing λ).
Distribution in the number of cracks formed in 2 cm × 2 cm squares for columnar-grain specimens strained a given amount, ε, by a constant uniaxial load of 1 MPa

For the constant-strain-rate tests, the video record for each test was viewed frame by frame. A transparent film was placed on the surface of the view screen, and the location of each crack in the central 7 cm × 10 cm area of each specimen was marked as it formed. The period during which the formation of cracks was observed was divided into two to four consecutive groups of video frames, the number depending on the nominal strain rate for the test. A different color was used for each group to locate the position of the crack.
A grid of 12 squares was inscribed on the transparent sheet. The size of each square was equivalent to 2 cm × 2 cm on the original ice surface. The viewing area defined by the grid was equivalent to an area 6 cm × 8 cm, located so that only cracks that were at least 1.5 cm from the edges of the specimens and 6 cm from their ends were counted. For each nominal strain rate, the specimens were grouped according to whether their average grain-size was less or greater than 5 mm. The number of cracks in each square was counted for each specimen. The total number of squares with a given number of cracks was determined for the specimens in each grain-size range and nominal strain rate, and compared to the theoretically expected value determined from the Poisson distribution. In some cases it was necessary to combine the number of squares for successive numbers of exactly k cracks, as was done for the constant-load experiments. Table 4 gives the crack numbers that were combined, the calculated χ 2 and the theoretical value for for the two grain-size ranges and three nominal strain rates. It can be seen that the assumption of a Poisson distribution is rejected at the 5% level for the nominal rates of 10−3 and 104 s1 and grain-size of ˂5mm, but cannot be rejected for the other conditions. The constant-strain-rate and constant-stress experiments indicate that the spatial distribution becomes increasingly Poisson with increasing strain, decreasing strain rate and increasing grain-size.
Distribution in the number of cracks formed in 2 cm × 2 cm squares for columnar-grain specimens strained to 6 × 10⁴ to 9 × 10⁻⁴ at the nominal rate of strain,


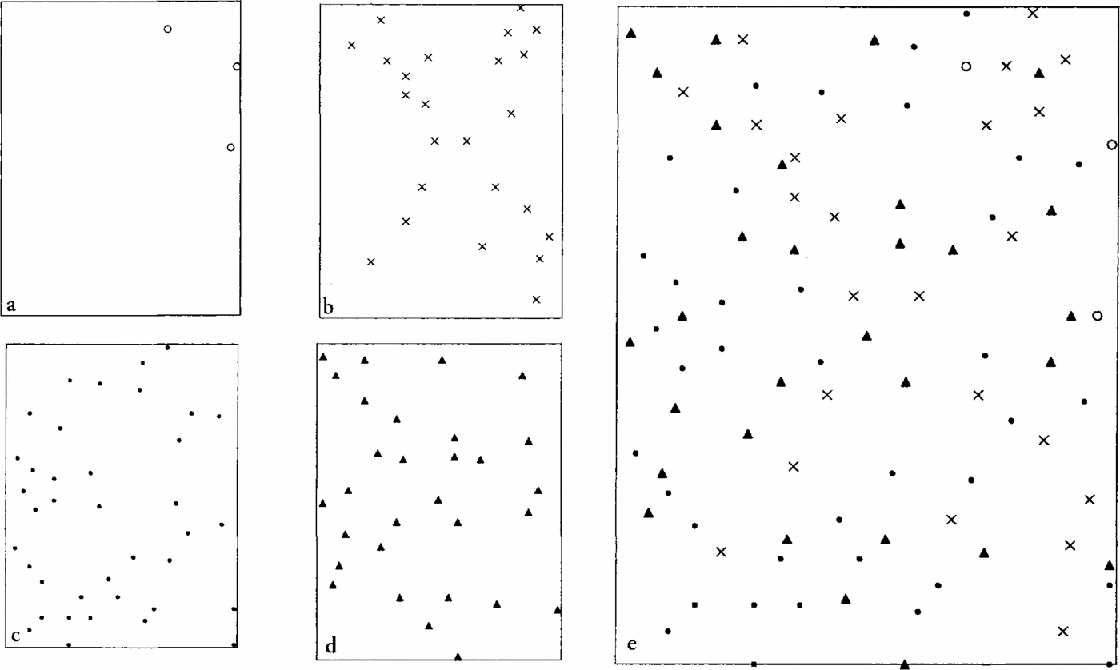
A possible reason for the distribution of cracks not to be fully random can be understood from Figure 7, a plot of the position of the cracks formed in successive ranges of strain corresponding to the consecutive grouping of the video frames, for a specimen of average grain-size 2.3 mm strained at the nominal rate of 10−3 s−1. This figure shows that, for some ranges of strain, there appeared to be a tendency for the alignment of cracks to be influenced by the shear stress. The nature of the distribution in the cracks varied from one specimen to the next, but usually the final distribution appeared to be relatively uniform over the area in which the crack positions were marked, as in Figure 7. For a very few-specimens, only one band of aligned cracks was observed. It was about 5 cm wide and usually included a significant proportion of the total number of cracks.
Spatial distribution of cracks formed in given ranges of strain, ε, in a specimen of average grain-size 2.3 mm, strained at the nominal rate of 10−3 s−1. (a) 2.58 × 10⁴˂ ε ˂3.34 × 10⁻⁴; (b) 3.34 × 10⁻⁴ ˂ ε ˂ 4.5 × 10⁻⁴; (c) 4.5 × 10⁻⁴ ˂ ε ˂ 5.22 × 10⁻⁴; (d) 5.22 × 10⁻⁴ ˂ ε ˂ 6.0 × 10⁻⁴; (e) all cracks, with symbols the same as for (a–d). Temperature –10°C.
5. Discussion
Figures 3–5 show that there is a maximum in N 0, ε0 and s at the strain rate of about 10−5 s−1. This order of strain rate is about the same as that for the brittle to ductile transition found for the deformation behavior of columnar-grain ice subject to the same conditions of loading (Reference SandersonSanderson, 1988). Reference GoldGold (1997) found a maximum for the crack length at about the same rate of strain. He also found that for total strain of 6 × 10⁻⁴ to 9 × 10⁻⁴, applied in the constant-strain-rate tests, the proportion of grain-boundary cracks decreased from about 100% at the nominal strain rate of 102 s1, to about 65% at the nominal rate of 10−5 s−1. The delayed elastic component of the strain increased with decreasing strain rate and there was a significant plastic component at the nominal rate of 105 s1 (Reference GoldGold, 1994). In summary, the occurrence of the maxima with decreasing strain rate is associated with an increasing proportion of transcrystalline cracks and an increasing delayed elastic and plastic strain.
Reference ColeCole (1988) showed that for strain rate greater than 10−5 s−1 and strain less than 10−3, there is insufficient time for dislocations processes to be significant for crack initiation in ice. Reference GoldGold (1997) showed that the strain-rate dependence of the average crack length for the grain-boundary cracks was consistent with nucleation by the singularity-induced stress at triple points. The strength of the singularity decreased with increasing strain rate to the value expected for the small anisotropy in the elastic constants of ice at the strain rate of about 10−2 s−1 (Reference Tvergaard and Hutchinson.Tvergaard and Hutchinson, 1988). One would surmise from this, and the observations above, that the maxima result from the strain-rate-dependent interplay between dislocation mechanisms favoring the formation of transcrystalline cracks, and non-dislocation mechanisms favoring the formation of cracks in grain boundaries at triple points. It is significant that the statistical behavior of the crack populations is sufficiently robust that the transition is clearly present in their statistical characteristics.
For the great majority of the grain-boundary cracks in the constant-strain-rate experiments, at least one edge was at a triple point. The grain density ranged from about 2.6 × 10⁴ m−2 for an average grain-size of 7 mm to about 14 × 104 m−2 for an average grain-size of 3 mm. The number of triple points available for the formation of cracks at grain boundaries suitably oriented with respect to the applied stress (about ±60° to the applied stress; Reference GoldGold, 1966) is about twice the grain density, i.e. about 5 × 10⁴ to 28 × 104 m−2. This is of the same order as the range in the hypothetical maximum crack density for the nominal strain rate of 10−3 s−1, indicating that, with sufficiently large strain rate, every suitably-oriented grain boundary is a candidate for a crack.
The standard deviation can be viewed in two ways in this study of the statistical characteristics of crack populations. In the analysis of crack lengths (Reference GoldGold, 1997), it is a measure of the spread in the crack-length distribution. For the dependence of the crack density on strain it is a measure of the range of strain over which the distribution is distributed. In the earlier work on crack formation during creep (Reference GoldGold, 1972a, Reference Goldb), it was found that the mean strain for the assumed distribution was relatively constant for a stress of 1 MPa or less, as was also found for the log-normal distribution shown in Figure 4, and the rate of formation of the cracks tended to zero with increasing strain. Almost 95% of the cracks had formed by the strain of 150 × 10−4, and the crack populations conformed well with the derived-distribution curve. The situation changed at a stress of about 1.2 MPa or strain rate of about 106s−1. At about this stress a tertiary stage began to appear in the creep curves, and the crack populations began to deviate from the derived distribution at strains of about 50 × 10−4 or less. Beyond that strain, the rate of cracking tended to become constant or even increase.
For the constant-strain-rate experiments, the range of strain associated with the hypothetical crack-density distribution could not be observed directly because, as pointed out earlier, each experiment would have been interrupted by failure. What is happening physically can be appreciated from the strain dependence of s (Fig. 5) and Figure 8, which is a log-normal probability plot of the crack-density distribution for the fully ductile condition for the constant stress of 0.6 MPa, and the observed and hypothetical portions for the average maximum value of s in Table 2 at the nominal strain rates of 103 and 105 s−1. With increasing strain rate, the range of strain associated with the hypothetical crack-density distributions increases to a maximum (maximum s) and then decreases to a value for the more elastic condition that is less than that for the fully ductile condition. Reference GoldGold (1998) has combined this information with published information on the strain-rate dependence of the strain at failure for columnar-grain ice under the same conditions of loading (see, e.g.,Reference SinhaSinha, 1981, Reference Sinha1982), to obtain an estimate of the critical crack density at yield or failure. Figures 3–6 and 8 give an appreciation of the challenge of incorporating damage into a rheological model for ice, even for the uniaxial loading of columnar-grain ice. The present work indicates the nature of the probability-based statistical connection between the elastic, delayed elastic and plastic deformation of ice, and yield and failure.
Observed (solid lines) and hypothetical (dashed lines) crack-density distribution for stress = 0.6 MPa, s = 0.62; = 103 s1, s = 0.385; = 105 s1, s = 1.25. Grain-size ≈3mm; temperature –9.5°C for the constant-load condition and –10°C for the constant-strain-rate conditions.

The randomness in the crystallographic orientation of the grains and in the characteristics of potential stress singularities in and between grains, is built in at the time the ice is made. As suggested in Reference GoldGold (1997), it would seem reasonable to assume that the combination of random crystallographic orientation and properties of the stress singularities would result in a randomly variable internal strain-energy field. The observations made in the experiments should give information on the component of the strain-energy field that is available for the formation of cracks and how it evolves under the applied load in a manner that depends on the stress, strain, rate of strain, temperature and the shape, size and relative orientation of the grains. The inducing of cracks is an experimental means of making manifest the statistical characteristics of the underlying variable strain-energy distribution, at least to the extent that the crack length is a reasonable measure of that energy.
The spatial distribution of cracks formed in a small range of strain indicated interaction between stress singularities in the same shear band, as shown in Figure 7. This interaction, however, appears not to have had much effect on the distribution functions determined from the crack-length and crack-density analysis. This would be expected if the interaction is small, as the observations were grouped in successive increments of crack length or strain. Within each increment of length or of strain, the order in which the cracks form is not important for defining the distributions. It is clear, however, from this work and that of others (e.g. Reference SchulsonSchulson, 1990; Reference DaleyDaley, 1992; Reference Jordaan and Xiao.Jordaan and Xiao, 1992), that the failure event depends on the way deformation-induced damage evolves and that the evolution of the damage is very dependent on the stress conditions imposed on the boundaries of the ice body.
If the crack-forming process is truly random, then there is justification for exploring the possible use of set theory for calculations involving crack populations. In addition, a log-normal distribution for the total crack population implies a log-normal distribution for the grain-boundary and trans-crystalline populations (Reference CramérCramér, 1966). If the crack populations are a valid measure of the underlying strain-energy distribution, it would be of interest to investigate the degree of independence between that portion of the strain-energy distribution giving rise to grain-boundary cracks and that portion giving rise to transcrystalline cracks. This question is relevant to the assumption that the statistical nature of the crack-forming processes is determined by the random crystallographic orientation and other properties of the ice built in at the time the ice is formed. Exploring such questions could provide additional insight into the stress, strain, strain rate and temperature dependence of deformation mechanisms for ice and their dependence on grain-size, shape and crystallographic orientation. It would be of interest, in this regard, to explore cavity formation and the factors on which it depends as part of the continuum of deformation behavior.
6. Conclusions
The log-normal distribution function provides a reasonable description of the statistical nature of the strain dependence of the crack density for columnar-grain ice subject to uniaxial stress perpendicular to the long direction of the grain boundaries. The spatial distribution of the cracks was found to deviate from random for grain-size less than 5 mm and total strain less than 50 × 10−4. The formation of a crack may favor the initiation of other cracks in a common shear band, but this does not appear to affect the statistical distributions for the crack density or the crack length. Random crystallographic orientation and structural properties of the columnar grains, built in at the time the ice was formed, are probably the reason for the observed random process of crack formation.
Acknowledgements
The author expresses his gratitude to the Institute for Marine Dynamics of the National Research Council of Canada and, in particular, to S. J. Jones for the opportunity to carry out this study of crack formation in ice. He is indebted to T. Slade for his most valuable assistance in preparing specimens and carrying out the experiments.



