


1. Introduction
Information on spatial variability of snow chemistry is essential in glaciochemical studies. Some authors (Reference MulvaneyMulvaney and Wolff, 1994; Qin,1995; Reference StenbergStenberg and others, 1998; Reference KreutzKreutz and Mayewski, 1999), reporting Antarctic glaciochemical data measured at stations characterized by different distances and elevations inland, show that there are still large areas lacking in data. Moreover, due to the high spatial variability in aerosol composition, scavenging processes, snow accumulation, wind distribution and firnification processes on regional as well as local scales, intensive research is required in order to understand the chemical–physical processes involving concentration changes of chemical species in Antarctica.
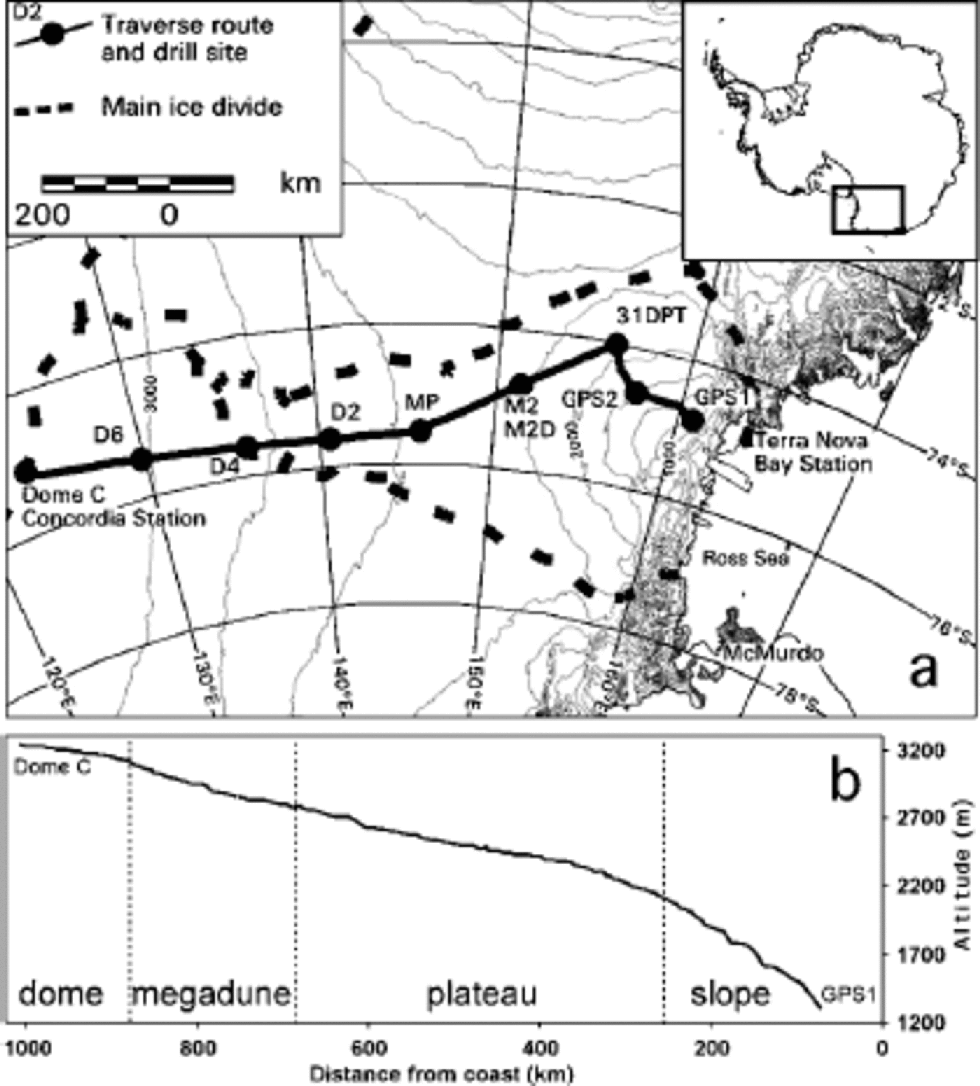
To improve knowledge of the spatial variability of climate and environmental conditions over the eastern Dome C drainage area, a traverse was performed from Terra Nova Bay (northern Victoria Land) to Dome C (East Antarctic plateau). In the framework of the PNRA–ITASE (Programma Nazionale di Ricerche in Antartide–International Trans-Antarctic Scientific Expedition) project, during the field season 1998/99, 227 samples of surface snow (1m cores) were collected, with a spatial resolution of about 5 km, along a traverse route from coastal areas (GPS1) to about 1000 km inland (Dome C), with an altitude range of 1200–3230ma.s.l. (Table 1). Thirty shallow firn cores (10– 50m long) and seven snow pits (about 2 m deep) were also sampled with a lower spatial resolution (about 70–160 km; Fig. 1a). Here, we report the results of chemical, tritium and stable-isotope analyses of the 227 samples of surface snow, four snow pits (M2, MP, D2 and D4) and the first 2m of two shallow firn cores (M2 and M2D).
Several authors (Reference WatanabeWatanabe,1978; Reference Pettré, Pinglot, Pourchet and ReynaudPettré and others, 1986; Reference GoodwinGoodwin, 1990; Reference Frezzotti, Gandolfi and UrbiniFrezzotti and others, 2002) have pointed out the influence of katabatic wind on the snow-accumulation redistribution process. This wind is the main element acting on the snow surface that causes surface ablation and snow transport/redistribution. Many types of surface features, such as sastrugi, snow dunes, pitted patterns and smoothed and glazed surfaces (wind crusts), are distributed on the surface of the Antarctic ice sheet in varying degrees of scale and occurrence as a result of interaction between the air and the ice-sheet surface. These aeolian processes affect the snow accumulation and chemical and isotopic composition during firnification. Reference Frezzotti, Gandolfi and UrbiniFrezzotti and others (2002) pointed out that along the traverse, erosional features (wind crust) constitute 31%, redistribution features (sastrugi) 59% and depositional features only 10% of surface features. Wind crusts are present along the traverse where the slope is >4mkm–1 (Reference Frezzotti, Gandolfi and UrbiniFrezzotti and others, 2002). Trenches cut along the traverse (M2 and M2D sites) in the presence of wind crust show the depth-hoar layer (up to 2 m deep), with a very coarse grain-size (up to 1mm). Under a strongly developed windcrust, the depth-hoar layer clearly indicates prolonged sublimation and upward transport of water vapour due to a hiatus in accumulation and therefore a long, multi-annual, steep temperature-gradient metamorphism (Reference GowGow,1965; Reference Fujii and KusunokiFujii and Kusunoki, 1982).
(a) ITASE traverse route and main sample sites. (b) Topographic profile vs distance from coast.
2. Site Description
Surface elevation profiles and local topography along the Terra Nova Bay–Dome C traverse were measured by global positioning system (Urbini and others, in press), whereas regional surface topography was analyzed using a digital elevation model of Antarctica with ground resolution of 1km, provided by Reference Rémy and ShaefferRémy and others (1999). the traverse crossed the entire basin of David Glacier, the largest outlet glacier in Victoria Land. It drains the inner part of the plateau flowing from eastern Dome C. the David Glacier catchment area ends 340 km short of the Dome C culmination (Reference Frezzotti, Tabacco and ZirizzottiFrezzotti and others, 2000). the first 340 km of the eastern Dome C drainage area flows into the Ross Ice Shelf. for logistic requirements (crevassed areas and fuel deposits) the traverse did not follow a straight line between GPS1 and Dome C (Fig.1a).
The topographic profile of the traverse (Fig.1b) indicates four sectors: the slope area between GPS1 and about 250 km from the coast has a slope value up to 2.5% and is characterized by redistribution (sastrugi) and erosional features (wind crusts); the plateau area from 250 to 680 km has a slope up to 0.45 % and is characterized primarily by redistribution micro-relief and secondly by erosional features; the megadune area between 680 and 875 km has a steady value of 0.2–0.1%; and the dome area from 875 to 1010 km has a slope of 50.2 % and is characterized by depositional features (Reference Frezzotti, Gandolfi and UrbiniFrezzotti and others, 2002). the slope profile shows very high variability along the slope and plateau area, and a homogeneous slope in the dome area (Fig. 1b). Snow accumulation decreases from the coastal area to the plateau, with values of 30–150 kg m–2 a–1 (Reference Giovinetto and Bentley.Giovinetto and Bentley, 1985).
3. Sampling and Analytical Methods
Surface snow was sampled up to 1m by a hand-operated driller, then sealed in polyethylene bags and kept frozen. These 1m cores were cleaned by removing the outer part of the core with a stainless-steel scraper, then entirely melted and analyzed.
The snow pits were dug and the snow walls were cleaned by removing a 30–50cm layer with a shovel, and a 10–15 cm layer with a stainless-steel scraper, before sampling. the sampling procedure is reported in Reference Udisti, Becagli and PiccardiUdisti and others (1999).
The shallow firn cores (10–50mdepth)were drilled using an electromechanical drilling system. Samples were stored in polyethylene bags under frozen conditions. After surface cleaning in a cold room, the shallow firn cores were sampled every 3–4cm.
The analyses of MSA, Cl–, NO3 –, SO4 2–, Na+, K+,Mg2+, Ca2+ were performed by ion chromatography, following the procedures reported in Reference Gragnani, Smiraglia, Stenni and TorciniGragnani and others (1998) and Reference Udisti, Becagli and PiccardiUdisti and others (1999). Stable-isotope analyses were performed following the procedures reported in Reference StenniStenni and others (2002). Tritium analyses were carried out by liquid scintillation counting using a 1220 Quantulus apparatus after tritium enrichment obtained by electrolysis cells with stainless-steel electrodes from an initial weight of 250 g to a final weight of 20 g. Tritium values are given in tritium units (TU) where 1TU corresponds to T/H =10–18 calculated at the sampling date (November 1998–January 1999). Errors range from 1TU (2σ) at the background level to 3 TU at the level of 35 TU.
4. Results and Discussion
4. 1. Snow pits and shallow firn cores
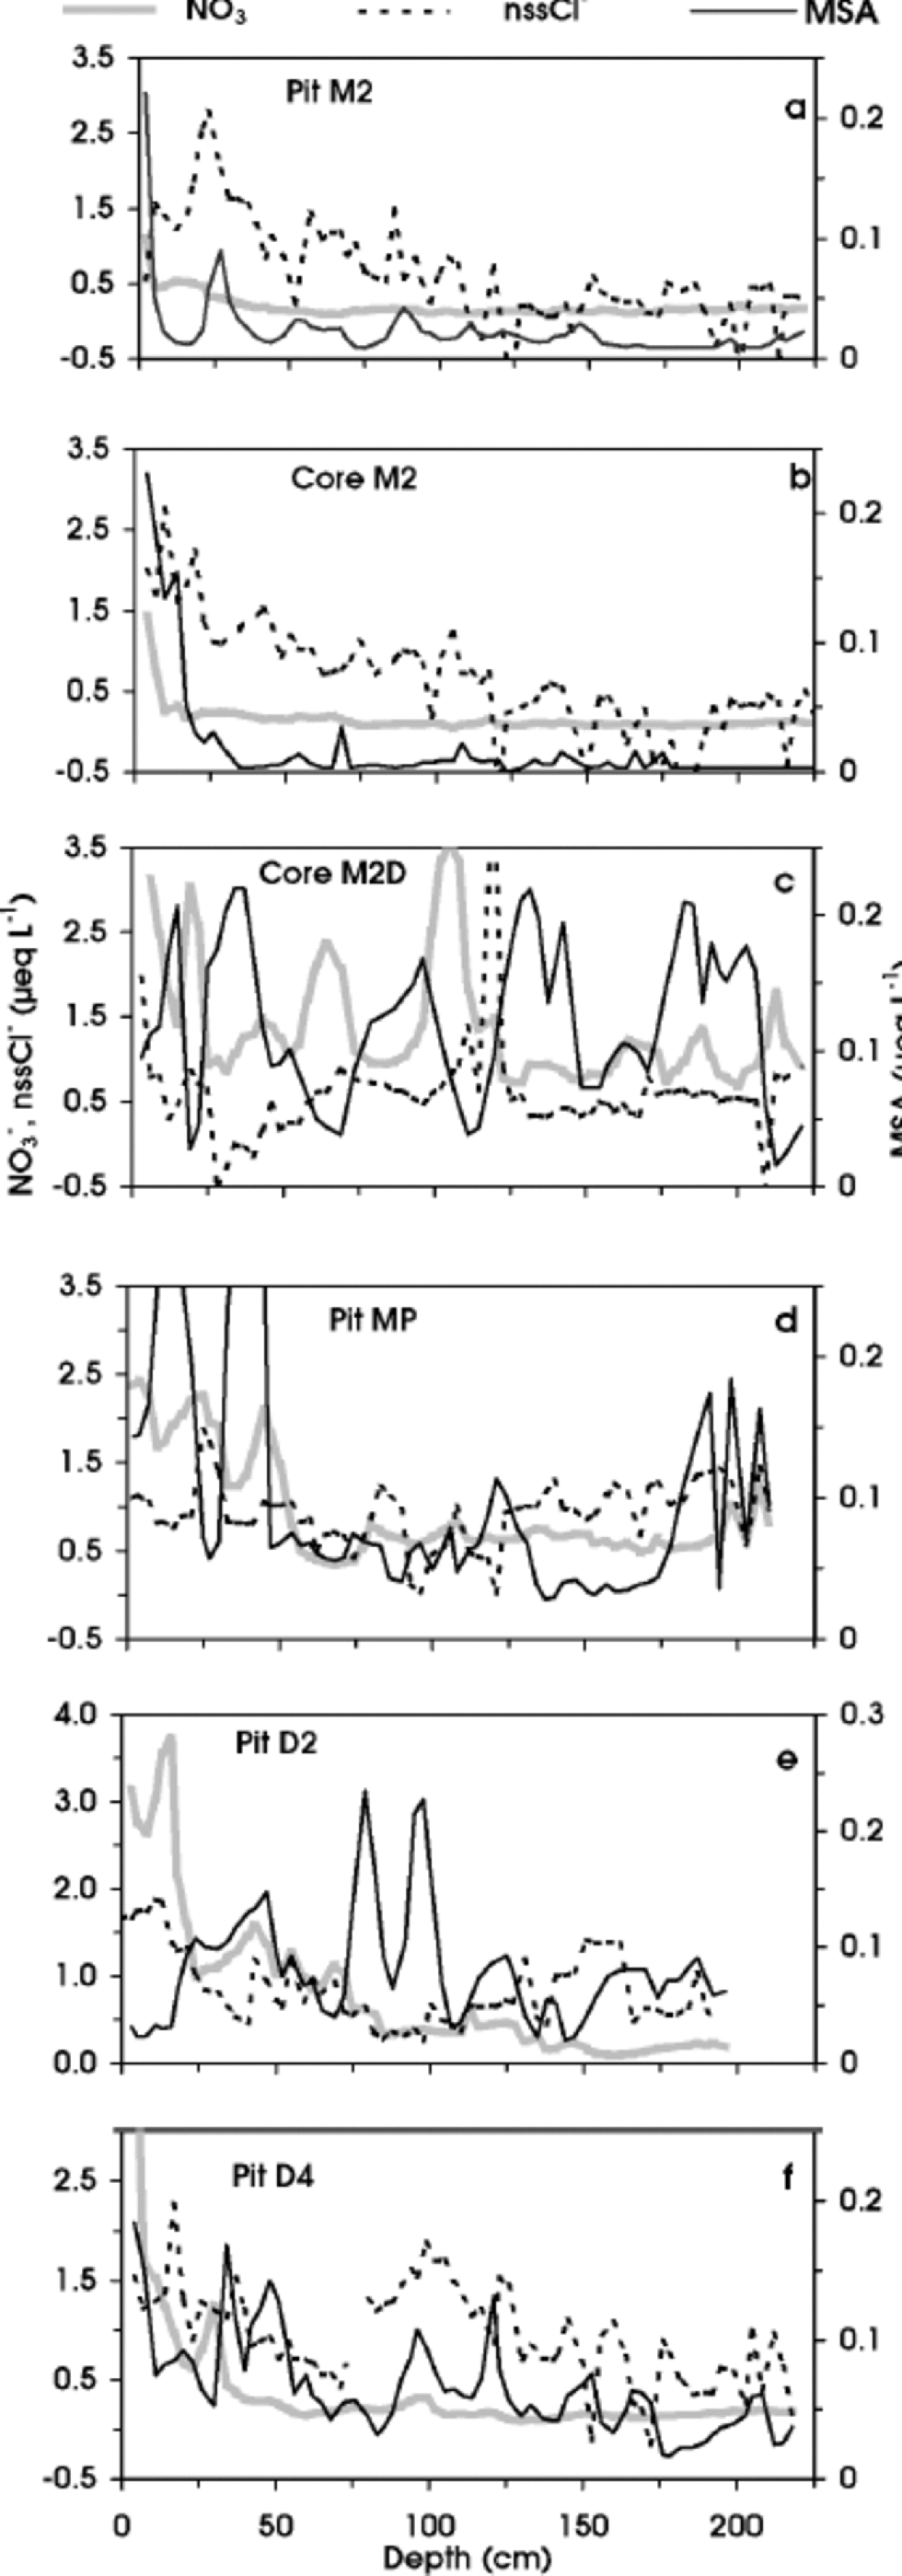
Here we looked at depth/concentration profiles of Cl–, NO3 – and methanesulphonate, because their acidic species (HCl, HNO3 and MSA) are relatively volatile and their concentrations could be affected by movement in the snow layers and re-emission into the atmosphere, especially at stations with low accumulation rate (580 kg m–2 a–1) (Reference Wolff and DelmasWolff, 1995, Reference Wolff, Wolff and Bales1996; Reference Legrand, Léopold, Dominé, Wolff and BalesLegrand and others, 1996; Reference Wagnon, Delmas and LegrandWagnon and others, 1999). Such post-depositional processes can change the original snow composition and are characterized by a decreasing trend in concentration from the surface to the deeper layers. Indeed, a different pattern of Cl–, NO3 – and MSA is shown by Figure 2a–f. the uppermost snow layers of station M2 (pit M2 and core M2), located 327 km from the coast at 2308ma.s.l. (Fig. 1a), are characterized by relatively high concentrations of NO3 –, nssCl– and MSA (Fig. 2a and b), but their concentrations quickly decrease, reaching very low background values (NO3 – = 0.2, nssCl– 0.2 and MSA = 0.01 μeq L–1) in the sub-superficial layers. In contrast, no such dramatic decrease is visible in the M2D core (Fig. 2c) (average values: NO3 – = 1.4, nssCl– = 0.57 and MSA = 0.12 μeq L–1), located only a few kilometres away (Table 1). the two stations have very different surface physical features: M2 is characterized by the presence of a wind crust and depth-hoar layer (up to 2 m depth), while at M2D no wind crusts were found. At increasing distance from the coastline, at MP and D2 pits (located 460 and 586 km, respectively, from the coast), chemical profiles show a sharp decrease with depth only for NO3 – (Fig. 2d and e). Finally, at D4 station (plateau area) the profiles show a clear decreasing trend for NO3 – and nssCl– (Fig. 2f). Therefore, along the PNRA–ITASE traverse, such a perturbation of superficial layers shows a progressive pattern as distance from the sea increases, with a higher sensitivity for NO3 –. Post-depositional losses of gaseous HNO3 and HCl have been observed at many central Antarctic sites and attributed to the low-accumulation-rate effects (e.g. Reference De Angelis, Legrand and DelmasDe Angelis and Legrand, 1995; Reference Dibb and Whitlow.Dibb and Whitlow, 1996; Reference Wagnon, Delmas and LegrandWagnon and others, 1999). Indeed, we observed Cl– and NO3 – decreasing in stations with accumulation rates 550 kg m–2 a–1 (MP and D4) (Reference Giovinetto and Bentley.Giovinetto and Bentley, 1985), or characterized by wind ablation processes, which can give rise to a long hiatus in accumulation (M2). Moreover, the concentration decreasing with depth shown by the MSA profile at M2 station (Fig. 2a and b) is similar to that found at Vostok (Reference Wagnon, Delmas and LegrandWagnon and others, 1999), where the snow-accumulation rate is only about 20 kg m–2 a–1 (Reference JouzelJouzel and others, 1993). to explain this finding, Reference Wagnon, Delmas and LegrandWagnon and others (1999) suggested possible re-emission into the atmosphere by a significant contribution of MSA in gas phase.
Depth profiles of NO3 –, nssCl– and MSA in pit M2 (a), core M2 (b), core M2D (c), pit MP (d), pit D2 (e) and pit D4 (f).
Geographic location of the sampling sites

Although the mechanisms involved in the post-depositional processes are not yet satisfactorily understood (Reference De Angelis, Legrand and DelmasDe Angelis and Legrand, 1995; Reference Wolff, Wolff and BalesWolff, 1996), the multi-annual steep temperature-gradient metamorphism (due to wind scouring and/or small precipitation) seems to be a powerful discriminating parameter for all three examined compounds. ITASE stations confirm that re-emissions of HNO3, HCl andMSA into the atmosphere can heavily affect the preservation in the snow of these potentially relevant environmental and climatic markers.
4.2. Surface snow
4.2.1. Stable isotope
The δ18O values obtained from 227 surface snow samples (1m cores) are presented in Figure 3a as a function of distance from the coast. A decreasing trend may be observed, with more δ18O depleted values occurring inland and at higher elevation, which is the result of temperature decrease with increasing altitude. An elevation gradient of –1‰(100m)–1 has been calculated for the whole traverse. the δ18O values of the traverse exhibit high spatial variability, with a larger scattering observed in the first part of the traverse up to 350 km from the coast; on the other hand, δ18O values from 750 km to Dome C exhibit more or less constant values. This distribution pattern may be related to the different topography encountered along the traverse. the first part is characterized by steeper slopes with redistribution and erosional aeolian features, and therefore more affected by wind scouring; while on the plateau the slope decreases and is characterized by redistribution and depositional aeolian features.
δ18O (a) and tritium (c) values in surface snow vs distance from coast. (b) δ18O/T: solid line (A) shows the least-squares regression between δ18O and temperature for surface snow (open circles) along the ITASE traverse; dotted line (B) shows the northern Victoria Land regression (Reference StenniStenni and others, 2000); and dashed line (C) shows the Terre Adélie regression (Reference Lorius and MerlivatLorius and Merlivat, 1977).

Linear relationships between δ18O and mean annual surface temperatures (T) at sampling sites have been reported for different Antarctic regions (Reference Lorius and MerlivatLorius and Merlivat, 1977; Qin and others, 1994). In general, the geographical dependence of this spatially derived relationship relies mainly on differences in the climatological situations and in the moisture-source regions supplying the precipitation over different parts of Antarctica. the spatial δ18O/T relationship obtained in this study is presented in Figure 3b. the surface temperatures used to reconstruct the least-squares regression have been calculated interpolating the available temperatures as measured at 15m in the core, and elevation along the traverse (Reference Frezzotti and FloraFrezzotti and Flora, in press). A good correlation (R2 =0.83) is observed between δ18O values and site temperatures for this dataset, with a δ18O/T gradient of 0.99‰ ˚C–1. This value is higher than the Reference Lorius and MerlivatLorius and Merlivat (1977) gradient of 0.75‰˚C–1 found in the region from Dumont d’Urville to Dome C in Terre Adélie and is commonly used in East Antarctica for palaeotemperature reconstruction. the Reference Lorius and MerlivatLorius and Merlivat (1977) equation and that obtained in northern Victoria Land for more coastal sites (Reference StenniStenni and others, 2000) are also reported in Figure 3b for comparison. the observed difference among these regression lines could be related to different oceanic source regions delivering moisture to the continent. Recently, Reference Delaygue, Masson, Jouzel, Koster and HealyDelaygue and others (2000) have used an atmospheric general circulation model to show that most of the moisture that precipitates in Antarctica originates in the subtropical and mid-latitude regions, with moisture from the proximal ocean basin influencing a given region.
4.2.2. Tritium
The preliminary results obtained from the tritium analyses of the surface samples (1m cores) collected along the traverse are presented in Figure 3c. the tritium trend is in agreement with those observed in Antarctica before emission into the atmosphere of artificial tritium produced by the thermonuclear bomb tests (1952–68) that arrived in Antarctica after a 2 year delay (Reference Jouzel, Merlivat, Pourchet and LoriusJouzel and others, 1979).
Except for a few anomalous values between GPS1 and GPS2, a positive trend is observed in the tritium activity moving inland and with higher elevation. These variations are mainly related to changes in both elevation and distance from the coast, being the route of the traverse nearly parallel to 75˚ S of latitude. the observed increase may be due to a more efficient winter exchange between stratosphere and troposphere at higher elevations. However, changes in the accumulation rate occurring at different sampling sites cannot be discounted. A positive correlation between tritium activity and elevation has been observed previously in Antarctica by Reference Merlivat, Jouzel, Robert and LoriusMerlivat and others (1977), while Reference Jouzel, Merlivat, Pourchet and LoriusJouzel and others (1979) reported an increase of tritium values with increasing distance from the coast.
4.2.3. Primary aerosol
Primary aerosol components, essentially comprising wind-borne sea salt (Na+, Cl–, Mg2+ and partially SO4 2–) and crustal (Ca2+ and K+) sources, show the highest spatial variability, with a general and fast decrease as the altitude and distance from the sea increases. Figure 4a–c show the inland traverse profiles of Na+, Cl– and Mg2+, which are all very similar. In the 70–250km range, their concentration quickly decreases from the high values measured near the coast to values about 10 times lower, following an exponential pattern. This progressive pattern is heavily modulated by spikes and abrupt, in-phase, oscillations of all three components, probably due to salt-storm events which are more frequent in the winter periods (Reference Udisti, Becagli and PiccardiUdisti and others, 1999; Reference StenniStenni and others, 2000). from 270 to 1000 km, all three elements show relatively constant background values, with very low-intensity spikes.
Na+(a), Cl–(b), Mg2+(c), SO4 2–, nssSO4 2–and SO4 2–/ nssSO4 2–(d), and Ca2+and K+(e) concentrations in surface snow vs distance from coast.

As seen in Figure 1b, the first distance range shows the highest altitude gradient, with an altitude increase of about 1000m (from 1200 to 2200ma.s.l.) in the first 180 km. the next 1000m elevation increase (up to 3200ma.s.l. at Dome C) is achieved along 800km, with a gradient 4.5 times lower. As distance from the coast and altitude contemporaneously increase, it is impossible to assess which is the crucial parameter in determining the penetration of these compounds inland on the Antarctic ice sheet. Reference MulvaneyMulvaney andWolff (1994) and Reference KreutzKreutz and Mayewski (1999) found that altitude is a more significant parameter than distance from the coast. Measurements carried out at the coastal site of northern Victoria Land (Reference Udisti, Becagli and PiccardiUdisti and others, 1999) confirmed the dominant effect of altitude on the scavenging processes of primary marine aerosol in the first 1500ma.s.l. Therefore, from the transect data, the distance of 270 km from the coast, i.e. at altitudes of about 2000ma.s.l., could be considered as a boundary area for the transport of primary marine aerosol. Beyond this area, the concentration of sea-salt components shows more constant levels (plateau background values).
The total SO4 2– traverse profile (Fig. 4d) shows a more complex pattern than the wind-borne sea-salt compounds. Like Na+, Cl– and Mg2+, in the 70–270km range, SO4 2– concentration shows a decreasing trend modulated by several spikes. Minimum values, about five times lower than coastal levels, are measured at about 250 km from the coast. Beyond 270 km, the SO4 2– concentration progressively increases to about 2.3 μeq L–1 in the range 550–750km from the coast. for the farthest sites, the concentration levels show large fluctuations around mean values of about 2 μeq L–1, with an absolute minimum at about 940km from the coast. Many other compounds, such as Cl–,Mg2+, Ca2+, NO3 – and MSA, show minimum values at this distance (Fig. 4b, c and e and 5c and d). Unlike the sea-salt markers, SO4 2– shows several spikes regularly distributed all along the traverse. the SO4 2– trend is mainly driven by changes in the relative importance of the two main contributions: wind-borne sea salt and marine biogenic sources. In the first step (70–270km), wind-borne sea-salt contribution is dominant and so the SO4 2– profile is similar to those of Na+, Cl– and Mg2+ (Fig. 4a–c). As distance increases, the secondary contributor (nssSO4 2– from oxidation of dimethylsulphide (DMS) emitted by phytoplanktonic activity) becomes more and more important (Fig. 4d), because the diameter of the related aerosol particles is shifted toward the finest size fraction, and the secondary aerosol is mainly affected by long-range atmospheric transport (Reference Saltzman, Savoie and ProsperoSaltzman and others, 1983,Reference Saltzman, Savoie, Prospero and Zika.1986; Reference Pszenny, Castelle, Galloway and DucePszenny and others, 1989).
The high variability of the SO4 2– concentration at the plateau sites could be related to wind scouring at the different sampling stations. Snow accumulation generally decreases with altitude and distance from the coast, but the local topographic condition (slope) drives the wind scouring and therefore redistribution and ablation processes (Reference Frezzotti, Gandolfi and UrbiniFrezzotti and others, 2002).
Figure 4e shows the spatial profiles of Ca2+ and K+. These components arise from two main sources: crustal and marine primary aerosol (Reference Legrand, Lorius and Petrov.Legrand and others, 1988). As with total SO4 2–, the sea-salt fraction is dominant in the first distance range (70–270km), where a pattern very similar to that of Na+ is evident. A concentration decrease occurs in this range, where Ca2+ and K+ concentrations reach minimum values, about 5–10 times lower than the values measured at the sites nearest to the coast. Beyond 270 km, the background level remains relatively constant around values of 0.4 and 0.03 μeq L–1 for Ca2+ and K+, respectively. Unlike sea-salt compounds, these background values are heavily modulated by high spikes, probably caused by dust depositions from intrusion of air masses transporting continental aerosols. Peaks in both profiles are particularly evident at the sites located at about 500, 570, 740, 850 and 980 km from coast. Ca2+ and K+ peaks are not perfectly in phase with each other, and the relative heights are different, but they are located at the same distance from the sea.
nssCa2+and nssK+(a), nssCl– (b), NO3 – (c) and MSA (d) concentrations, and R% ((MSA/MSA + nssSO4 2–)×100) (e) values, in surface snow vs distance from coast. the dashed line shows the linear regression.
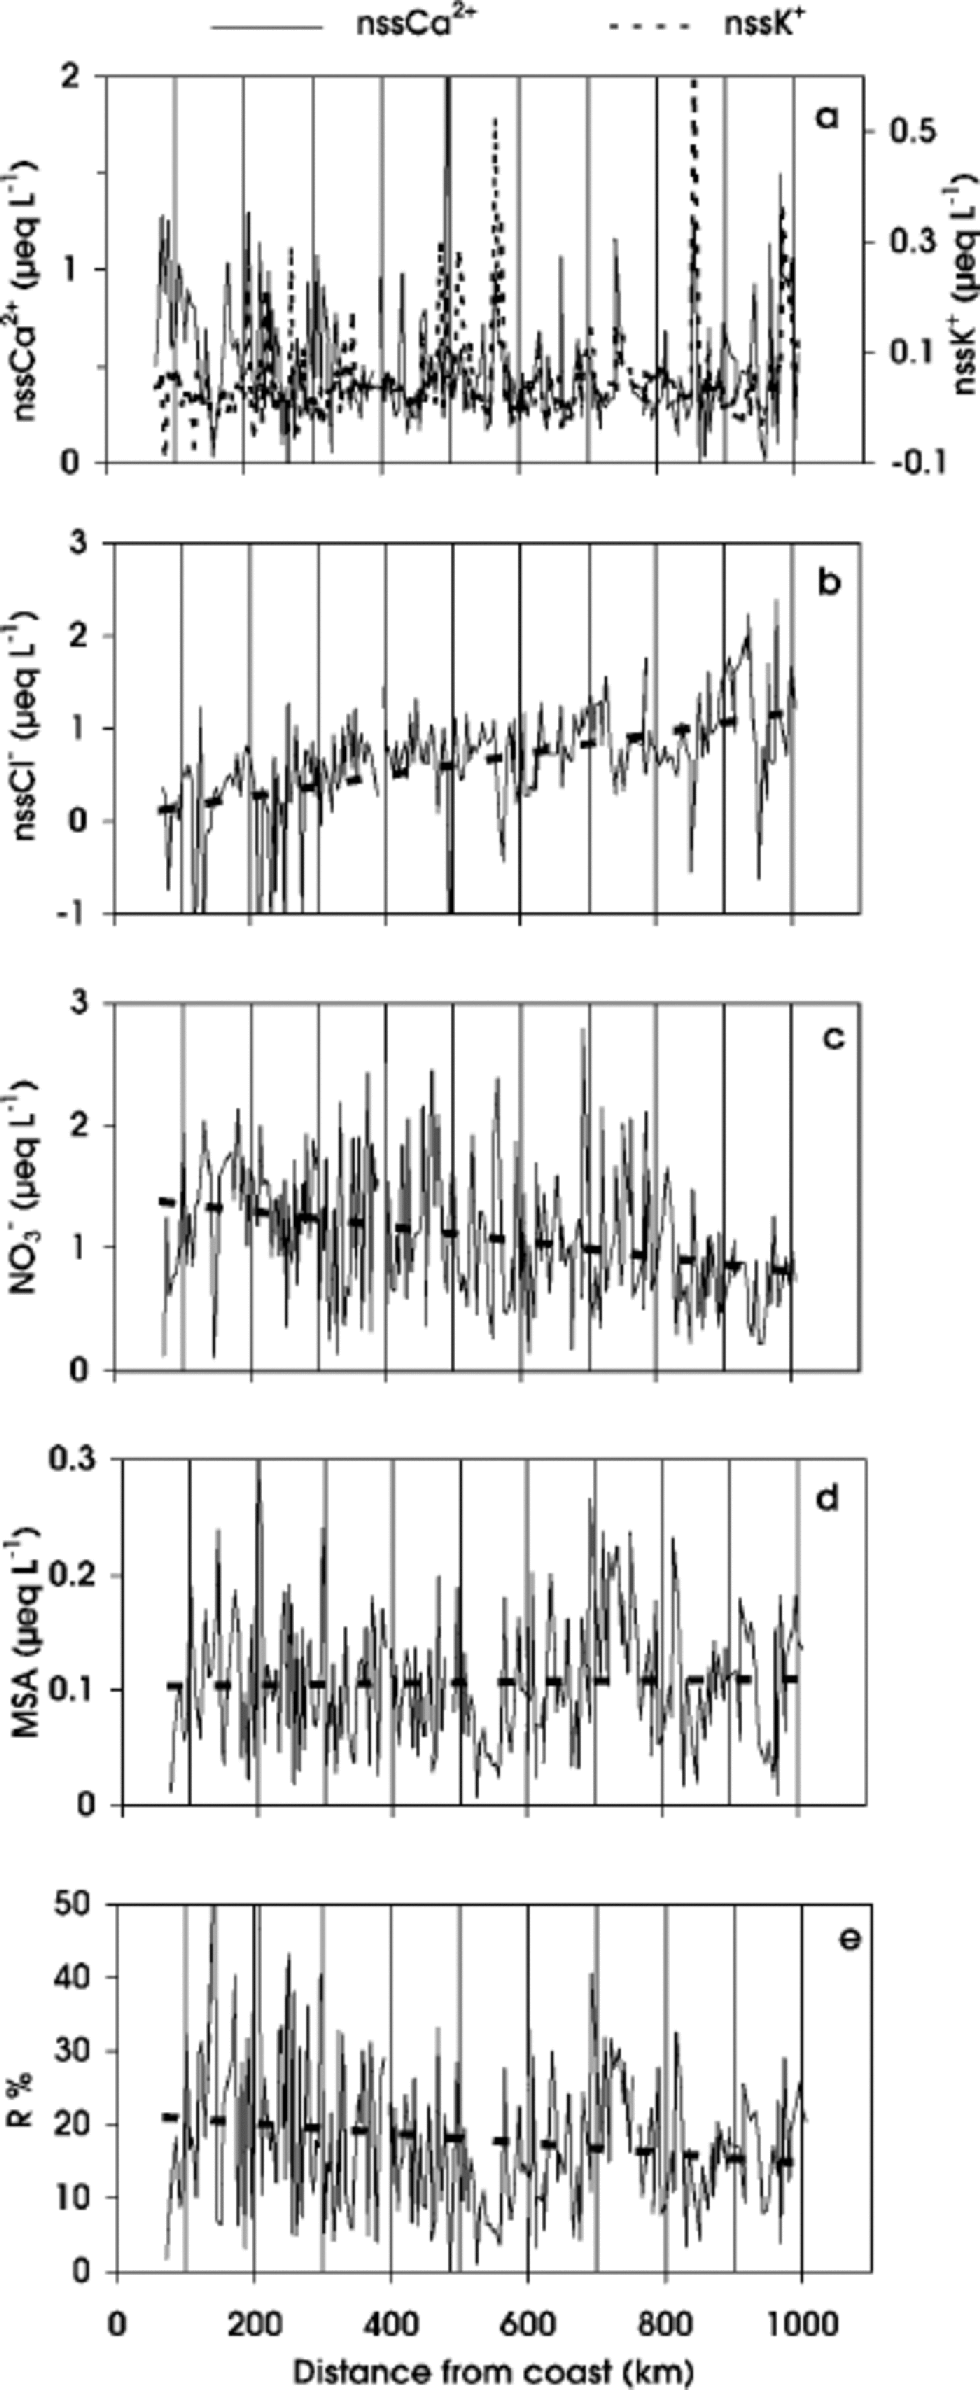
To evaluate crustal contributions, we calculate the non-sea-salt concentrations for Ca2+ and K+. the nssCa2+ profile shows a decreasing trend, less evident than that of total Ca2+, between 70 and 330 km. Beyond 330 km, the background values are highly modulated by several spikes along the whole profile. This pattern suggests a crustal contribution from the coastal area which decreases inland, with sporadic dust deposition on the plateau area. In contrast, nssK+ concentration does not show a decrease in the first distance range (Fig. 5a), so the crustal source appears to be less important for this component. Also, the nssK+ profile is modulated by some peaks. As such spikes are generally in phase with nssCa2+ peaks, similar transport mechanisms may be proposed.
4.2.4. Secondary aerosol
The nssCl– concentration along the traverse shows a progressive increase as distance increases (Fig. 5b).This pattern is due to the progressively higher relevance of secondary contributions to the Cl– budget. A similar trend is shown in the International Trans-Antarctic Expedition (ITAE) profile (Qin, 1995). A nssCl– concentration increase is observed in the traverse route from Mirny to Vostok, where the accumulation rate is particularly low. Beyond Vostok, nssCl– concentration progressively decreases as accumulation rate increases.
The NO3 – concentration shows a very irregular profile, with a decreasing trend as altitude increases (Fig. 5c). This distribution could be related to natural variability with different contributions of the various NO3 – sources (Reference Zeller and Parker.Zeller and Parker, 1981; Reference Parker and GowParker and others, 1982; Reference Legrand and KirchnerLegrand andKirchner, 1990; Qin and others, 1992). Although in Antarctica the main sources of NO x are downward transport from stratosphere/troposphere and long-range transport of NO x - enriched air masses by tropical lightning (Reference Legrand and KirchnerLegrand and Kirchner, 1990), other sources can increase the variability of the NO3 – content, by dry and snow deposition, such as biogenic activity and nitrate–organic compounds, further complicating the interpretation of the global balance of the atmospheric NO3 – budget (Reference Dibb, Talbot, Munger, Jacoband and FanDibb and others, 1998; Reference JonesJones and others, 1999). In addition, post-depositional modifications, mainly related to re-emission of HNO3 into the atmosphere, occur at sites characterized by wind scouring and low accumulation rate. NO3 – loss has been found at stations M2,MP, D2 and D4 (Fig. 2a, d, e and f).
As shown by the linear regression in Figure 5c, the NO3 – traverse profile shows a decreasing trend as distance from the coast increases. This pattern is opposite to that expected for components related to secondary aerosol, as shown by the nssCl– profile (Fig. 5b). the lower NO3 – concentrations observed in inland stations are in agreement with NO3 – post-depositional re-emission occurring at low-accumulation sites (Reference Traversi, Becagli, Castellano, Largiuni, Udisti, Colacino and GiovannelliTraversi and others, 2000). In fact, NO3 – dips are observed at sites characterized by low accumulation rates caused by low snow precipitation or by wind ablation (e.g. at 151, 327, 612 and 672 km from the coast). the relationship between altitude, or distance from the sea, and NO3 – concentration is not clear: some authors refer to a positive altitude/ concentration correlation (Reference MulvaneyMulvaney and Wolff,1994), while others report no relationship with elevation (Reference KreutzKreutz and Mayewski, 1999), highlighting a still limited understanding regarding NO3 – deposition and post-depositional effects.
Along the traverse, nssSO4 2– concentration shows a slight decrease up to about 250 km from the coast, but this decrease is much lower than that observed for the total SO4 2– profile (Fig. 4d). from 270 to 600 km inland, the concentration increases with a progressive trend, modulated by many spikes. In the distance range 600–900 km, steadily higher values are observed. Finally, around 940 km, an abrupt and deep decrease is shown, like those of Cl–, Ca2+, NO3 – and MSA (Fig. 4b and e and 5c and d). the slight nssSO4 2– decreasing trend in the first 250 km step suggests a fast deposition of primary aerosol. Because the sea-salt contribution was already subtracted, we suppose a progressive scavenging of crustal contributions. the lower rate of decrease, with respect to the sea-salt markers, could be explained by the lower contribution of dust to the primary atmospheric aerosol budget. nssSO4 2– that originated from secondary sources and is related to the finest size fraction of the aerosol particles penetrates to the plateau areas reaching the Antarctic central ice sheet. the progressive increase of this fraction of sulphuric aerosol could be explained as a direct effect of the decreasing accumulation rate. This hypothesis is not supported by previous studies (Reference MulvaneyMulvaney and Wolff, 1994; Reference KreutzKreutz and Mayewski, 1999). These authors showed the nssSO4 2– concentration is not positively correlated to accumulation rate, and supposed that nssSO4 2– and distance inland are independent of each other or negatively correlated. Nevertheless, along the ITAE traverse (Qin,1995) between Mirny andVostok, the variation of the nssSO4 2– concentrations vs inland distance shows a trend similar to that found in the present study.
The MSA traverse profile (Fig.5d) shows a high variability, with a large peak at 730 km and two deep troughs at 550 and 965 km. the last feature is present in all analytical profiles, and this pattern could be related to local conditions. the trough at 550 km and the peak at 730 km are out of phase with respect to troughs and peaks found in the profiles of the other compounds. the mean MSA value along the whole traverse is 0.11 μeq L–1, with a standard deviation of 0.06 μeq L–1. These values are similar to those found in surface snow of the Antarctic ice sheet by Qin (1995), along the route of the 1990 ITAE, and to the data reported by Reference KreutzKreutz andMayewski (1999) for surface snow measured in different Antarctic stations. Due to its biogenic marine origin, MSA concentration is expected to decrease with distance inland and increasing altitude (Reference Legrand, Feniet-Saigne, Saltzman and GermainLegrand and others, 1992; Reference Udisti, Traversi, Becagli and PiccardiUdisti and others, 1998; Reference KreutzKreutz and Mayewski, 1999). on the other hand, MSA is acting as cloud condensation nuclei and is distributed in the finest size fraction of the aerosol particles (Reference Saltzman, Savoie and ProsperoSaltzman and others, 1983,Reference Saltzman, Savoie, Prospero and Zika.1986; Reference Pszenny, Castelle, Galloway and DucePszenny and others, 1989); in such a way MSA, like the finest fraction of nssSO4 2–, is carried out more efficiently over the Antarctic plateau. the large contribution to the MSA budget coming from long-range transport of air masses originating at low latitudes (Reference Saigne and LegrandSaigne and Legrand, 1987) supports this hypothesis.
The patterns observed in the MSA profile could be caused by two opposing effects: as distance from the sea increases, the oceanic source contribution becomes progressively lower, causing lower concentration in snow; in contrast, the decrease in mean accumulation rate leads to higher concentrations in snowfall.
The MSA fraction (R =MSA/MSA+nssSO4 2–) plotted vs distance shows a high variability. the highest values are observed in the first 300 km inland (Fig. 5e). In the Southern Ocean atmosphere, R values are negatively correlated with air temperature (Reference BerresheimBerresheim,1987; Reference Bates, Calhoun and Quinn.Bates and others, 1992) because the distribution between MSA and nssSO4 2– during the DMS oxidation yields a greater SO2 percentage at relatively higher temperatures. If R is representative of the air-mass origin, it could be used as a marker to distinguish between high- and low-latitude sources. In this way, R values observed in the first part of the ITASE traverse and in the coastal Antarctic snow are in agreement with higher R values found at high southern latitudes (Reference Saigne and LegrandSaigne and Legrand, 1987; Reference Legrand, Feniet-Saigne, Saltzman and GermainLegrand and others, 1992; Reference Udisti, Traversi, Becagli and PiccardiUdisti and others, 1998). the lower R values observed in snow at higher plateau stations are mainly related to long-range transport from temperate latitudes. Nevertheless, due to the different size distribution of MSA and nssSO4 2– (Reference PszennyPszenny, 1992; Reference Kerminen, Hillamo and WexlerKerminen andothers, 1998), fractionation phenomena can complicate the interpretation of R values.
5. Conclusions
In this work we have presented the results of chemical and isotopic analysis of samples collected along a traverse, performed in 1998/99, from Terra Nova Bay to Dome C, in the framework of the ITASE project. Surface snow chemistry showed a high spatial variability due to changes in aerosol composition, wind scouring effects and firnification processes on both regional and local scales. In spite of this variability, the chemical analyses showed some remarkable features.
Sea-salt components (Na+, Cl– and Mg2+) show a very similar trend in the traverse profile from the coastal to inland areas. In particular, their concentration decreases up to 10 times in the first 250 km inland, corresponding to the highest surface gradient. This confirms the importance of the surface altitude and distance from the coast in affecting the aerosol penetration inland on the Antarctic ice sheet. With regard to nssCa2+, both coastal and long-range dust inputs were found.
Post-depositional losses of NO3 –, by re-emission of HNO3 into the atmosphere, were indicated in areas characterized by wind ablation or low snow-accumulation rate. With regard to nssCl–, a dramatic decrease with depth was observed at station M2 and pit D4; this pattern could also be explained by a post-depositional HCl re-emission into the atmosphere.
The SO4 2– profile is driven by sea-salt contribution in the first part (70–270km) of the traverse. for greater distances, most of the SO4 2– budget is represented by nssSO4 2–.
MSA concentration shows high variability along the traverse, due to two effects: the biogenic marine origin and accumulation-rate dilution effect. A possible MSA re-emission was observed at station M2, where strong wind scouring is present.
The calculated δ18O–temperature gradient for the traverse is 0.99‰˚C–1. the difference with the value obtained forTerre Adélie (Reference Lorius and MerlivatLorius and Merlivat,1977) suggests different oceanic source regions for the moisture delivering the precipitation to these two areas.
To improve our knowledge of components distribution over the Antarctic ice sheet, further studies are required. Data from traverse expeditions represent the most useful tools to investigate several complex and still unexplained processes acting during and after snow deposition.
Acknowledgements
This research was carried out within the framework of a project on glaciology and palaeoclimatology of the PNRA and was financially supported by Ente per le Nuove Tecnologie, l’Energia e l’Ambiente (ENEA) through a cooperation agreement with the Università degli Studi di Milano Bicocca. This work is a contribution of the Italian branch of the ITASE project. It is an associate programme of the ``European Project for Ice Coring in Antarctica’’ (EPICA), a joint European Science Foundation/European Commission scientific programme. the authors wish to thank all members of the traverse team, the participants in PNRA 1998/99 who assisted at the Terra Nova and Concordia stations and all persons in Italy who were involved in the preparation of the traverse. We are very grateful for the anonymous reviewer’s comments on an earlier version of the manuscript.



