


I. Introduction
I.I. Background
Pronounced surface undulations on ice caps and ice sheets especially in the sleeper regions have been reported by many authors includingReference Robin de.Robin (1958, 1967), Reference MälzerMälzer (1964), Reference BuddBudd (1966), Reference RobinsonRobinson (1966). Because of the inability of seismic and gravity ice thickness measurement to detect small wavelength variations, Robinson was unable to find any cleat-relation between the surface variations and those of the bedrock. Larger-scale features however have been analysed by Reference BourgoinBourgoin (1956) and Reference HochsteinHochstem (1967) to show that the surface variations are related to the bedrock, and in particular that the steepest surface slopes tend to occur over the highest points of the bedrock.
With the advent of the radar ice-thickness sounder it has been possible to detect bedrock variations in detail down to a wavelength λe such that (cf. Reference BuddBudd, 1969)

where Z is the ice thickness and b is the bedrock amplitude.
Reference Robin de.Robin (1967) using radar sounding results, showed that the pattern of measured surface slope variations agreed with those calculated from longitudinal stress variations due to steady-state flow over the bedrock variations.
A further treatment of the theoretical relation between the surface and bedrock profiles of a moving ice mass has been given byReference BuddBudd (1969, 1970); the major results of this work are summarized in the following section.
1.2. Theory
Considering a Newtonian viscous model with a non-Newtonian basal boundary layer flowing over a sinusoidal bed of slope ß with amplitude ß1 and wavelength λ = 2·π-/ω, viz.

Reference BuddBudd (1969) obtained the following result for the steady-state surface slope profile

where


and p is the ice density, g is the gravitational acceleration, B is the power flow-law parameter (B = 2n where η is the viscosity when n = 1), Z is the ice thickness, and V is the mean forward velocity of the ice column.
This result indicates that the surface waves lag the bedrock in the direction of motion by approximately Π/2. The wavelength of minimum damping (the ratio of bedrock to surface amplitude) is approximately 3.6 times the ice thickness. For much longer and shorter wavelengths the surface amplitudes decrease approximately as ωZ.
Using the same model with a more exact theory involving harmonic solutions of the stress functionReference BuddBudd (1970) derived the following equivalent result:

where

and η is the mean viscosity of the column, dependent on the stress and temperature.
The frequency dependent parts of Equations (5) and (7) ψ 1 (wZ)and ψ2(ωZ) are shown in Figure (1).
The previous result, Equation (4), may be regarded as a first approximation to Equation (6). The differences are a factor of two in magnitude, which is explained in detail inReference BuddBudd (1971), the position of the peak in the damping factor, which now occurs for

or
and that the short wavelengths are damped out more rapidly, i.e. with ewZ instead of ωZ.
Given the ice thickness  and the velocity V, the damping factor ψ
2, may be used with Equation (7) to estimate the mean How parameter η through the thickness. Hence for a uniform distribution of bedrock amplitudes the surface amplitudes may be expected to have a maximum about three to four times the ice thickness.
and the velocity V, the damping factor ψ
2, may be used with Equation (7) to estimate the mean How parameter η through the thickness. Hence for a uniform distribution of bedrock amplitudes the surface amplitudes may be expected to have a maximum about three to four times the ice thickness.
These results can be readily tested by spectral analyses of measured bedrock and surface profiles.
Theoretical curves fur damping factor (Ψ1 and Ψ2 and power spectrum Ψ2 2 = (Ψ1 [ωZ)2/2 [wz+ ⅓ (wZ)3]; Ψ2 = (wZ)2/2 sinh wZ

1.3. Previous results
Reference BeitzelBeitzel (1970) carried out spectral analyses of the surface and bedrock profiles of a 400 km down-slope line he measured on the U.S. “Queen Maud Land Traverse II" in Antarctica. The ice thickness was measured by radio echo sounding and wavelengths were studied from about 3 km to 100 km. His results confirm the theory of section I.I in that the surface slopes were in phase with the bedrock elevations and that in spite of an irregular bedrock spectrum the surface slopes spectrum showed a well marked maximum for wavelengths about 3 to 4 times the ice thickness.
The calculated damping factors agreed reasonably with Equation (5) over the range of wavelengths considered by Beitzel but this did not extend to the very short wavelengths.
Finally from his results we find that the magnitude of the minimum damping agrees with the calculation of Equation (7) from estimates of the ice thickness Z, velocity V, mean viscosity n, and minimum damping Ψm.
Taking Z = 2.7 km, V = 5 m/year = 5/3.16 X 107 m/s, Ψm ≈ 7, and the maximum value of (wZ)-2(ewZ—e.-wZ), ψm≈ 0.552

This gives η ≈ 2.6 X 10¹⁷ P for a mean surface temperature of about — 50 ° C. This is in reasonable agreement with the value found by Beitzel from the analysis of the longitudinal stress and strain-rates associated with the undulations, viz. η ≈ 3 x 10¹⁷ P (corresponding to ß ≈ 104 bar year).
Fig. 2.Wilkes ice-cap elevation and bedrock profiles from, optical leveling and radio-echo sounding, (Note vertical scales displaced 200 m.)

2. Wilkes Ice-cap Surface And Bedrock
2. 1. Bedrock and elevation profile D-J line
In 1967 the second author (Reference CarterCarter, unpublished) used a Scott Polar Research Institute model 35 MHz radio echo sounder to determine continuous ice thickness profiles around the northern survey triangle of the Wilkes local ice cap (cf.Reference McLarenMcLaren, 1968). These profiles have been examined and tabulated for ice thickness at 0.2 km intervals. During the same year detailed optical spirit levelling was carried out from Wilkes to the summit of the ice cap and on to Cape Poinsett. These values have similarly been tabulated at the same 0.2 km intervals. From these two profiles the bedrock elevation has been calculated and tabulated. A plot of the surface and bedrock profiles is shown in Figure 2. The surface on the large scale is strikingly smooth, compared with the bed, and forms a close fit to a parabola. On the small scale, surface undulations are apparent, especially near the coast, and over the rough section of bed 30 km from the centre. On the very small scale (less than 1 km) the surface profile is also noticeably smooth. The bedrock on the other hand is notable for its irregularity over all measurable scales, and especially at the higher frequencies.
2.2. Spectral analyses of surf ace and bed
On the large scale the shape of an ice cap on a plane base may be expected to be curved from summit to edge resembling a parabola or similar class of higher-order curves depending on the accumulation rate, the temperature and flow parameters of ice, and the base slope, etc.
Fig. 3. Power spectra for Wilkes ice-cap surface and bedrock deviation profiles from summit to coast.
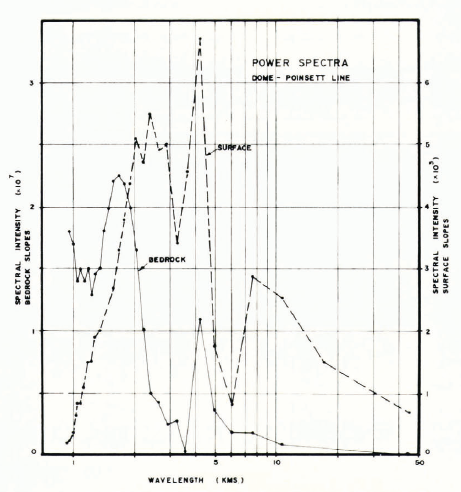
Such shapes have been discussed byReference NyeNye (1959), Reference HaefeliHaefeli (1961), and Reference BuddBudd (1969), and will not be treated here. Deviations from a plane bed cause deviations in this smooth curve of the surface. It is these deviations which we wish to examine. Hence a least-squares parabolic approximation to the surface was calculated which gave a close fit to the smooth large-scale trend. Deviations from the trends were then computed for surface and bedrock elevations. Standard power spectra, co-spectra, and quadrature-spectra calculations were carried out for the surface and bed over the whole line and also for four sub-intervals from the edge to the centre. Plots of the power spectra over the whole line are shown in Figure 3.
Although the bedrock slopes have large amplitudes in the short wavelengths with a peak about 1.7 km, the surface shows strong peaks between about 2 and 5 km. The mean ice thickness over the line is about goo m. The damping factor has a minimum at about 3 km. This supports the predicted relation for λe. ≈ 3.3Z and forms a valuable supplement to Beitzel’s value of λe ≈ 8 km for Z ≈ 2.7 km.
The co-spectra and quadrature-spectra results support the prediction that the surface slopes and bedrock elevations are in phase. However the line of the profile deviates somewhat from the line of flow near the centre of the profile and since bedrock and surface variations are in phase across the line of flow (cf. Reference McLarenMcLaren, 1968, fig. 21) the phase shift varies between o and Π/2 in this region. The results for the five overlapping sub-intervals show a general increase of minimum damping wavelength with ice thickness but since the intervals were small c. 25 km these results are not as clear as the corresponding values for Greenland (discussed below), where the sub-intervals are longer.
2.3. Damping factor
The magnitudes of the minimum damping factor Ψm, the ratio of the bedrock to surface amplitudes, are given in Table I together with the distances from the summit, the ice thickness. velocity and surface temperatures. The mean temperatures for the columns have been derived from temperature distributions calculated in the way described byReference Radok, Radok, Jenssen and BuddRadok and others (1970).
Wilkes Ice-Cap Viscosity Parameters From Damping Factor

The values of the damping factors Ψm show a strong increase from the edge 10 the centre, Using the relation

where Ψm is the maximum value of  (viz.Ψm ≈ 0.552), the measured values of
Ψm, the ice thickness Z, and velocity V, have been used to calculate values of η, the mean flow parameter through the column, for the five sections. These calculated values of η are also given inTable I, and show an increase going inland as the temperature and stress decrease. This is in agreement with the present analysis of the Wilkes ice-cap temperature regime (Reference BuddBudd, 1969) and a more extensive treatment is in progress (Reference CarterCarter, unpublished).
The viscosity values also compare favourably with the results obtained from the measured surface strain-rates byReference McLarenMcLaren (1968) and Reference PfitznerPfitzner (unpublished), cf. also Reference BuddBudd (1968. 1969). McLaren’s value of 1.3 x 10⁹ dyn cm-2 s⅓ (3-4XioI5P) corresponds to an average value over the region from about 25 to 90 km from the summit, in intervals of about 5 km.
The damping factor evaluation is much more sensitive and gives the variation in η along the line. To obtain comparable results from strain-rates much closer spacing of measuring points would be required.
The plot of damping factor against wavelength in Figure 4 shows that the short bedrock waves are very rapidly damped out whereas the long waves are damped more gradually. Extension of these results to the very long waves is prevented here because of the shortness of the line. However combined with Reference BeitzelBeitzel’s (1970) results the form of the curve so far covers wavelengths from 0.5Z to 20Z and 400 m to 100 km. The very high damping for short waves of Figure 4 supports the exponential relation of Equation (7} rather than the earlier approximate value of Equation (5)
Fig.4. Variation of damping factor with wavelength for Wilkes and Dronning Maud Land, showing agreement with theoretical curie φ2 = (ωZ)22/2 sinh wZ.

3. Greenland E.G.LG. Profile
3.1. Surface and bedrock profiles
The large-scale surface and bedrock profiles from the coast to the centre of the Greenland ice sheet along the E.G.I.G. traverse line are reproduced in Figure 5. from Reference MälzerMälzer 1964), and Reference BrockampBrockamp (1957). Although the surface is available in high detail (points every 0.2 km have been used here) the bedrock data has been obtained from seismic and gravity measurements and so is necessarily coarse.
Fig 5. Greenland ice sheet detailed surface and coarse bedrock profiles for E.G.I.G. line, from Reference MälzerMälzer (1964) optical levelling, andReference BrockampBrockamp (1967), seismic and gravity measurements.

On the large scale the surface is smooth and close to “generalized parabolic’’, cf. Haefeli i960). Superimposed on this large scale curve are very pronounced undulations with amplitudes increasing greatly towards the coast. These undulations are remarkably regular in the region 100 km to 150 km from the coast and it is apparent that the predominant wavelength is about 8 km. The amplitudes c. 20 m are about an order of magnitude larger than on the Wilkes ice cap. It is also apparent that the predominant wavelength decreases towards the coast. Inland the wavelengths are longer and the amplitudes become very small. Spectral analyses of the surface allow these features of the ice sheet to be described more precisely.
Fig. 6. Greenland surface-slope demotions power spectra from coast to 400 km inland, for 50 km internals 1 to 8, showing decrease of magnitude and shift of peaks going inland.

3.2. Spectral analyses of the surface
As in the case of the Wilkes ice cap we consider deviations from a smooth parabolic trend curve to the ice-sheet surface. Also, since the features we wish to examine vary, from the coast to the centre, with ice thickness, velocity, and the flow parameter, the whole line was divided into 50 km sections. Standard spectral analyses of the ice surface slope deviations for each of these sections were carried out and the results have been plotted on log-log coordinates in Figure 6, for the first 8 sections (400 km) from the coast. Further inland the surface amplitudes were mostly too small to be significantly above error noise.
The somewhat irregular sections of individual spectra no doubt reflect the irregularity of their bedrock distributions. In spite of this there is a well pronounced peak in every case and the overall shape on the average is not unlike that for the squares of the amplitudes as shown in Figure 1 which would be expected for a uniform bedrock distribution of slopes.
A strong decrease occurs in the spectra maxima going inland (several orders of magnitude) and there is a clear trend of increase of the wavelength of the maximum from about 2.4 km near the coast to 12 km inland.
3.3. Variation in wavelength of minimum damping
By matching the theoretical spectrum for uniform bedrock with the measured surface spectra, the best-fit wavelengths for minimum damping have been read off and plotted against ice thickness in Figure 7. Also shown is the expected trend Equation (8), viz. λm ≈ 3-3Z, and in addition the actual points x corresponding to the maximum peaks. The agreement is quite good and we note that the actual value of 3.3 for the slope is dependent on the precise nature of the model used. This agreement then suggests that the model, of the Newtonian medium with a non-Newtonian basal boundary layer, is a reasonable approximation for this analysis.
3.4. Use of damping-factor magnitudes for estimating flow parameters
Although we do not have absolute values of the damping factors for Greenland as we do for Wilkes we can still gauge the variations in their magnitudes from the coast to the inland by the decrease in the magnitudes of the power spectra of the surface waves, on the assumption that the bedrock spectra remain constant.
The power spectra are proportional to the squares of the amplitudes so by taking the square roots of the maxima of the spectra of Figure 6 matched with the theoretical curve of Figure 1, the variation in the relative magnitude of the minimum damping going inland can be estimated.
In order to calculate the flow parameters however we need absolute values of the damping factors. In the absence of a detailed bedrock profile this is difficult, but even with the coarse bedrock spacing of the Brockamp data (c. 5 km) an attempt can be made to examine the relation between large-scale surface and bedrock features. To do this Fourier components for 100 km segments from the coast to the centre were determined for the bed over wavelengths 100 to 10 km and for the surface from 100 to 0.4 km. For the surface, the plot of the amplitudes of the Fourier components resulted in similar magnitude and form to the square root of the spectra of Figure 6 as would be expected. For the bed, the plots showed an increase in higher-frequency amplitudes approaching coast as apparent from Figure 5.
To compare the surface and bed, the mean of the wavelength amplitudes about 25 km were chosen and their ratios calculated to estimate the damping factor as shown inTable II.
For the longer waves the surface amplitudes become reduced to noise level whereas for the shorter waves the coarse bed spacing smoothed out the high-frequency bed variations.
Hence, although preliminary and subject to error, this method gives the best estimate of damping factors along the profile until a more detailed bedrock profile becomes available.
From the damping factors for 25 km and the ice thickness the minimum damping factors were obtained from Figure 1. These can then be used in Equation (7) to estimate the flow parameters provided the mean forward velocity of the ice is known. As a first approximation for the velocity, we may take the steady-state balance values, e.g.Reference HaefeliHaefeli (1961). It is interesting to note that the values determined by Reference Brockamp and ThyssenBrockamp and Thyssen (1968) from the movement of the E.G.I.G-. stakes relative to the undulations agree fairly well with these in the region just inland of Camp VI
Fig. 7. Variation of wavelength of minimum damping λwith ice thickness. Z. The dashed line represents the expected trend from the solution of ωZ = 2 tanh wZ, i.e· λ = 2πZ/1.92.

Table II lists the values of Ψm, Z, V, the calculated flow parameter η, and also the surface temperature θs and basal stress Tb. The magnitudes of these η values are comparable with the Antarctic values given in sections 1.3 and 3,3. They show the expected decrease with increasing temperature and stress as the coast is approached, and as a whole lie between the values for Wilkes where the surface temperatures range from —20 to — I4°C and the value of Dronning Maud Land at — 50°C
We note the values of 1Ψm are considerably less than α the mean surface slope, which would be expected for a uniform Newtonian viscous model with no sliding (cf. Reference BuddBudd, 1970). The magnitudes of ψ obtained here are also comparable with the magnitudes observed in the data of the detailed profiles ofReference Robin de.Robin (1967), Reference Rinker and MockRinker and Mock (1967) and Reference MockMock(1968).
However to test the theory more thoroughly it is necessary to have detailed surface and bedrock profiles in regions where the velocities are also known, as in the case of the Wilkes ice cap.
Greenland E.G.I.G. Line Flow Parameters From Damping Factors

Conclusions
Although only strictly applying for two-dimensional flow, the theory of ice flow over bedrock perturbations ofReference BuddBudd (1970) explains the relation between the measured bedrock and surface profiles in the regions of Wilkes and Dronning Maud Land in Antarctica and the surface waves in Greenland. A certain amount of scatter may be due to the three-dimensional character of the bedrock and the flow. The technique of determining the flow parameters for longitudinal strain-rate from spectral analyses of bedrock and surface profiles along a flow line, where the flow is sufficiently two-dimensional and the velocity is known, appears to be quite accurate and sensitive. With such knowledge gained of the flow parameters it will become possible to use the same technique to calculate unknown velocities in other areas. On the other hand, given the velocity and flow parameters, it becomes possible to calculate the details of the bedrock profile from the surface profile if the broad-scale bed is known. Such a calculation for the Greenland E.G.I.G. profile is in progress.
Acknowledgements
The authors are grateful to Mr J. E. Bcitzel, of the University of Wisconsin, for providing the results of his analyses prior to publication. We are also grateful to Dr U. Radok of the University of Melbourne for his valuable consultation on the project and for critically reviewing this manuscript.



