


Symbols

The setting
Investigations at the margin of the Greenland ice sheet have been made at Isua (Fig. 1) in conjunction with a study of the feasibility of developing an open-pit mine. Reference ColbeckColbeck (1974) computed the increased ice flow into the proposed mine and subsequent investigations of the temperature field, subglacial water, and ice fabrics are given here. An unusual bedrock configuration exists because of the rock peninsula which diverts the flow of the ice (Fig. 2) forcing some of the ice to flow up-hill over the southern flank of the taconite ore body. Another unusual feature of this area is the subglacial melt water which exists in a narrow band around the margin of the ice sheet in south-western Greenland. Where the ice is thin, close to the margin, the glacial base is frozen by heat conduction through the ice and, at great depths far from the margin, the basal layer is frozen by the movement of colder ice from the interior of Greenland. The transition between a melting base and a frozen base adjacent to the margin occurs in our area of investigation.
Map of Greenland showing location of Isua.

Location of the study area overlying the ore body at the edge of the ice sheet. Regional flow trends are indicated.

Ice Temperatures
Five holes (see Fig. 3) were drilled in 1972 and 1973 for the purpose of making temperature measurements and taking ice cores. These holes were drilled by a contractor using a conventional rotary-drilling rig which circulated salt water to remove the cuttings. Although the salt water introduced many problems (as shown later), it did provide a means for tracing the flow of surface melt water down the bore holes.
Surface contours, bedrock contours, drill holes, surface velocities, and the ice margin are shown.

At bore hole 10, the ablation surface is essentially flat but the ice flows up a 44% grade at a measured rate of 2.85x10⁻⁸ m s−1 (0.9 m a−1; data given in Table 1) in a direction almost perpendicular to the ice margin. In this case, which is represented in Figure 4, the temperature of the ice is affected by the upward movement to the ablating surface of warmer ice from greater depths. This mode of flow contrasts sharply with conventional ice-sheet flow where colder ice moving down-slope decreases the temperature at depth (Reference BuddBudd, 1969). The quasi-steady heat balance is approximately described by

where the relatively-small horizontal gradient has been neglected. Assuming no variation in velocity with depth as the ice is pushed up the slope,

(this plug-like motion is suggested by observed bore-hole movements during drilling into the underlying iron ore), and the temperature is described by

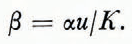
where γb is the temperature gradient at the base of the moving ice, and

The coordinate system adopted in the present study. The (x, y) coordinates are defined such that x is parallel to the ice surface.

The measured and computed ice temperatures are shown in Figure 5 for bore hole 10. The measured surface temperature is about 1 deg warmer here than for the other holes possibly because of the large snow accumulation due to wind drifting against the 1200 m rock peak. The basal temperature is below freezing at —2.3°C and the computed basal temperature gradient is —0.98x10⁻² deg m–l, or about 52% of the normal geothermal heat flux. Since the geothermal heat flux measured in southern Greenland (Reference Sass, Sass, Nielson, Wollenberg and MunroeSass and others, 1972) is about normal for Precambrian shields, we conclude that the heat flow in this area is reduced by the presence of the steeply-inclined, highly-exposed rock peak which consists of iron ore. In fact, the basal temperature gradient is greater in bore holes 11 and 12 which are further from the rock outcrop (see Table 1).
The measured points and calculated temperature profile in bore hole 10.

The temperature profile at bore hole 10 is almost linear because of the low rate of movement but, as shown in Figure 6, bore hole 11 has a more pronounced curvature due to the lower surface temperature, higher basal temperature, and greater upward movement of warmer ice from the unfrozen base of the ice sheet up-stream. At this depth the upward heat flux is sufficient to keep the basal ice frozen but at a much higher temperature than the shallower bore hole 10. Bore hole 12 is similar to 11 with a slightly colder base because it is less deep (see Fig. 7).
The measured points and calculated temperature profile in bare hole 11.

The measured points and calculated temperature profile in bore hole 12.

Bore hole 13 was drilled into the unfrozen basal layer which runs north-south along the western margin of the Greenland ice sheet. The temperature reaches the pressure-melting temperature at the ice-rock interface as shown in Figure 8. The calculated temperature profile is highly accurate and the calculated basal temperature gradient γb is much less than calculated for holes 10, 11, and 12 where the basal ice is frozen. Reference RobinRobin (1955) suggested that this reduced heat flow is due to basal melting at the ice-rock interface.
The measured points and calculated temperature profile in bore hole 13.

All holes were drilled with circulating salt water to remove cuttings, but the temperatures were measured over a sufficiently long period of time to ensure thermal equilibrium at each depth. In bore holes 13 and 14, which were drilled into the unfrozen basal layer, melt water from the surface drained into the hole, thus flushing out the salt water after the completion of drilling. Figure 9 shows how the interface between the fresh and salty water moves into the till underneath the ice (2 to 5 m of glacial deposits were found in other bore holes drilled earlier at this site). A water flow-rate of 1.4 x 10⁻⁴ m3 s–1 was measured directly and from Figure 9 we calculate flow-rates as large as 2.5 x 10⁻⁴ m3 s–1 as the liquid level in the hole varied between the surface and 8 m below the surface. Assuming a layer of moraines under the ice of 3 m thickness, we calculate an intrinsic permeability of 10–11 m2, that is, the permeability of a fine sandy layer. Since the drill reports indicated the presence of boulder-size particles with interstitial ice, we conclude that the subglacial tills are ice-rich even in areas where the base is unfrozen.
Bore-hole temperature profiles are shown for five times following the completion of drilling of bore hole 13. The fresh-salty-water interface moves down the hole.

Bore hole 14 was drilled to a depth of 250 m when, with the circulation stopped, surface water was observed to enter the liquid-filled hole. Subsequently, the hole was completed to bedrock at a depth of 299 m and the time-dependent temperature profiles shown in Figure 10 were measured. Above a depth of 240 m the salt water was flushed from the hole by the surface water and, as in bore hole 13, the hole then froze and the ice temperatures quickly approached their ambient values. However, below 240 m a very different behavior occurred as shown in Figure 10. As in hole 12, where the salt water was trapped in the hole, the lower 59 m of 14 retained the salt water and the temperature slowly increased as the salt water was diluted by water produced from the melting of the surrounding ice. Eventually the steady profile shown in Figure 11 was attained. The loss of drilling fluid before completion of the hole and the subsequent inverse behavior of the temperature profiles above and below 240 m can only be explained by the presence of an open conduit at that depth. The possibility of a large fracture suggests an area of dead ice in the lower 59 m overridden by the active part of the ice sheet, as shown in Figure 12. A calculation of the temperature profile assuming an area of dead ice below 240 m gives excellent correlation between theory and measurement, whereas making the assumption that the entire glacier is moving gives a very poor correlation (see Fig. 11).
Bore hole temperature profiles are shown for four times after the completion of bore hole 14. Note the different behavior above and below 240 m depth.

The measured points and two calculated temperature profiles for bore hole 14.

A cross-sectional profile along a flow line which passes through bore holes 12 and 14. The bedrock profile determined by a seismic survey shows 10% greater ice depths than bore holes 13 and 14. (Reproduced by permission of the Editors of Nature.)

Ice Fabrics
Petrographic and structural studies of ice were limited to cores from one hole, bore hole 14. Useful cores were obtained at depths of 15–16 m, 50–51 m, 100–101 m, 150–151 m, and 200–201 m, but attempts to obtain cores at 250 m and below were not successful because of problems with freezing of the drill string and loss of circulating fluid. Drilling at hole 14 was terminated when bedrock was penetrated at a depth of 299 m.
Ice from 15–16 m depth was very bubbly and contained both rounded and tubular inclusions of air averaging about 0.1 cm in diameter. Crystals as large as 6 cm in cross-sectional diameters were observed in this section. Core from 50–51 m was also composed of bubbly, coarse-grained ice-melt crystals measuring 1 to 6 cm in diameter. Bubble diameters varied from 0.1 to 0.2 cm. Oriented, plate-like bubbles, clustered into bands inclined at about 75° to the vertical, were observed in both the top and bottom cores from this depth. Ice from 100–101 m contained fewer entrapped air bubbles than ice from 50–51 m, and so few bubbles were present in cores from 150–151 m that the ice was substantially transparent in character. This particular core featured a steeply dipping band of fine-grained ice inclined at about 67° to the vertical. The mean size of crystals in the band was 0.2 to 0.3 cm compared with crystals measuring 1 to 6 cm in diameter in the enclosing ice. Core from 200–201 m was very similar in general appearance to ice from 150–151 m. The middle section of core contained numerous grey particles up to 0.3 cm in diameter which were subsequently identified as being composed largely of clay.
In summary, the ice at bore hole 14 can be considered generally coarse-grained throughout with crystal cross-sections usually exceeding 1 cm in diameter. Ice is generally quite bubbly above 100 m, but bubbles may be absent altogether in deeper ice. Some evidence for a foliated structure exists in ice cores between 50 and 150 m depth.
Data on structure and fabrics are given in Figure 13. The existence of only limited amounts of oriented core prevented a detailed statistical analysis of the ice fabrics, but enough data were obtained to show that the c-axis fabrics either had a broad single maximum or were of the multiple-maximum type. The tendency for c-axes to cluster near the edge of the stereographic projection (see Fig. 13) simply implies that the glide planes of the crystals are very steeply inclined in the ice at Isua. Reference RigsbyRigsby (1955) has reported a similar disposition of c-axes in ice from the edge of the Greenland ice sheet near Thule. Rigsby also noted that the axes were invariably clustered about the pole to the foliation (or plane of implied shear). A similar situation may apply at 150 m depth at Isua where the crystallographic c-axes are all located close to the pole of the band of fine-grained ice. All factors considered, the fabrics at Isua seem reasonably compatible with a process of recrystallization of ice under low deviatoric stress at temperatures close to the melting point. However, the existence of oriented textures in the ice at Isua suggests that the original calculations of flow, based on the assumption of an isotropic ice mass, may need modification.
Crystal structure and c-axis fabrics at five depths in hole 14. The diameter of the structural sections is 50 mm. All sections horizontal; orientations of c-axes plotted on equal-areas net, lower hemisphere. Pole to trace of fine-ice banding at 150 m indicated by a cross.

In view of the possible discontinuity at about 240 m depth at the site of bore hole 14, it is unfortunate that attempts to obtain ice cores below that depth were unsuccessful. Significant differences in texture and fabric below this level would have provided valuable evidence for the interpretation of this phenomenon.
Flow Over Dead Ice
Given the loss of fluid during drilling, behavior of the transient temperature profile immediately after drilling, and the excellent correlation between measurement and theory if we assume an effective depth of movement of 240 m, we suggest that an area of motionless or “dead” ice exists as shown in Figure 12. This possibility is not too surprising in view of the direct observation of an area of relatively stagnant ice near the base of a small valley glacier. The unique observation made here is the loss of drill fluid and subsequent loss of melt water running down and out of the bore hole at a depth of 240 m in cold ice. Clearly, a major fracture exists on the surface separating the active ice from the dead ice. This may be the type of fracture suggested by Reference OrowanOrowan (1960) and searched for on a small valley glacier by Reference Neave and SavageNeave and Savage (1970). Although Neave and Savage failed to find any evidence of fracturing at depth on the valley glacier, the situation at Isua is ideal for such a phenomenon to occur at a depth where the hydrostatic pressure would normally preclude fracturing. The up-hill mode of flow with a grade of about 10% (30% if we assume the complete depth of the ice is in motion) concentrated the strain at the base of the moving ice to a much larger extent than is found in the normal, down-hill mode of flow. Therefore, strain concentration in a narrow band, as described by Reference OrowanOrowan (1960), would be more likely to occur and a zone of weakness which included many smaller fractures could exist along the boundary separating the active and stationary ice. These fractures probably did not separate significantly prior to the drilling because of the large overburden pressure and the subfreezing temperature (—0.45°C). However, the introduction of a liquid-filled hole with a pressure exceeding the overburden pressure in the ice by about 2.4 x 10⁵ N m–2, would make possible the opening and propagation of a major fracture along the bottom of the moving ice. As in an oil-well hydrofracture, the crack would propagate as the drilling fluid entered the fracture. After the drilling was completed, the surface melt water would displace the drill fluid, the water-filled hole would freeze above 240 m, and the ice would return to its ambient temperature. However, before this freezing was completed, water could escape from the hole at 240 m depth in sufficient quantity to suggest that a major fracture may have propagated most of the way to bedrock all around the area of dead ice.
Acknowledgements
This work was supported by the Marcona Corporation. Discussions with Dr W. F. St Lawrence about creep rupture at depth were very helpful. Subsequent to our own field work, field data was generously supplied to us by Mr I. P. Dano of Greennines A/S in Copenhagen.
Discussion
H. RÖthlisberger: Do you think that bottom crevasses could develop in your case? It does not seem very likely judging from the profile you showed.
S. C. Colbeck: I seriously considered bottom crevasses at first, but rejected the idea because of the low deviatoric stresses, low temperatures, and depth (240 m) at which we lost circulation.
S. F. Ackley: Did the radio echo-sounding show a horizon at the 240 m depth?
Colbeck: The radio echo-sounding gave no useful information this close to the margin because of the wet ice at the base together with surface melting.
H. Kohnen: Would it be possible to record the fracture movement by permanent seismic recording, i.e. having a seismic station on the ice?
Colbeck: We were not looking for creep rupture at the time so we had no seismic equipment. However, people are searching seismological records and using seismographs on glaciers in search of such signals.



