


1. Introduction
The COVID-19 pandemic has caused more than a billion confirmed cases and more than 4 million deaths worldwide since first reported in Wuhan (World Health Organization, Reference Organization2021). As a global crisis, the pandemic also disrupted daily life in terms of mental health, education, and social relationships (Usher et al., Reference Usher, Bhullar and Jackson2020). Indeed, personal networks are changed in part due to the restrictions imposed by social distancing policies (Weeden et al., Reference Weeden, Cornwell and Park2021) and in part because of network adaptations to the pandemic-induced challenges, including those imposed by lockdowns and social distancing policies. Regarded as the intermediate-level social determinant of health (Lahelma, Reference Lahelma2007), personal networks are also found to have strong associations with a wide range of health indicators, including morbidity, depressive symptoms, and physical health (Fiori et al., Reference Fiori, Smith and Antonucci2007; Li and Zhang, Reference Li and Zhang2015). Although sociologists have long speculated about the impact of personal networks on social inequality (Granovetter, Reference Granovetter1983), this has seldom been empirically examined (Shepherd and Garip, Reference Shepherd, Garip, Pescosolido, Perry, Smith and Small2021). Given the complexity and multidimensional nature of personal social networks, it is also difficult for studies analyzing only a handful of network features to provide a sufficiently rich picture of the social network, and their results may be obscured by potential confounders (Shiovitz-Ezra and Litwin, Reference Shiovitz-Ezra and Litwin2012). Therefore, scholars have resorted to clustering techniques to construct a parsimonious measure of social network typology that could effectively capture network characteristics and their association with health. For example, network typology is commonly applied in gerontology research as a predictor for health among older adults (Maya-Jariego, Reference Maya-Jariego2021).
Despite growing interest in networks and health, few studies focus on young adults, who experienced the worst mental health declines among all age groups during the pandemic (Nwachukwu et al., Reference Nwachukwu, Nkire, Shalaby, Hrabok, Vuong, Gusnowski and Agyapong2020). More importantly, extant research on network typology and its health implications faces several challenges both methodologically and theoretically. First, social networks are documented to vary systematically across individuals with different personal characteristics and from different cultural backgrounds. These factors may serve as confounders between network type and health (Cornwell, Reference Cornwell2015; Li et al., Reference Li, Yang and Zhang2018). Second, due to the constraints of commonly used clustering algorithms (Kouiroukidis and Evangelidis, Reference Kouiroukidis and Evangelidis2011), existing studies usually input no more than 10 original variables to generate network typologies, which could leave room for omitted variable bias (Antonucci et al., Reference Antonucci, Fiori, Birditt, Jackey, Lerner, Overton, Lamb and Freund2010). Further, two lines of research on network dynamics and the network’s effect on health inequality have yet to be combined, especially in the context of the COVID-19 pandemic, which lay bare the fault line of society (Perry et al., Reference Perry, Aronson and Pescosolido2021).
To fill in this gap, we use both waves of data from CovNetps-Wuhan to examine how network dynamics shape mental health outcomes during the pandemic. The CovNetps-Wuhan survey samples the total college population in Wuhan, the first pandemic epicenter, who faced campus closure and strict social distancing policies during the first wave outbreak in the Wave 1 survey, but have largely resumed normal life and returned to the campus in Wave 2. The goal of our study is threefold: (1) to develop a comprehensive network typology describing these students’ core networks; (2) to investigate how network types change as the social distancing policy becomes stricter; (3) to estimate the heterogeneous effect of network types on mental health across different SES groups and highlight the moderating role of SES. We build on the clustering method developed by Giannella and Fischer (Reference Giannella and Fischer2016) (henceforward, G&F) that includes 43 network features to identify network types. Combining data from the Oxford Covid-19 Government Response Tracker, we employ a multinomial logistic model to find out how the pandemic changes network types and use fixed-effect models to reveal the moderating effect of SES on the relationship between network type and depressive symptoms.
2. Theoretical backgrounds
2.1 Developing a social network typology
A personal network is a set of individuals who are linked to each other in ways specified by social roles (Hall and Wellman, Reference Hall, Wellman, Cohen and Syme1985). Traditional studies focusing on a single network aspect, nevertheless, ignore the multidimensional nature of social networks, and their findings would be confounded by the remaining aspects due to mutual interdependence (Li and Zhang, Reference Li and Zhang2015). To address these methodological caveats, inductive network typology turns out to be an economic, comprehensive, and useful way to encapsulate the main characteristics of networks. Previous network-health studies consistently report four common networks that have cross-cultural validity, namely Restricted, Friend, Family, and Diverse (Li and Zhang, Reference Li and Zhang2015). Besides, other distinct types have been identified among non-Western populations. For instance, the Congregant network, deeply involved in religious activities, has been reported in Korea and Israel (Litwin and Shiovitz-Ezra, Reference Litwin and Shiovitz-Ezra2011; Sohn et al., Reference Sohn, Joo, Kim, Kim, Youm, Kim and Lee2017), and a Distant Family network focusing on extended kin has been found in a sample of older Chinese adults (Cheng et al., Reference Cheng, Lee, Chan, Leung and Lee2009).
These inconsistencies may, on one hand, stem from cultural heterogeneity across countries, and on the other hand, from different sets of network variables selected to train the clustering algorithm and different algorithms employed. In terms of criterion variable selections, two lines of research exist that differ in variable choice and the resulting typology, namely support classification and structural classification (Maya-Jariego, Reference Maya-Jariego2021). The former emphasizes support-related information, such as the number of supportive network members and composition of help providers, while the latter further includes structural indicators such as network size, homogeneity, and density. Most network typology-health research to date follows the support classification tradition that considers the location and resource feature yet ignores structural elements. Consequently, the typology obtained fails to comprehensively represent social networks, and subsequent analysis may suffer from omitted variable bias. To overcome these potential drawbacks, the current study selects criterion variables that cover both support and structural dimensions so that the typology “captures the holistic nature of networks” (Perry et al., Reference Perry, Pescosolido and Borgatti2018).
In terms of the algorithm, K-means clustering and the more recently developed latent variable modeling techniques are commonly employed to detect network typology (Park et al., Reference Park, Jang, Lee, Chiriboga, Chang and Kim2018). Nevertheless, K-means clustering hinders researchers from including more criterion variables due to “the curse of high dimensionality” (Kouiroukidis and Evangelidis, Reference Kouiroukidis and Evangelidis2011). Further, K-means and latent analysis are also sensitive to noise, outliers, and variable scales, which may obscure the discovery of robust network types (Giannella and Fischer, Reference Giannella and Fischer2016). To overcome these obstacles, G&F use the random forest to construct network types because it can capture the most useful variables in characterizing distinctive network types. Also, it outperforms traditional clustering methods because of its compatibility with both continuous and categorical variables with different scales, robustness to outliers, incorporation of extraneous features, and adaptation to multicollinearity (Cutler et al., Reference Cutler, Cutler and Stevens2012). Hence, we build on G&F’s method to identify network typology in this sample.
2.2 Pandemic and social network dynamics
The vast literature on network dynamics suggests personal networks are likely to change as pandemic-induced social distancing policies, such as public space closures, become more stringent. First, social networks are shaped by structural contexts. According to Feld (Reference Feld1981), personal networks evolve around foci, namely social entities, contexts, or organizations, such as the workplace, school, home, or voluntary clubs. They are also referred to as context or spatial composition, without which social interactions and joint activities are unlikely to take place, and social ties cannot be formed or sustained (Blau, Reference Blau1977; Small and Adler, Reference Small and Adler2019). Social distancing policies change the accessibility of these foci by closing schools, restaurants, and other public spaces, but at the same time encourage staying-at-home behaviors, which make individuals switch network types. For instance, networks between Cornell University students became less dense, less connected, and more fragmented during the pandemic when on-campus teaching was replaced by a hybrid instruction mode (Weeden et al., Reference Weeden, Cornwell and Park2021).
Second, personal networks change because they “adapt to the dynamic and uncertain environment” (Perry, Reference Perry, Pescosolido, Perry, Smith and Small2021), which is exactly the case of the pandemic, and especially during lockdowns. Previous research found that individuals endeavor to activate their network ties for help in times of crises, and rely heavily on kinship ties for resources in contexts such as Hurricane Katrina (Hurlbert et al., Reference Hurlbert, Haines and Beggs2000) or the Gulf War (Shavit et al., Reference Shavit, Fischer and Koresh1994). Friendship networks among students have also proved to be robust in the context of COVID-19, as nominations for informational and emotional assistance increased modestly (Elmer et al., Reference Elmer, Mepham and Stadtfeld2020). Changes in network types also occur as the ego’s needs evolve or when alters self-activate to offer help upon perceiving the ego’s difficulties (Perry and Pescosolido, Reference Perry and Pescosolido2012; Small, Reference Small, Pescosolido, Perry, Smith and Small2021). In the case of Wuhan, a large number of volunteers from local neighborhoods formed non-kin networks during the lockdown to meet local residents’ needs of grocery deliveries, medicine purchases, basic health services, and so on (Miao et al., Reference Miao, Zeng and Shi2021). Therefore, we have the following hypotheses about network turnover that contextualize social inequality in mental health during the pandemic.
H1: Individuals tend to withdraw from network types centered at school, work, and other public spaces as the pandemic-induced policies become more stringent.
H2: Individuals are more likely to have network types related to a high level of support, particularly networks with a focus on families, friends, or both, as the pandemic-induced policies become more stringent.
2.3 Network types, health, and SES
Among commonly reported network types, Restricted networks are characterized as being limited in every supportive aspect of networks and thus associated with the worst mental health profile (Cheng et al., Reference Cheng, Lee, Chan, Leung and Lee2009; Litwin, Reference Litwin2001; Litwin and Shiovitz-Ezra, Reference Litwin and Shiovitz-Ezra2011). On the contrary, Diverse networks are considered a more beneficial type for health (Moore et al., Reference Moore, Daniel, Paquet, Dubé and Gauvin2009). The superiority of Friend vis-à-vis Family networks remains debated. Some studies suggest that Friend networks yield better mental health (see, Antonucci et al., Reference Antonucci, Fiori, Birditt, Jackey, Lerner, Overton, Lamb and Freund2010), whereas other research, especially those conducted in East Asian contexts, finds that Family networks are either among the healthiest types or similar to friend-focused types (Cheng et al., Reference Cheng, Lee, Chan, Leung and Lee2009; Fiori et al., Reference Fiori, Antonucci and Akiyama2008, Reference Fiori, Smith and Antonucci2007).
Although individuals’ network types are strong predictors of health outcomes (Litwin, Reference Litwin2001), estimated effects in previous research may be confounded by personal- and macro-level background factors. First, according to the social convoy theory, personal background factors including age, personality, life and family history (e.g., divorce, unemployment, imprisonment), all affect individuals’ network types (see, Antonucci et al., Reference Antonucci, Fiori, Birditt, Jackey, Lerner, Overton, Lamb and Freund2010; Kahn and Antonucci, Reference Kahn, Antonucci, Baltes and Brim1980), and yet they are also important social determinants of health (Phelan et al., Reference Phelan, Link and Tehranifar2010). Second, the macro-level context that individuals are embedded in, such as cultural background and level of regional economic development, shapes both their social network types and mental health simultaneously (Li et al., Reference Li, Yang and Zhang2018). Therefore, the current study uses fixed-effect models to rule out these observed and unobserved confounders and examines the health effect of network types.
More importantly, the impact of network type on life outcomes may not be universal or constant. Instead, it tends to be contingent on the SES of the ego according to the strand of study on social capital and network inequality (Shepherd and Garip, Reference Shepherd, Garip, Pescosolido, Perry, Smith and Small2021). On the one hand, high-SES individuals have more resource-enriching personal networks. For instance, Campbell et al. (Reference Campbell, Marsden and Hurlbert1986) demonstrated that network members’ educational level, job prestige, and family income are positively related to the SES of the ego. These network deficits make low SES groups less likely to have the resources they need in their networks (Lai et al., Reference Lai, Lin and Leung1998), which has been used to explain why poverty is self-perpetuating (Granovetter, Reference Granovetter1983). On the other hand, higher-SES individuals are more capable of accessing the resources in personal networks than their low-SES counterparts, even if the resources embedded in their networks are similar. For example, research in social capital activation has found that weak ties are beneficial for job status only for high SES individuals (Lin et al., Reference Lin, Ensel and Vaughn1981). By contrast, low-status individuals are often denied assistance even though they already have alters in their networks who wield the resources needed. They also have difficulties mobilizing social ties for resources due to the “functional deficit” of personal networks, especially in low SES neighborhoods and among low-wage occupations (Smith, Reference Smith2005). This leads to our central hypothesis on the heterogeneous protective effect of networks across SES groups.
H3: The effect of network type on mental health is conditioned on SES.
In terms of why personal networks impact health, previous literature proposed three mechanisms, namely, social support, social capital, and behavioral diffusion (McCarty et al., Reference McCarty, Lubbers, Vacca and Molina2019). Most network typology-health studies rely on the first framework that highlights the benefit of embedded social support on buffering life stressors and facilitating resilient coping strategies (Cohen et al., Reference Cohen, Underwood and Gottlieb2000; Song et al., Reference Song, Son, Lin, Scott and Carrington2011), which the present study follows to explain the network health disparities. Though scholars have long articulated the multidimensional nature of social support, which consists of actual support and perceived support according to the degree of subjectivity, only a few empirical studies take both aspects into consideration (Lin and Peek, Reference Lin, Peek, Horwitz and Scheid1999; Song et al., Reference Song, Son, Lin, Scott and Carrington2011). Even if individuals are embedded in networks with abundant resources, they could still feel lonely, disconnected, and unsatisfied with the current network conditions (de Jong Gierveld et al., Reference de Jong Gierveld, Van Groenou, Hoogendoorn and Smit2009). Hence, the paper also examines different levels of social support embedded in each network type to help make sense of our central hypothesis on the network effect heterogeneity across SES groups.
H4: Mental health disparities associated with different network types can be explained by different degrees of social support embedded in the networks.
3. Data and methods
3.1 Data
The data for this study are the Wuhan subsample of COVID-19 and the Social Network Panel Study (CovNetps-Wuhan), a web-based survey with a representative sample of the college population in Wuhan city. Respondents are drawn proportionately according to the five-tier system developed by the Ministry of Education (MOE), a classification system that ranks the higher educational institutions (HEI) from the most selective national universities to local vocational colleges (see Section A1, Supplementary Material). The first wave of CovNetps-Wuhan was collected between March and May 2020, at the end of the first wave outbreak in China, to fully capture the network consequences of pandemic exposure. A total of 2,047 respondents participated in the study, who were then residing in all provincial-level administrative regions of China during the pandemic. The second wave was conducted from January to February 2021, three months after the reopening of the campus following MOE’s administrative order. In total, 524 respondents participated in the follow-up survey. All qualified participants in Cov-Netps study meet the following screening criteria: (1) currently being enrolled in one of Wuhan’s HEI; (2) aged 17 or above; (3) choose the “I agree to participate in this study” option; (4) manage to pass two filtering questions; and (5) spend an average of at least 3 s on each item. In this research, we further employ list-wise deletion on less than 5% of the respondents who reported missing or unmatched information. CovNetps-Wuhan applies egocentric network study methods to capture an individual’s core networks through a two-step process similar to Fischer (Reference Fischer1982). First, a name generator asked respondents to recall “people you typically do these sorts of things with, or other social things as well, such as going shopping, out for sports, studying together, chatting, or people who are important to you (both online and offline)”, and then the survey recorded up to six names reported. Next, in the following name-interpreting stage, respondents were requested to describe their relationship with alters, the characteristics of each alter, and the connections among alters. These items offer detailed knowledge on personal networks, paving the way for our network typology development.
3.2 Measures
Social network types. Social network typology is derived from the 43 network indicators listed in Table S1, Supplementary Material. These variables are selected or constructed to cover different network aspects to obtain a comprehensive typology (Moren-Cross and Lin, Reference Moren-Cross, Lin, Binstock and George2006).
Depressive symptoms. As a dependent variable, we use the nine-item version of the Center for Epidemiologic Studies-Depression Scale (CES-D) to measure depressive symptoms and represent respondents’ mental health status (Santor and Coyne, Reference Santor and Coyne1997). The depression scale asks respondents the number of days in the past week that they experience certain emotions (e.g., sad, depressed, happy), and we recoded the scale so that a higher score indicates a higher level of depressive symptoms.
The pandemic and social distancing. We use the data from the Oxford Covid-19 Government Response Tracker that captures government policies related to space closure and social distancing (Hale et al., Reference Hale, Angrist, Goldszmidt, Kira, Petherick, Phillips, Webster, Cameron-Blake, Hallas and Majumdar2021). The database includes seven indicators of social distancing policies, which can be used as proxies to capture the disruptions caused by the pandemic. These include the closure of schools, closure of workplaces, cancellation of public events, limits on gatherings, closure of public transport, stay-at-home requirements, and restrictions on travels between cities/regions (0 = no measures, 1 = recommend closing, 2 = require closing only some levels, 3 = require closing all levels), and we use the factor score of these items to measure the strength of local social distancing policies.
Actual and perceived support. Social support is considered in both actual support and perceived support dimensions, which are considered equally important (Moren-Cross and Lin, Reference Moren-Cross, Lin, Binstock and George2006; Wethington and Kessler, Reference Wethington and Kessler1986). Actual support is measured by the number of alters with whom respondents confide personal matters, exchange pandemic-related information, discuss entertainment topics, and from whom they receive substantial help. The second dimension, perceived support, reflects the self-rated quality of social support or how satisfied respondents are with their current networks. It is measured by three dichotomous questions asking whether they hope to meet more friends to confide, hang out, and provide practical help (0 = Hope to know more, 1 = Enough for now). A higher score indicates the respondent is more satisfied and has a higher level of perceived social support. In alignment with the literature, Confirmatory Factor Analysis demonstrates that our two-factor model of social support fits the data well ( $\chi ^{2}$
= 59.196, df = 13, RMSEA = 0.037, CFI = 0.990, TLI = 0.983), which is superior to a traditional single-dimension construct (
$\chi ^{2}$
= 59.196, df = 13, RMSEA = 0.037, CFI = 0.990, TLI = 0.983), which is superior to a traditional single-dimension construct ( $\Delta \chi ^{2}$
= 2312.827,
$\Delta \chi ^{2}$
= 2312.827, $p \lt 0.001$
).
$p \lt 0.001$
).
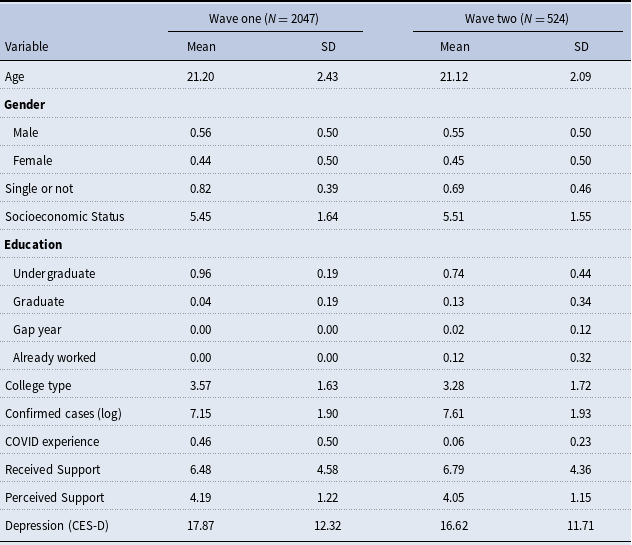
SES and other control variables. The MacArthur scale of subjective socioeconomic status (SES) is used to measure SES. Sociodemographic covariates are age, gender, single or not, educational status, and college type in the five-tier system. In terms of the pandemic’s impact, we also control the cumulative confirmed cases (log-transformed) and respondents’ COVID experience. For subsequent analysis, the fixed-effect model has already held all time-invariant confounders constant. The descriptive statistics of all variables are presented in Table 1, and the sociodemographic profile of different network types is reported in Table 2.
Descriptive statistics of wave one and wave two data

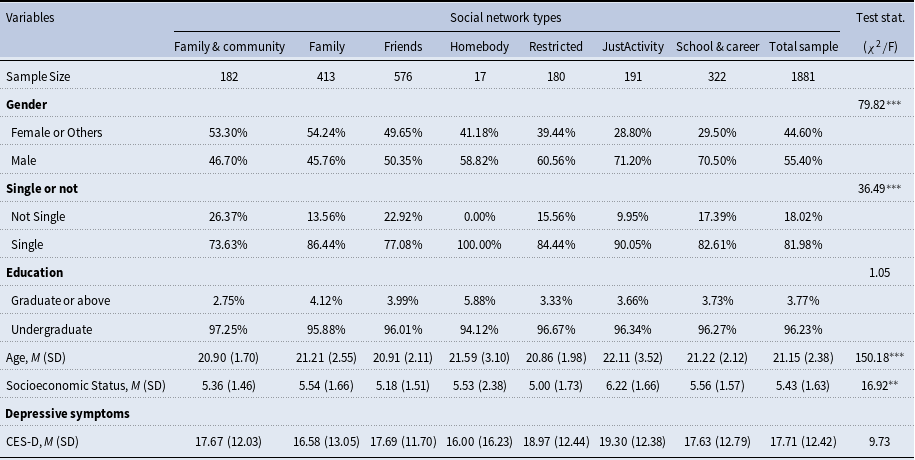
Background characteristics, socioeconomic status, and depressive symptoms by seven network types
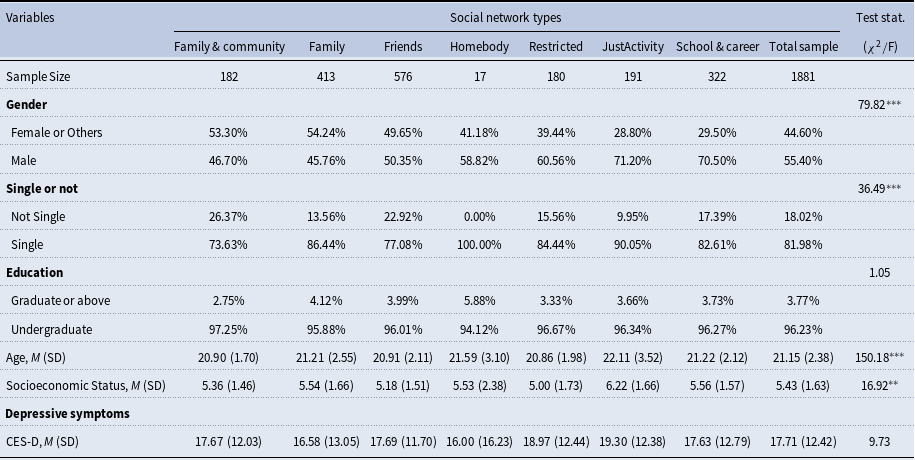
Notes: Only 1,881 of 2,047 Wave One respondents embedded in coherent network types (prediction accuracy $\gt$
80%) are included.
$\gt$
80%) are included. $M$
= mean; SD = standard deviation. ***
$M$
= mean; SD = standard deviation. *** $p \lt 0.001$
, **
$p \lt 0.001$
, ** $p \lt 0.01$
.
$p \lt 0.01$
.
3.3 Analytical strategy
Developing a network typology. We build on the network typology methodology developed by G&F and further adopt the streamlined version as demonstrated by Laier et al. (Reference Laier, Hennig and Hundsdorfer2022). The original G&F methodology is a multi-stage iterative process: it begins with an unsupervised random forest model on 43 raw network indicators to create a similarity matrix, then uses agglomerative clustering to partition observations into groups, followed by a supervised random forest model to assess prediction accuracy and filter out clusters with high prediction errors ( $\gt 20$
–
$\gt 20$
– $25\%$
). Next, it creates composite variables through principal component analysis using only observations from these “coherent” clusters, reducing the 43 indicators to approximately 10 composite dimensions. Finally, the entire process—unsupervised random forest, clustering, and validation—is repeated using these composite variables to arrive at the final network types. This approach involves two complete clustering cycles with an intermediate filtering and dimensionality reduction step.
$25\%$
). Next, it creates composite variables through principal component analysis using only observations from these “coherent” clusters, reducing the 43 indicators to approximately 10 composite dimensions. Finally, the entire process—unsupervised random forest, clustering, and validation—is repeated using these composite variables to arrive at the final network types. This approach involves two complete clustering cycles with an intermediate filtering and dimensionality reduction step.
Following Laier et al. (Reference Laier, Hennig and Hundsdorfer2022), we tested whether skipping the intermediate steps (initial clustering, filtering, and PCA on filtered data) would affect results. Our analysis reveals that directly creating composite variables from all observations and clustering once on these composites yielded very similar cluster assignments. Therefore, we adopt this streamlined methodology: (1) reduce 43 network indicators to 10 composite variables using principal component analysis on all Wave 1 observations, (2) apply unsupervised random forest on these composite variables to generate a similarity matrix, (3) perform spectral clustering to partition observations into groups, and (4) use supervised random forest to validate prediction accuracy, retaining only clusters with prediction errors below 20%. This simplified approach produces seven network types substantively identical to those from the original method while significantly improving computational efficiency, reducing processing time to one-sixth of that of the original approach. For Wave 2 observations, we use the algorithm trained on Wave 1 data to perform out-of-sample prediction (for methodology details, see Section A2, Supplementary Material).
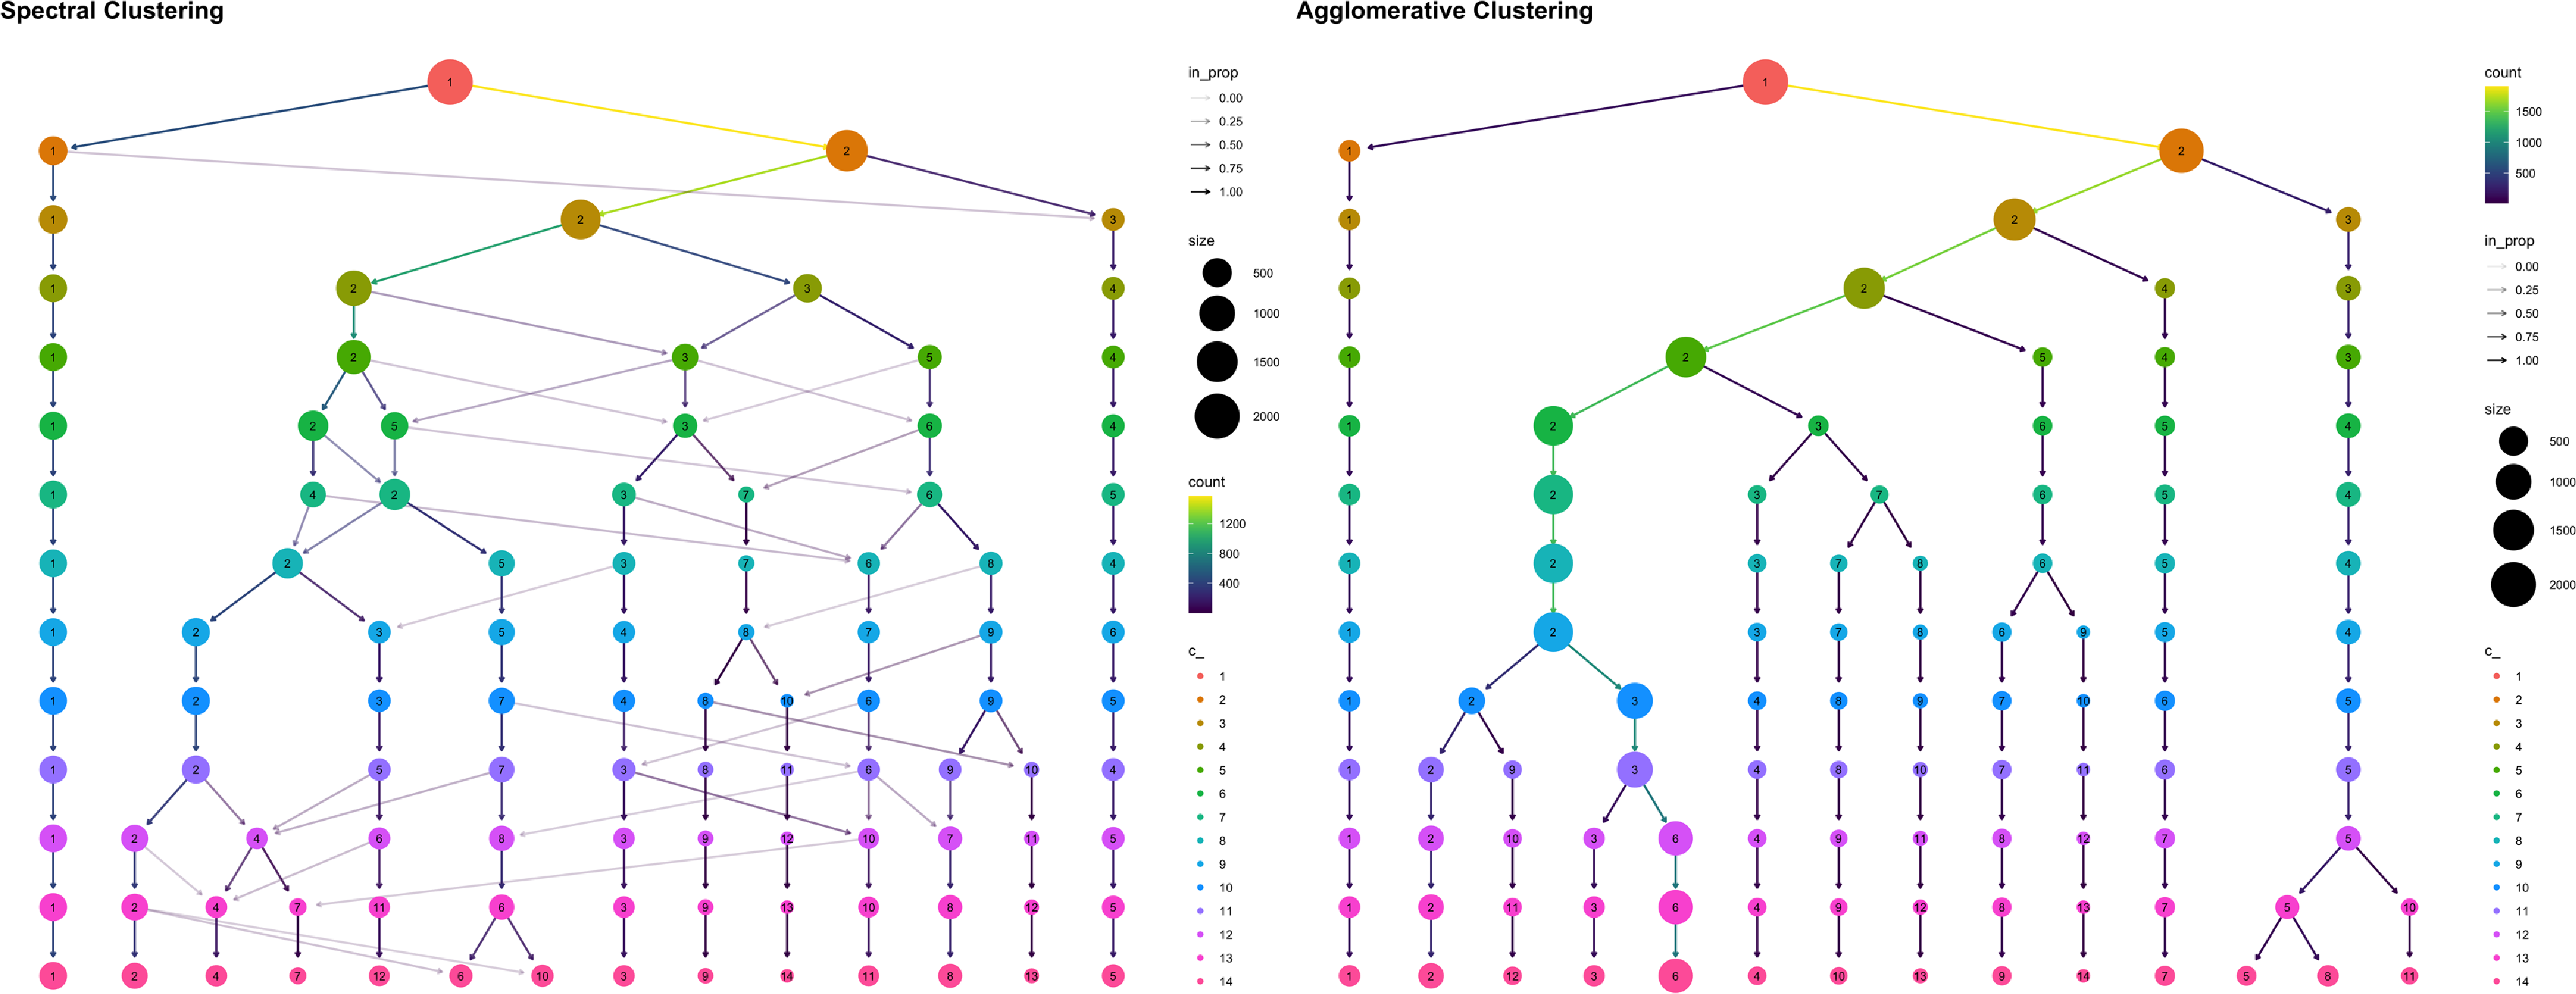
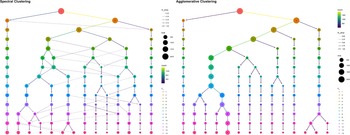
Moreover, we improve G&F’s method by applying the spectral clustering method in step two instead of hierarchical agglomerative clustering (HAC), which is used by previous research. Spectral clustering does not make a priori assumptions about the shape of the clusters (Von Luxburg, Reference Von Luxburg2007). It also performs better in this case and meets our research goal to obtain several distinctive, small, intuitive, and robust clusters. By contrast, HAC fails to fulfill our goal because the size of the resulting clusters tends to vary greatly in size (i.e., a few extremely large clusters and many small clusters), and this algorithm cannot revoke previously made decisions (Cheng et al., Reference Cheng, Qiao, Bian and Tao2011; Maimon and Rokach, Reference Maimon and Rokach2010; Smoliński et al., Reference Smoliński, Walczak and Einax2002). Figure 2 highlights how these two methods differ and how spectral clustering’s flexibility enables it to learn the data’s internal patterns more effectively. While HAC tends to maintain fixed clustering membership before the next split, the spectral clustering method allows making a “regret decision” that could change the individual’s cluster membership in the future split. Therefore, spectral clustering has the advantage of balancing the size of different clusters and thus generates a more desirable result for the task of clustering.
Fixed effect models. The fixed effect model takes all time-invariant variables into account (e.g., personality, family history, regional development), which are likely to correlate with both social network type and depressive symptoms. Since every respondent was treated as his/her own control in this model, fixed effect regression makes use of within-person variation observed in repeated measures, and the estimated effect reports the depressive symptoms outcome that would ensue should an “average” individual’s network type change (Boone-Heinonen et al., Reference Boone-Heinonen, Roux, Kiefe, Lewis, Guilkey and Gordon-Larsen2011; Rabe-Hesketh and Skrondal, Reference Rabe-Hesketh and Skrondal2008). To confirm our model selection, the Breusch–Pagan Lagrange multiplier test indicates pooled regression is biased for panel data analysis ( $\chi ^{2}$
= 76.41, df = 1,
$\chi ^{2}$
= 76.41, df = 1, $p \lt 0.001$
), and the Hausman test result (
$p \lt 0.001$
), and the Hausman test result ( $\chi ^{2}$
= 30.89, df = 14,
$\chi ^{2}$
= 30.89, df = 14, $p \lt 0.001$
) suggests that fixed effect model is more favorable over random effect model in the current study (Greene, Reference Greene2008). Last but not least, we implement inverse probability weighting (IPW) in all panel fixed-effects analyses to address potential bias arising from selective attrition between the two survey waves. Specifically, we first estimate each respondent’s probability of being observed in Wave 2 as a function of Wave-1 characteristics. We then weight the fixed-effects models by the inverse of this predicted retention probability, so that individuals who were under-represented among Wave-2 respondents receive greater weight in the estimation. This procedure rebalances the analytic sample to more closely resemble the original Wave-1 population and mitigates bias due to differential attrition that is correlated with observed characteristics. Importantly, IPW corrects for selection on observables rather than assuming random attrition, while preserving the within-individual identification afforded by the fixed-effects design.Footnote
1
$p \lt 0.001$
) suggests that fixed effect model is more favorable over random effect model in the current study (Greene, Reference Greene2008). Last but not least, we implement inverse probability weighting (IPW) in all panel fixed-effects analyses to address potential bias arising from selective attrition between the two survey waves. Specifically, we first estimate each respondent’s probability of being observed in Wave 2 as a function of Wave-1 characteristics. We then weight the fixed-effects models by the inverse of this predicted retention probability, so that individuals who were under-represented among Wave-2 respondents receive greater weight in the estimation. This procedure rebalances the analytic sample to more closely resemble the original Wave-1 population and mitigates bias due to differential attrition that is correlated with observed characteristics. Importantly, IPW corrects for selection on observables rather than assuming random attrition, while preserving the within-individual identification afforded by the fixed-effects design.Footnote
1
4. Results
4.1 Social network typology
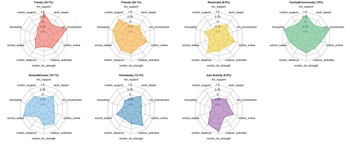
In general, the clustering algorithm successfully identifies the network type for 1,881 out of 2,047 respondents in the first wave, with 92% “prediction accuracy” (i.e., accuracy in guessing cluster membership), suggesting that clusters are sufficiently distinctive. It generates 10 composite variables out of the 43 initial criterion variables, each of which reflects an important network dimension, namely kin support, kin involvement, non-kin support, non-kin tie strength, non-kin online, non-kin distance, homophily, school-based, work-based, and outdoor activities. Based on these composite variables, we find seven robust network types whose characteristics are visualized in Figure 1 and described below (for further explanations, see Section A3, Supplementary Material).
Radial graph mapping social network types on ten composite variables.

Visual comparison between spectral clustering and agglomerative clustering.
-
1. Family networks (22%) exhibit the highest levels of both kin support and kin involvement compared to other networks, whereas several key indicators representing non-family-oriented network activities, including non-kin support, non-kin tie strength, school-based, and homophily, are far below average.
-
2. Friend (31%). This friend-focused network demonstrates the highest non-kin involvement, in terms of non-kin support, homophily, and non-kin tie strength, while having lower-than-average scores for kin-related dimensions. Individuals embedded in this type of network have a stronger online rather than offline presence, which is probably due to the obstacles of face-to-face non-kin interactions posed by the pandemic.
-
3. Restricted networks (10%) are significantly limited regarding both kin and non-kin involvement. Moreover, except for strong online activities and living far away from their peers, all other network features remain at the average level.
-
4. Family & Community networks (10%) have outstanding levels of kin support, kin involvement as well as homophily, and above-average scores in terms of non-kin tie strength, school-based, and yet the support by non-kin members is only near the average level. Individuals with this network type are likely to have relatively frequent contact with peers of the same age and same educational background.
-
5. School & Career networks (17%) are characterized by the highest levels of connections with schoolmates and colleagues at work. It shares a similar pattern with the Friend network regarding non-kin support, homophily, and non-kin tie strength, but they tend to live closer and involve more frequent outdoor activities with non-kin members. Also, the level of support received from kin and non-kin is lower than the Friend network.
-
6. Just Activities (10%). The hallmark of this network is that it evolves around outdoor social activities with diverse groups. However, only a constrained amount of support from both the kin and non-kin members exists due to the nature of these social ties.
-
7. Homebody (1%) is a small cluster. As homebodies, they seldom engage in outdoor activities. Instead, individuals mainly rely on online social interactions with strong ties and live relatively far from non-kin members. Limited support is found in this type of network.
Table 2 summarizes the sociodemographic and health profiles of these network types, showing strong associations between core network types and mental health. However, we can also find that network types are not randomly distributed among individuals with different backgrounds, such as gender, marital status, age, and SES, which suggests further analysis is needed to address potential confounding factors.
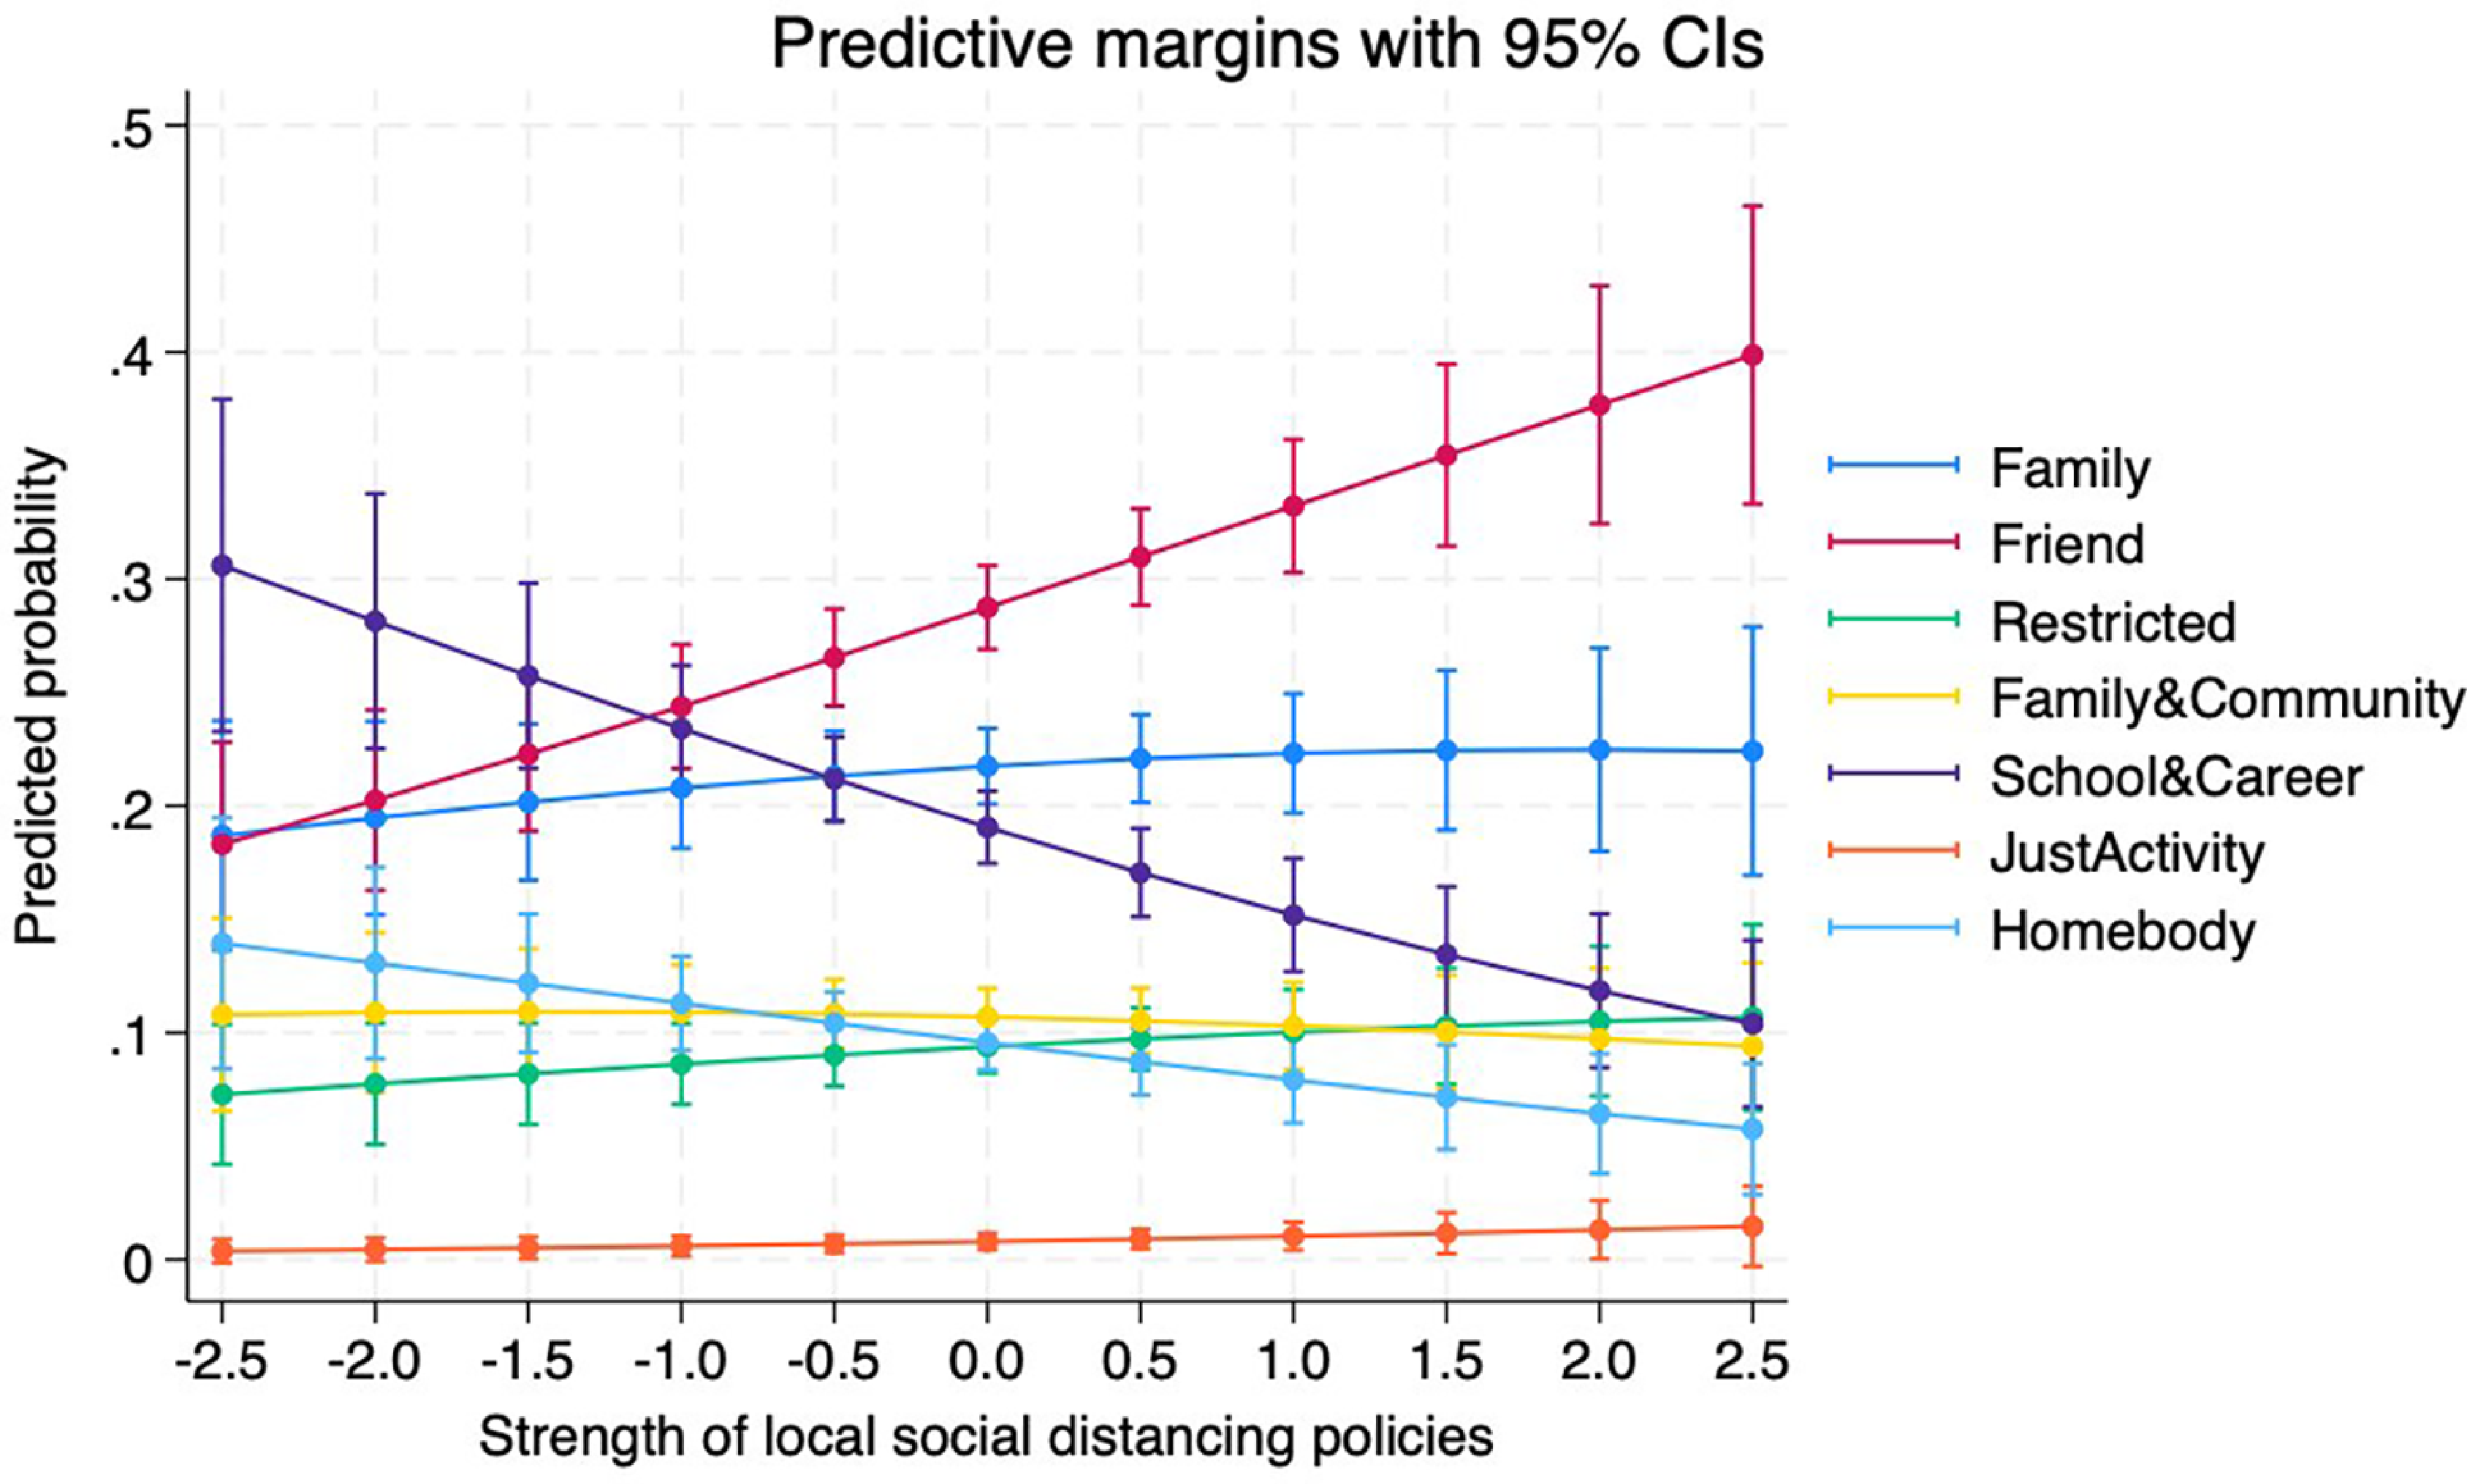
Predicted probability of having a certain network type by social distancing policies, both waves.
4.2 Social distancing policies and changes in personal network type
To investigate the role of the pandemic-induced social distancing policies, we employ multinomial logistic regression to predict the probability of having certain network types with the strength of social distancing policies, setting the above demographic covariates and COVID experience (i.e., the number of cases, knowing someone tested positive) as controls (see Table S7, Supplementary Material). The results based on both waves’ pooled data are visualized in Figure 3, where a greater score of the strength index suggests the local pandemic is more disruptive, such as more regulation on public space opening, outdoor gathering, etc. There is a clear downward trend in the possibility of School & Career networks, which indicates that such a network type relies heavily on the availability of spaces in schools and in workplaces, and the lockdown and school closure drive individuals to withdraw from them. By the same token, the possibility of having Just Activity networks also declines as the pandemic forces the cancellation of public gatherings and outdoor activities. On the contrary, the possibility of the Friend network rises dramatically, which could be explained by resource-seeking behaviors such as the frequent usage of online contact and communication to exchange pandemic-related information. However, Family networks only demonstrate a slight increase as the social distancing policies become more stringent. This is probably because mutual support among family networks is usually an obligation as constrained by social context. Hence, they tend to be stable regardless of whether individuals are in normal circumstances or difficult times (Offer and Fischer, Reference Offer and Fischer2017).
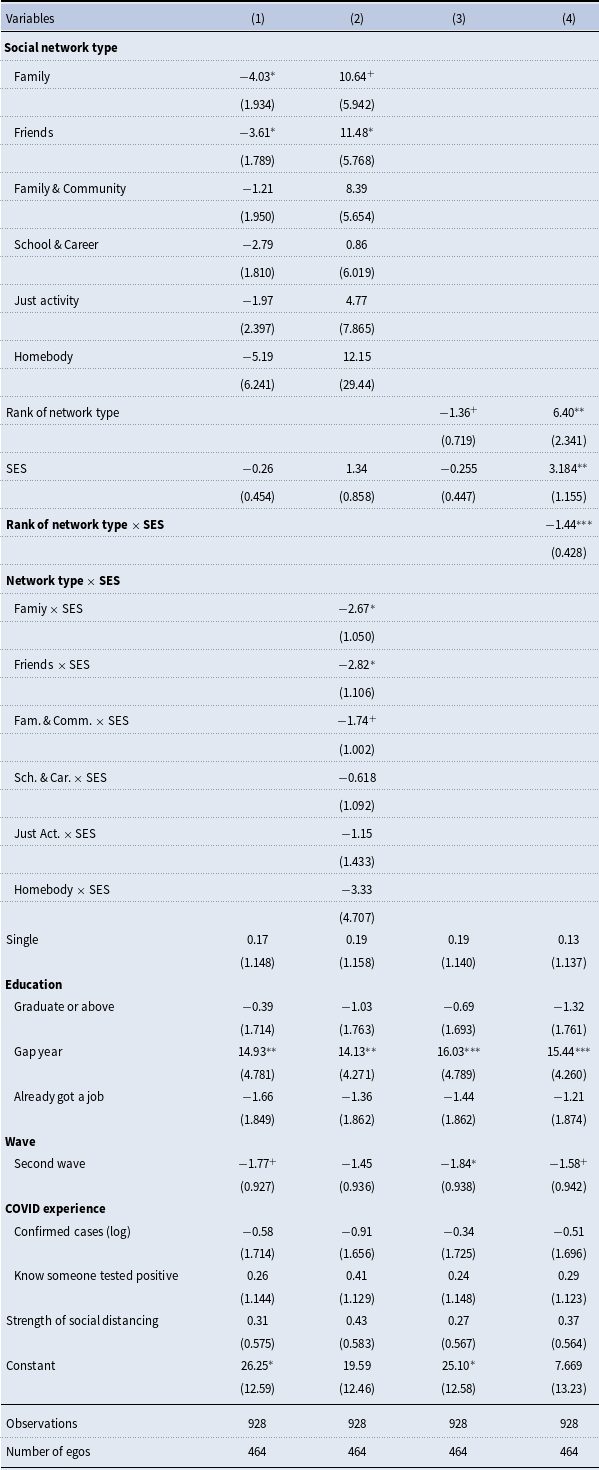
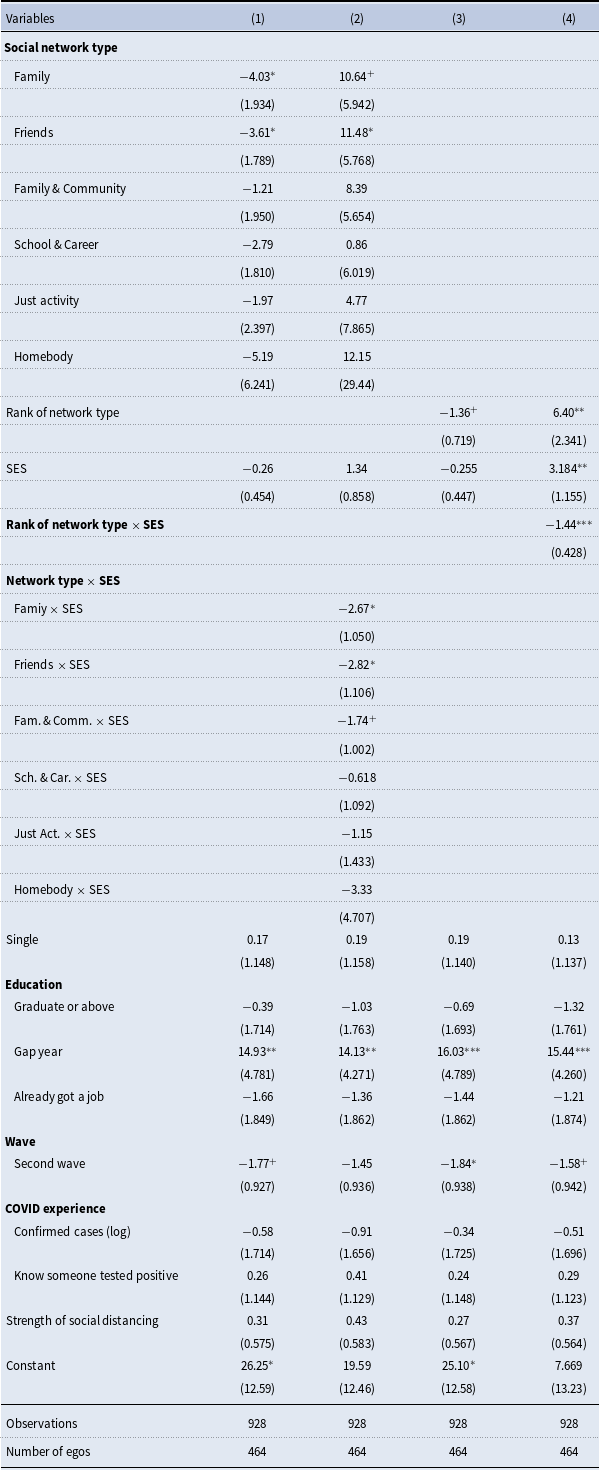
Fixed effect models predicting the level of depressive symptoms
Notes: (1) Standard errors in parentheses. (2) *** $p\lt 0.001$
, **
$p\lt 0.001$
, ** $p\lt 0.01$
, *
$p\lt 0.01$
, * $p\lt 0.05$
,
$p\lt 0.05$
, $^+$
$^+$ $p\lt 0.1$
. (3) Results are IPW-adjusted to account for potential panel attrition bias. (4) Reference groups: Restricted, Not single, Undergraduate, Wave one, Don’t know someone who tested positive.
$p\lt 0.1$
. (3) Results are IPW-adjusted to account for potential panel attrition bias. (4) Reference groups: Restricted, Not single, Undergraduate, Wave one, Don’t know someone who tested positive.
4.3 Fixed-effect models predicting mental health by networks
We use personal fixed effect models to predict the buffering effect of social networks on health, and the results are reported in Table 3. Unlike other regressions, researchers only need to control time-varying confounders in fixed effect models. Relationship status, education, socioeconomic status, and COVID-related experience are factored into our model to control their potential impacts on mental health. Time-fixed effects are also included in our models. Model 1 estimates the effect of each network type on depressive symptoms, setting the Restricted network as the reference group. Results reveal that Family and Friend networks have the strongest buffering effect on mental health, followed by School & Career networks. Moreover, as shown by the negative coefficients of all networks, Restricted is among the least healthy networks that yield the highest level of depressive symptoms.
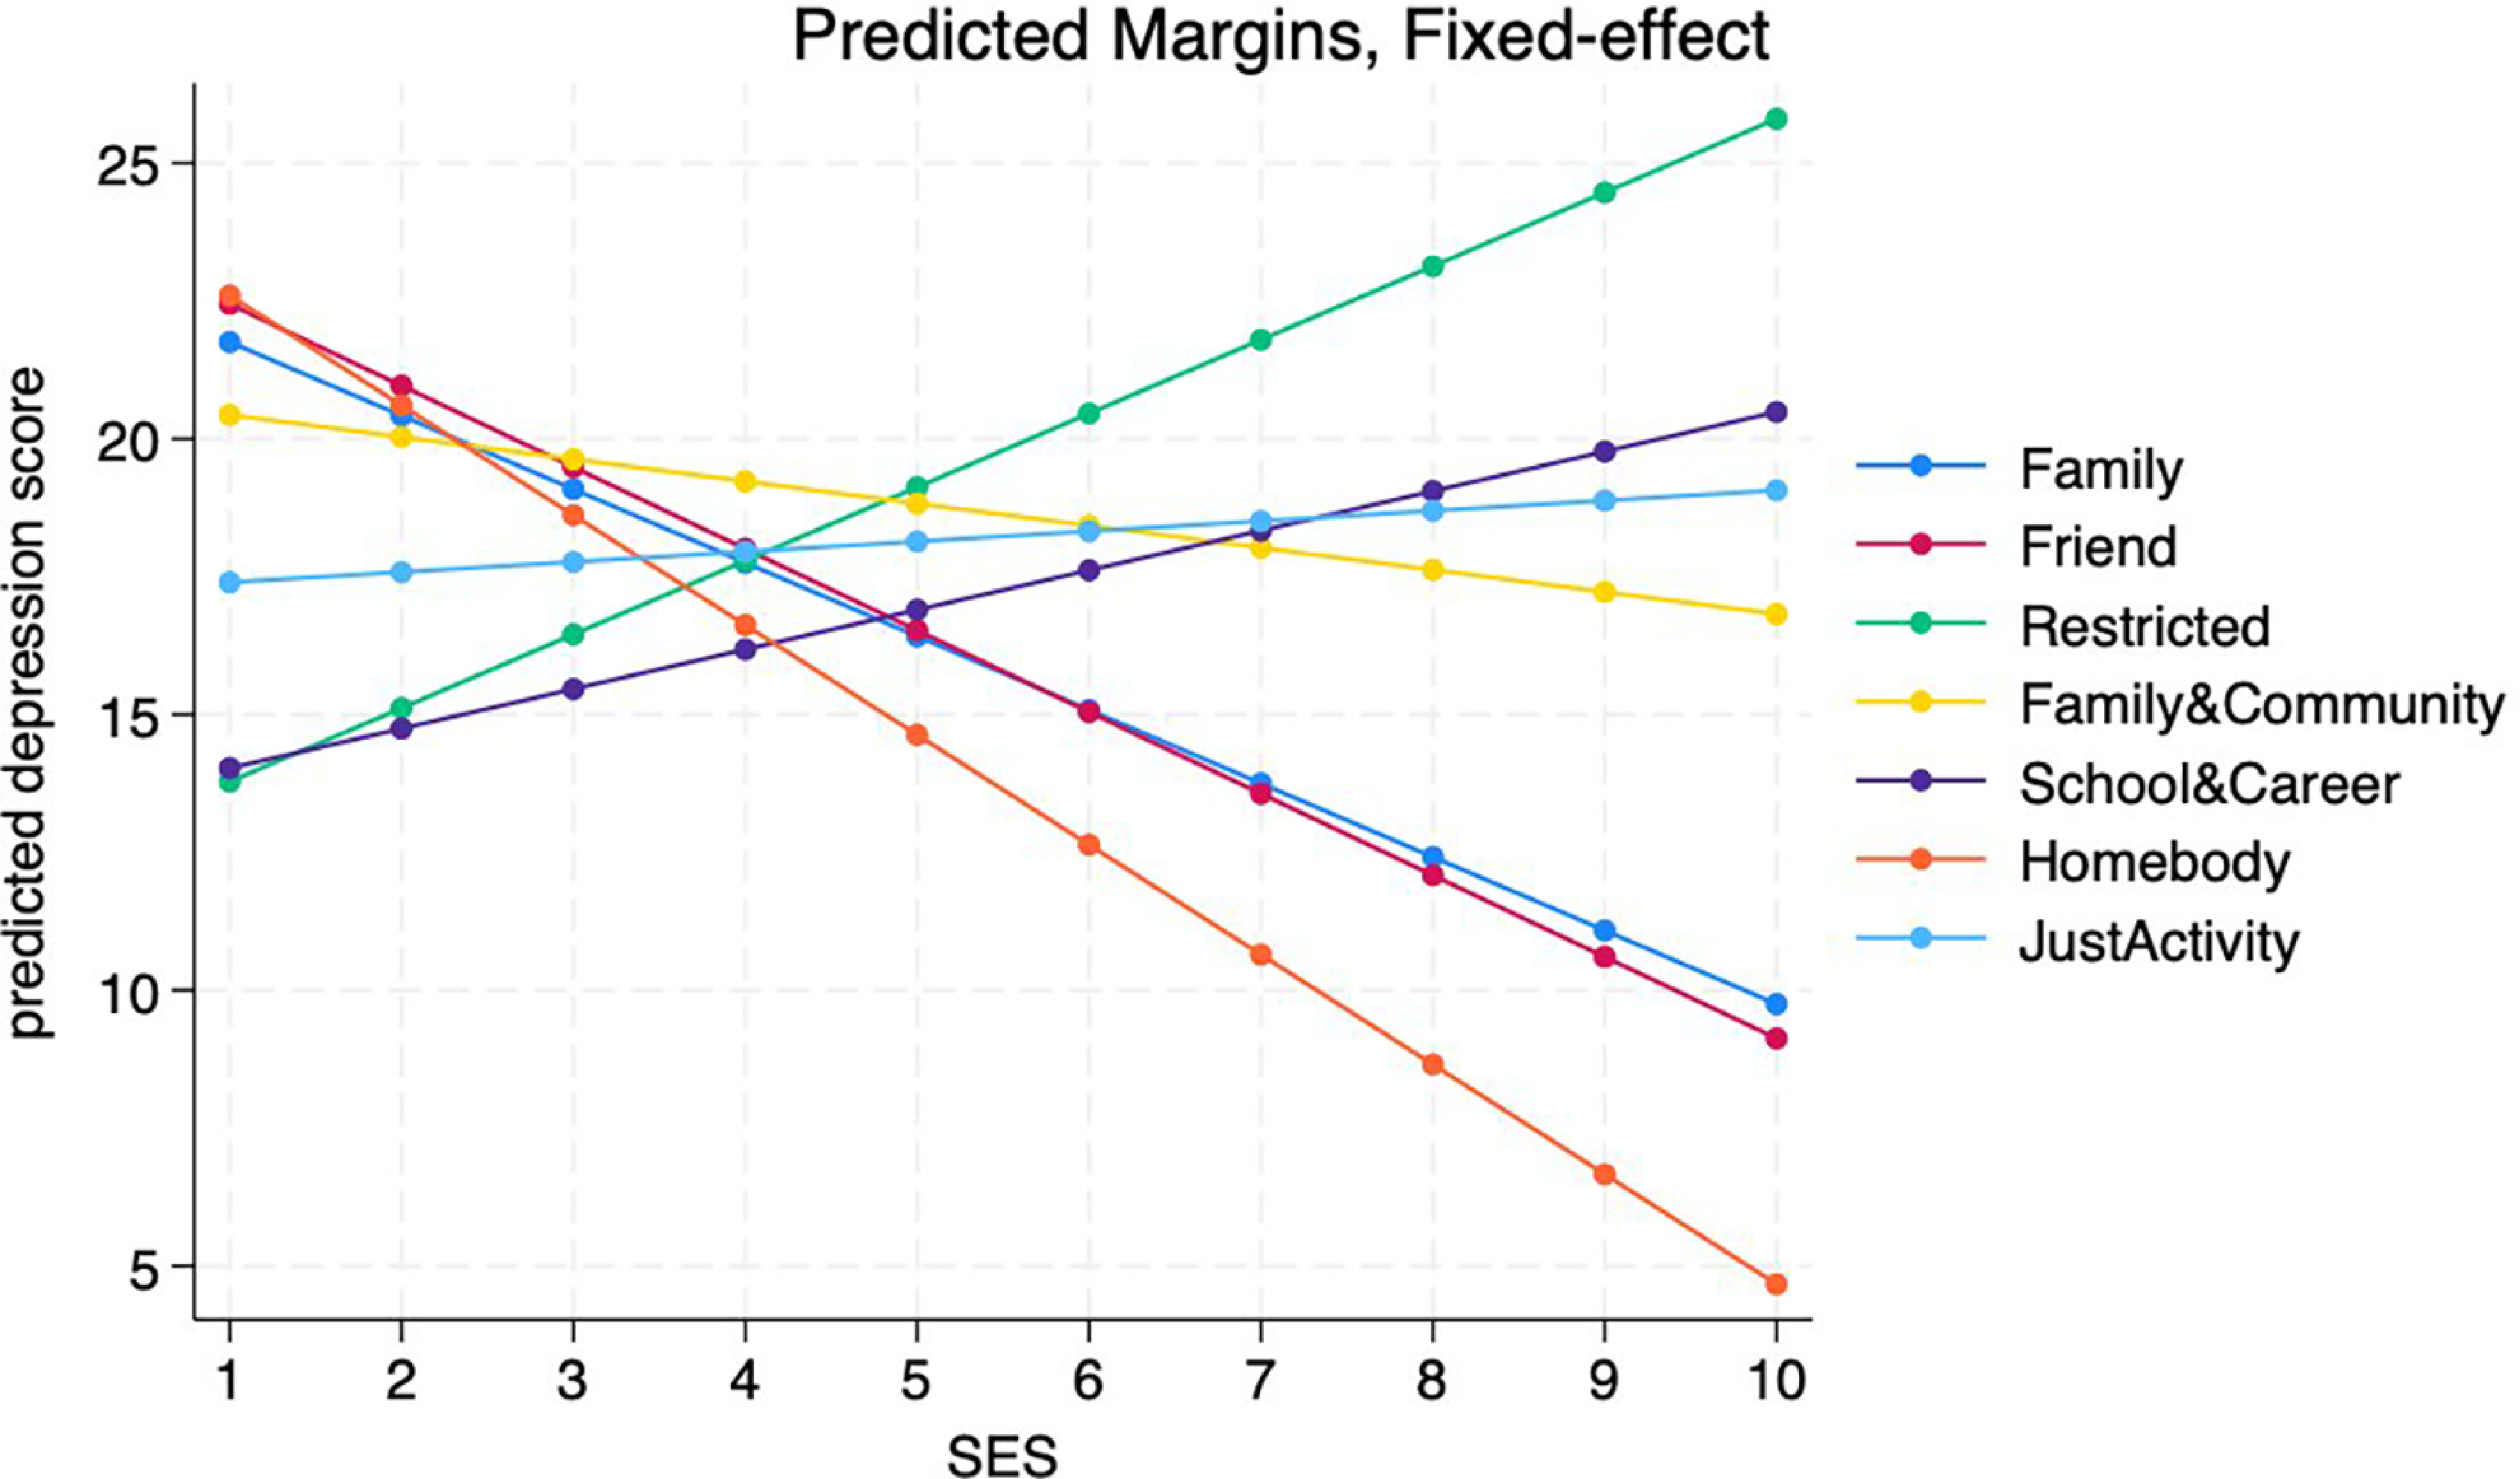
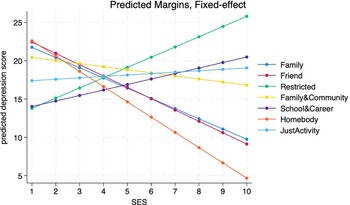
However, these general effects are contingent on SES, and thus Model 2 further includes the interaction term between each network type and SES. The result shows that the interaction effect between SES and Family networks and Friend networks is statistically significant, which indicates that the health benefit of changing into these network types will be considerably amplified if individuals belong to a higher SES group. The heterogeneous health impact of different network types is visualized in Figure 4. It can be discovered that changing network types into Family and Friend, as a response to the pandemic, only brings mental health benefits for higher status individuals, which become more pronounced as their SES increases. For those whose SES score ranks below average (5.4), such changes in network types do not have protective effects and may even incur mental health penalties. This stark contrast unveils how people with low SES fail to mobilize satisfying social support from their families and friends during the pandemic.
Predicted level of depressive symptoms by network type and SES, both waves.
How do we make sense of the heterogeneous effects of network types on individuals’ mental health? Prior research suggests that social support is a key mechanism linking social networks to mental health. We therefore examine whether the mental health effects of network types align with the supportive resources embedded in each type. Using Table 2, we rank network types by their combined levels of actual and perceived support. Support is highest in Family, Friends, and Family & Community networks, all of which show above-average levels on both dimensions. At the other end, Restricted networks are the least supportive, with below-average levels of both actual and perceived support. School & Career, Just Activity, and Homebody networks fall in between: each is relatively high on one dimension of support but low on the other. In Model 3, we replace the categorical network types with this continuous “network supportiveness” rank to more directly assess the role of embedded support. The fixed-effects estimates indicate that moving into a more support-enriching network type is generally associated with improved mental health. Adding an interaction between network supportiveness (rank) and SES in Model 4 yields a similar conclusion: the mental-health benefits of moving into a more supportive network type accrue primarily to individuals with higher SES. The negative interaction term further implies that the same shift may be detrimental for low-SES individuals. To probe the mechanisms underlying these patterns, we also conduct a conventional path analysis linking network types, social support, and mental health to confirm our findings. Mediation analysis reveals that perceived and actual support fully accounts for the mental health disparities among 5 out of 7 network types, resulting in a partial mediation effect between core network type and depressive symptoms. This validates that our modeling results are robust and consistent (see Section A4, Supplementary Material).
5. Discussion and conclusion
The present study applies random forest and clustering algorithms to identify 7 coherent social network types that comprehensively encapsulate important aspects of network properties. Our analysis reveals that individuals withdraw from two network types closely related to the context of public spaces, namely School & Career and Just Activity, as the pandemic becomes more disrupted. In other words, Hypothesis 1 has been supported. However, Hypothesis 2 only receives partial support, because though Friend networks become more prevalent, the probability of having Family and Family & Community networks that are high in kin or nonkin support does not change to a great extent. When it comes to mental health, SES moderates the effect of network type, and social support also largely accounts for such effects. Therefore, Hypotheses 3 and 4 are confirmed. Though the partial mediation effect of social support suggests that it is not the sole mediator, and implies that network types may impact health through other mechanisms such as diffusion (Shiovitz-Ezra and Litwin, Reference Shiovitz-Ezra and Litwin2012), which warrants further study. In addition, with regard to previous findings in East Asian contexts supporting or rejecting the superiority of a Friend or Family network (e.g., Cheng et al., Reference Cheng, Lee, Chan, Leung and Lee2009; Park et al., Reference Park, Jang, Lee, Chiriboga, Chang and Kim2018), we discover that they both generate similarly desirable levels of mental health outcomes for higher-SES individuals. This may not seem surprising given that extant literature seldom considers personal and structural backgrounds that can prevent individuals from enrolling in Friend networks (Jain et al., Reference Jain, Murty and Flynn1999; Li et al., Reference Li, Yang and Zhang2018).
The current paper contributes to the line of network typology-health study in several ways. First, we derive a network typology among younger adults that comprehensively represents the main network properties suggested by related theories. Based on the original method developed by G&F, we find that spectral clustering could help obtain more refined and intuitive results for identifying network types. Future researchers can draw from this typology framework as a convenient tool to characterize personal networks and follow the guidance and code we provide to implement this algorithm for their own studies. Second, the results reveal how individuals change their network types as the pandemic becomes more disruptive and shed light on the health consequences of such dynamics. Since individuals increasingly turn to Friend networks for support and resources as a response to the pandemic’s challenges, the mental health benefit for changing into these types is reserved only for the higher SES groups, suggesting that the advantage groups are more capable of mobilizing their networks to cope with the pandemic while their lower status counterparts failed to do so and may even receive health penalty. This has profound implications that the pandemic lays bare the inequality embedded in networks along the SES line and further exacerbates social inequality in health due to the heterogeneous protective effect associated with such network dynamics. Third, our findings of social support echo the burgeoning literature that not only actual but also perceived support has implications for mental health outcomes. We thereby highlight the importance of social support as a two-dimensional construct and a mechanism underlying networks and mental health outcomes. The paper provides useful information for post-pandemic recovery for health practitioners and policymakers by highlighting how personal network deficits widen the chasm between the rich and the poor during the pandemic.
Admittedly, this study has several limitations. First, we experienced attrition between the two waves, an expected challenge given the constraints of data collection during COVID-19 outbreaks. An attrition analysis (Supplementary Material A5; Table S5) shows that attritors and completers were largely similar at baseline in depressive symptoms, SES, education, and network-type distributions, though attritors and completers have systematic differences in pandemic-related factors: completers lived in areas with higher COVID-19 prevalence, faced stricter policies, and were more likely to know someone tested positive. To address potential selection bias from these observed differences, we apply inverse probability weighting (IPW) in all main fixed-effects models and control for these baseline characteristics; the results are substantively unchanged. While response bias cannot be fully ruled out, the fixed-effects design mitigates confounding by focusing on within-person change over time. Second, it’s worth noting that our attrition diagnostics are most consistent with a health-selection pattern, if any, meaning that respondents who dropped out at Wave 2 tend to have better-resourced networks and lower depressive symptoms. If such selective attrition occurred, it would suggest that our findings underestimate the true network effect. In other words, such possible bias from health-based selection would tend to make our estimates conservative, implying that the true mental-health benefits of moving into more supportive network types (and the associated inequalities across SES groups) may be at least as large as what we report, rather than reversing our conclusions. Despite these constraints, CovNetps-Wuhan remains, to our knowledge, the only egocentric network panel study available in China during the pandemic, offering rare leverage for studying crisis-induced network turnover and mental health inequality in this special period. Third, focusing on the college population may raise generalizability concerns. Network studies drawing on student samples usually report larger friendship networks, yet the size of global networks (i.e., the combination of all personal networks) remains the same as the general population (Wrzus et al., Reference Wrzus, Hänel, Wagner and Neyer2013). Since our results focus on the heterogeneous health consequences across networks within different SES groups, the current findings may be even more pronounced in the general population. Finally, these conclusions are mainly applicable to young adults in the Chinese context, whose mental health has been hit most heavily during the pandemic. Nevertheless, as social convoy theory suggests, the impact of social network types varies across different age groups and cultural contexts. Therefore, we encourage future studies to replicate this research on older age groups or in other cultural contexts.
Acknowledgments
The authors thank Claude Fischer, David Harding, Eric Giannella, Keunbok Lee, Robert Braun, and the anonymous reviewers at Network Science for their insightful comments and support for the manuscript. We gratefully acknowledge Hongye Chen, Lewei Huang, Zhenhu Li, Linlin Mo, Rui Pan, Guoliang Qiu, Zijie Song, Jiaye Su, Hangcheng Zheng, and Jianhua Zhou for their participation in the original survey data collection, without which the CovNetps project would not have been possible. The authors take full responsibility for the content of this paper.
Supplementary material
The supplementary material for this article can be found at https://doi.org/10.1017/nws.2026.10031.
Data availability statement
Replication code and the CovNetps-Wuhan dataset are available under data sharing agreements in Harvard Dataverse: Su, Zhixiang. 2021. “Replication Code for: Embedded Inequality: Personal Network Dynamics and Mental Health during COVID-19.” https://doi.org/10.7910/DVN/8NSPFA.
Author contributions
Z.S. and P.X. designed the research; Z.S. and P.X. analyzed the data; Z.S. and P.X. wrote the paper; W.D. supervised and administered the project.
Funding statement
This research received financial support from St. Antony’s College, University of Oxford. The funders had no role in study design, data collection and analysis, decision to publish, or preparation of the manuscript.
Competing interests
All authors have approved this submission and declare no conflict of interest.
Ethical approval
Ethical approval was obtained from the Human Subjects Ethics Sub-Committee of the School of Social and Public Administration, East China University of Science and Technology.





 Open access

